APM & Tracing
The APM & Tracing section in KloudMate gives you end-to-end visibility into how requests travel across your services, along with service-level health and dependency analysis.
Core Concepts
Section titled “Core Concepts”- APM Views is service-centric. Use it to compare latency, throughput, error rate, and dependencies across services.
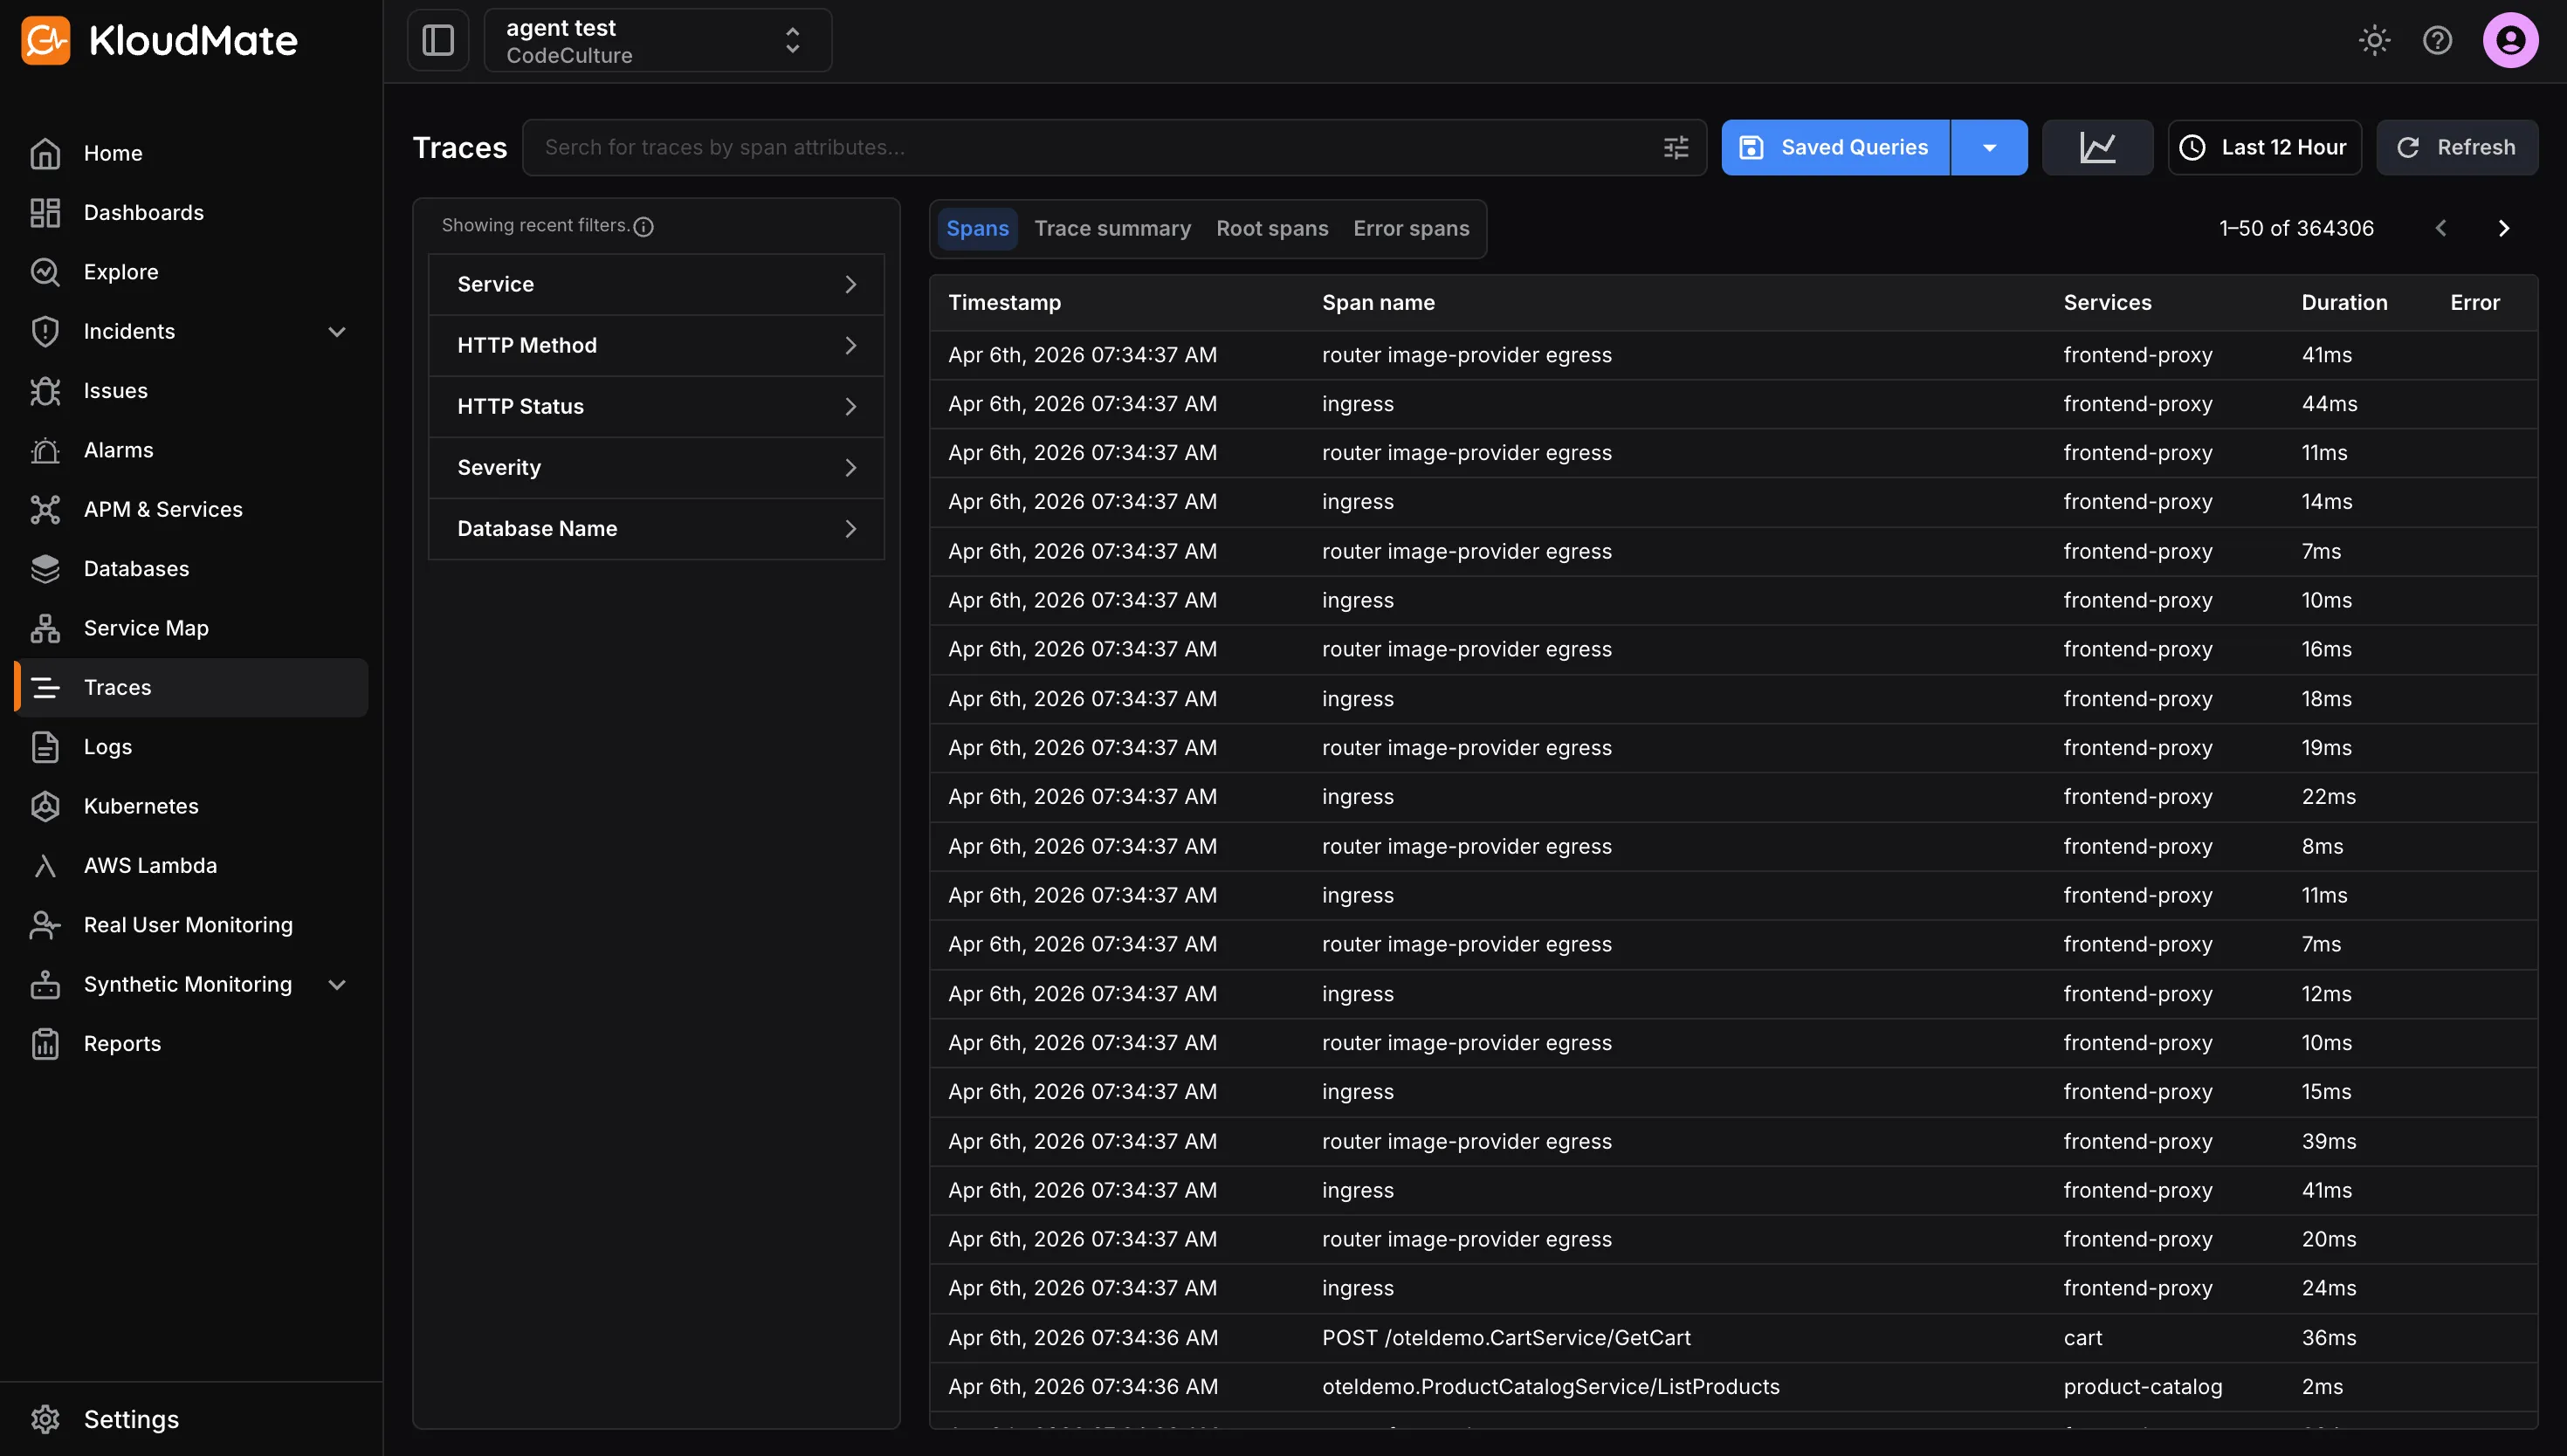
- Trace Explorer is request-centric. Use it to debug a specific request, span, or execution path across multiple services.
Start in APM Views when you need higher-level service health and dependency analysis. Navigate to Trace Explorer when you need to inspect trace-level detail to find the root cause of an issue.
Instrumentation Paths
Section titled “Instrumentation Paths”KloudMate supports multiple ways to generate APM and tracing data:
- KloudMate Agent eBPF Observability for kernel-level tracing and RED metrics without code changes or restarts
- Auto Instrumentation for the preferred Kubernetes APM flow through the KloudMate Agent
- Manual Instrumentation for SDK-based tracing, application metrics, and custom metrics with the most control.