DNS Monitor
The DNS Monitor helps ensure your domain’s DNS resolution is functioning correctly by verifying DNS records and response times from configured servers.
Creating a New DNS Monitor
Section titled “Creating a New DNS Monitor”- Navigate to Synthetic monitoring > Monitors.
- Click Add new.
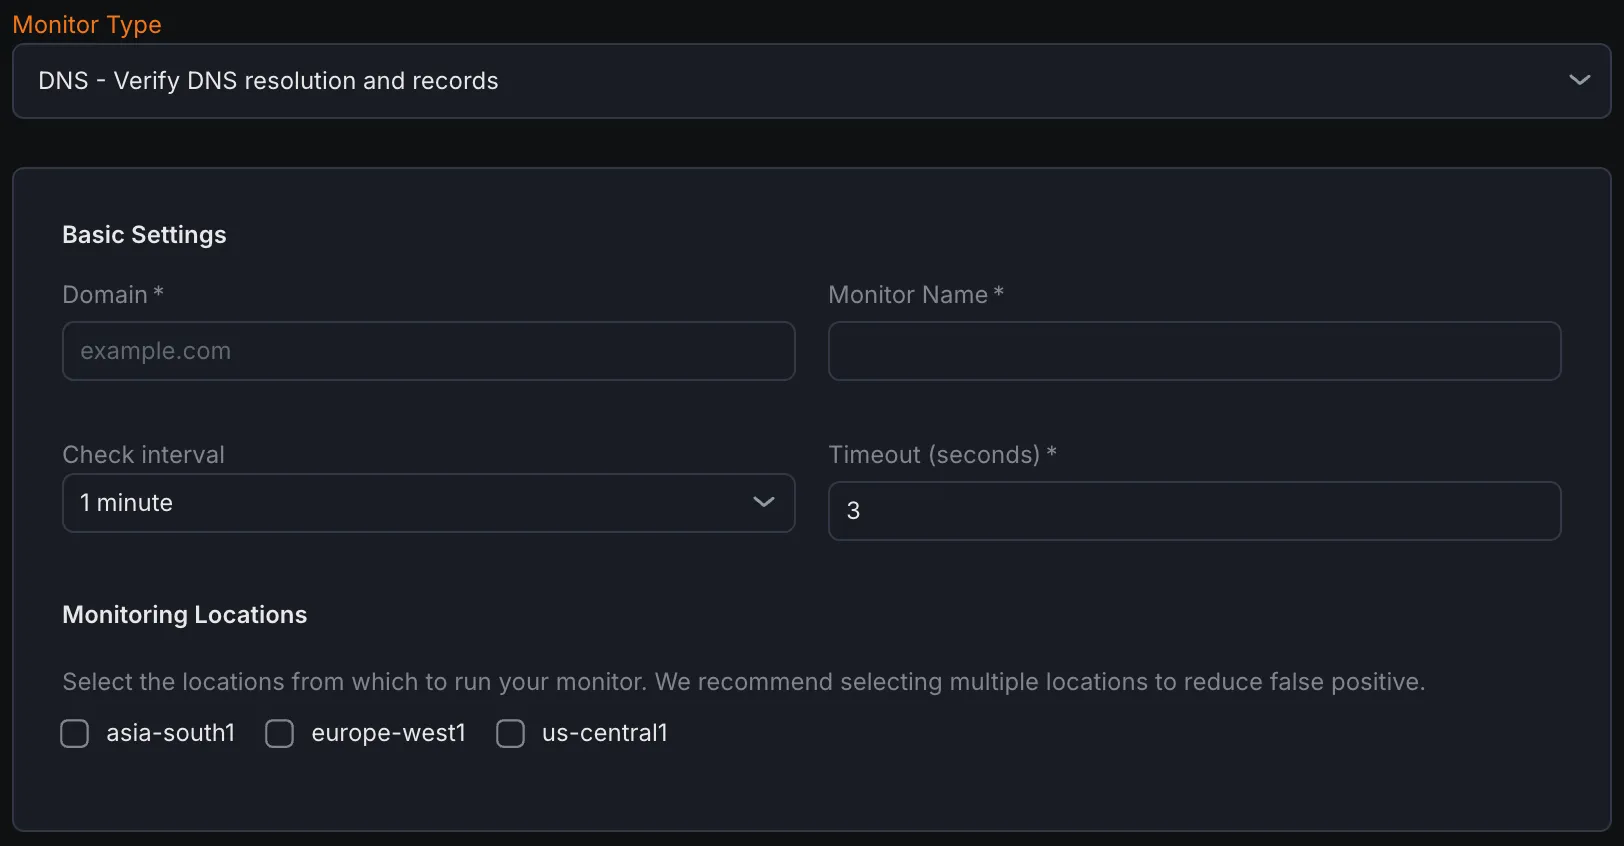
- From the monitor type dropdown, select DNS - Verify DNS resolution and records.
Basic Settings
Section titled “Basic Settings”- Domain Enter the domain name you wish to monitor.
- Monitor Name Provide a descriptive name to identify the DNS monitor.
- Check Interval Set how often the DNS queries should be performed to check the domain’s DNS resolution.
- Timeout Define the maximum amount of time the monitor waits for a DNS response before marking it as failed.
- Monitoring Locations Choose one or multiple locations from which the DNS queries will be executed. This helps test DNS resolution from diverse geographic points.
Notification Settings
Section titled “Notification Settings”Select the notification channels to receive alerts when the monitor detects failures in DNS resolution or record validation.
DNS Configuration
Section titled “DNS Configuration”- Record Types Specify the DNS record types to query, such as A, AAAA, CNAME, MX, TXT, etc. Each type represents different information about the domain.
- Nameservers (Optional) Optionally specify the nameservers hosting your domain’s DNS records for targeted checks.
- Enable TCP Enable DNS queries over TCP instead of UDP. TCP-based queries can detect certain DNS issues that UDP-only queries may miss, enhancing reliability checks.
Assertions
Section titled “Assertions”Assertions define what aspects of DNS responses the monitor validates:
- Record Count Checks the number of DNS records returned by the query to ensure completeness.
- Record Value Verifies the actual data contained within the DNS records matches expected values.
- Query Time (ms) Measures the response time of the DNS server to a query, ensuring timely resolution.
- Response Code Monitors the DNS response code returned by the server to detect errors or anomalies.
Metrics
Section titled “Metrics”Metrics available to be monitored in Dashboard section
| Metric Name | Type | Description | Labels |
|---|---|---|---|
| kloudmate_synthetic_check_dns_resolve_time | Gauge | Time taken to resolve the DNS query | check_id, check_name, check_type, target, workspace_id, location |
| kloudmate_synthetic_check_dns_query_time | Gauge | Time taken for a specific DNS query | check_id, check_name, check_type, target, workspace_id, location, record_type |
| kloudmate_synthetic_check_dns_record_count | Gauge | The number of records returned for a specific DNS query | check_id, check_name, check_type, target, workspace_id, location, record_type |
| kloudmate_synthetic_check_request_duration | Gauge | The total time taken for the primary operation of the check (e.g., HTTP request, DNS query, gRPC call). | check_id, check_name, check_type, target, workspace_id, location |
|---|