Log Explorer
Open Logs from the left navigation menu to access Log Explorer.
Log Explorer indexes logs from all connected services and applications. Use it to search large log volumes, inspect structured payloads, save frequently used queries, and investigate issues without leaving the platform.
Log Explorer Walkthrough
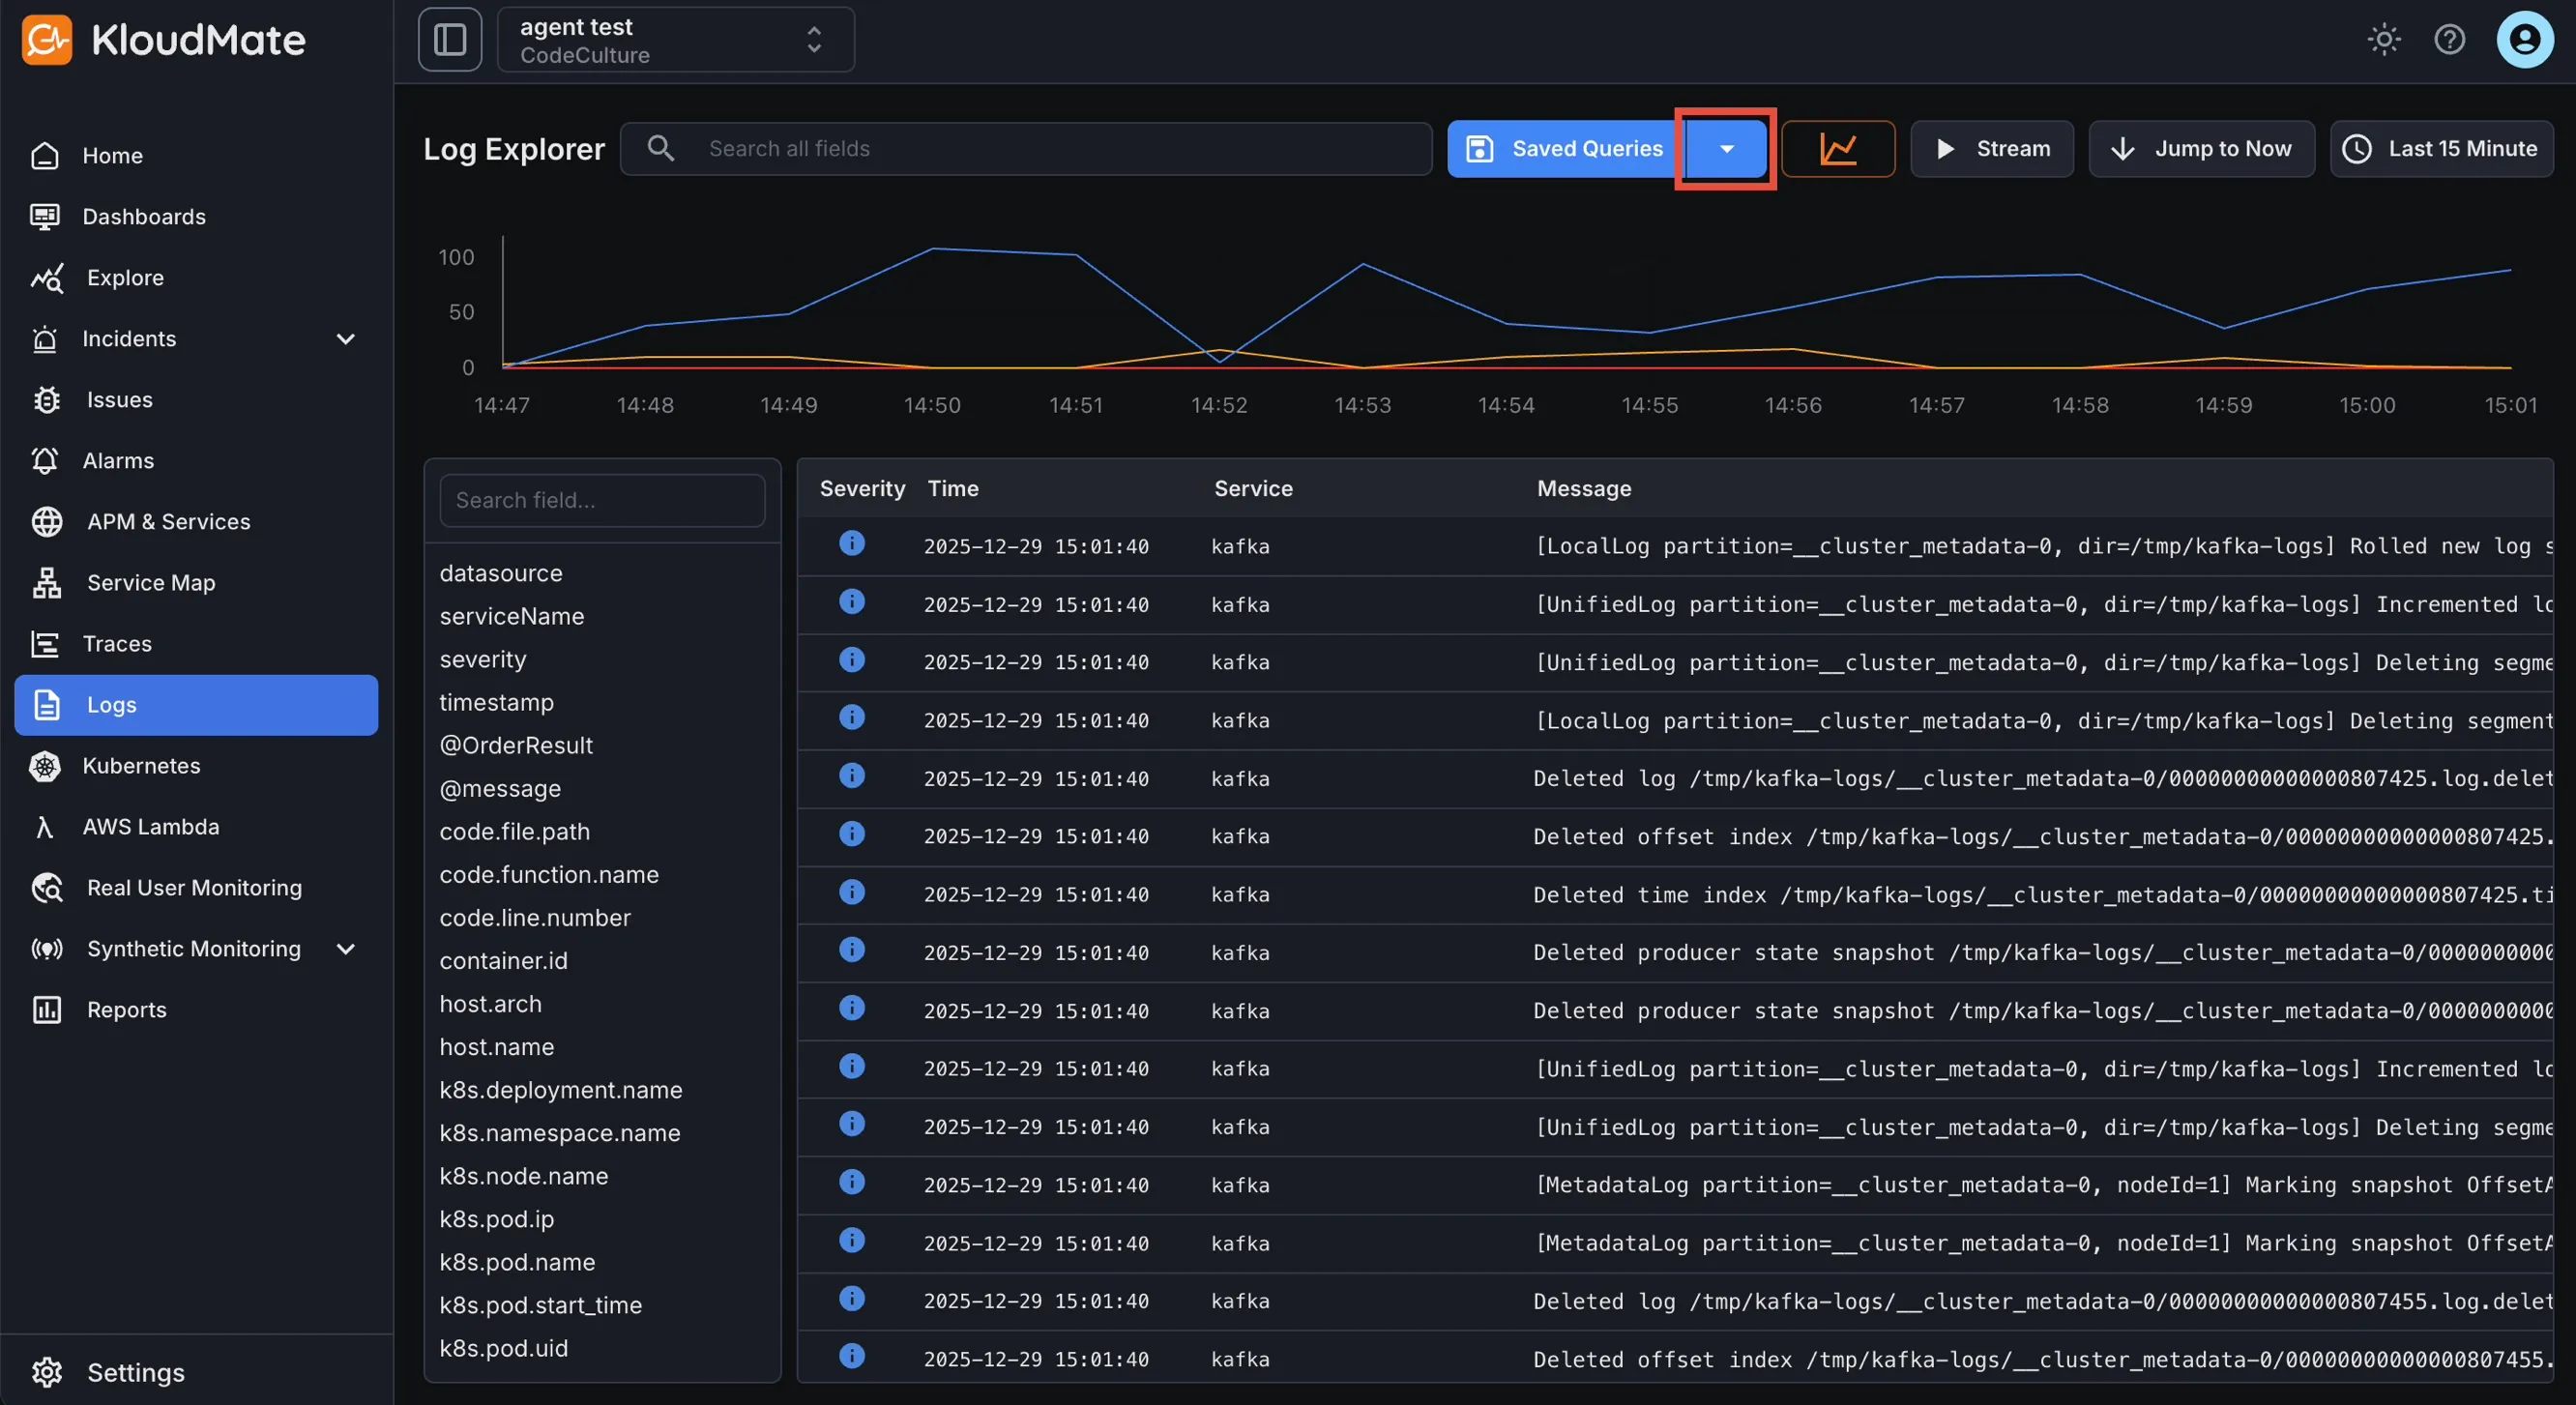
Section titled “Log Explorer Walkthrough”The main view combines a log volume graph with a result list. Each row in the list represents a single log entry and shows the most useful attributes for quick triage.
The graph shows log volume over time. The x-axis represents time and the y-axis represents the number of ingested log entries.
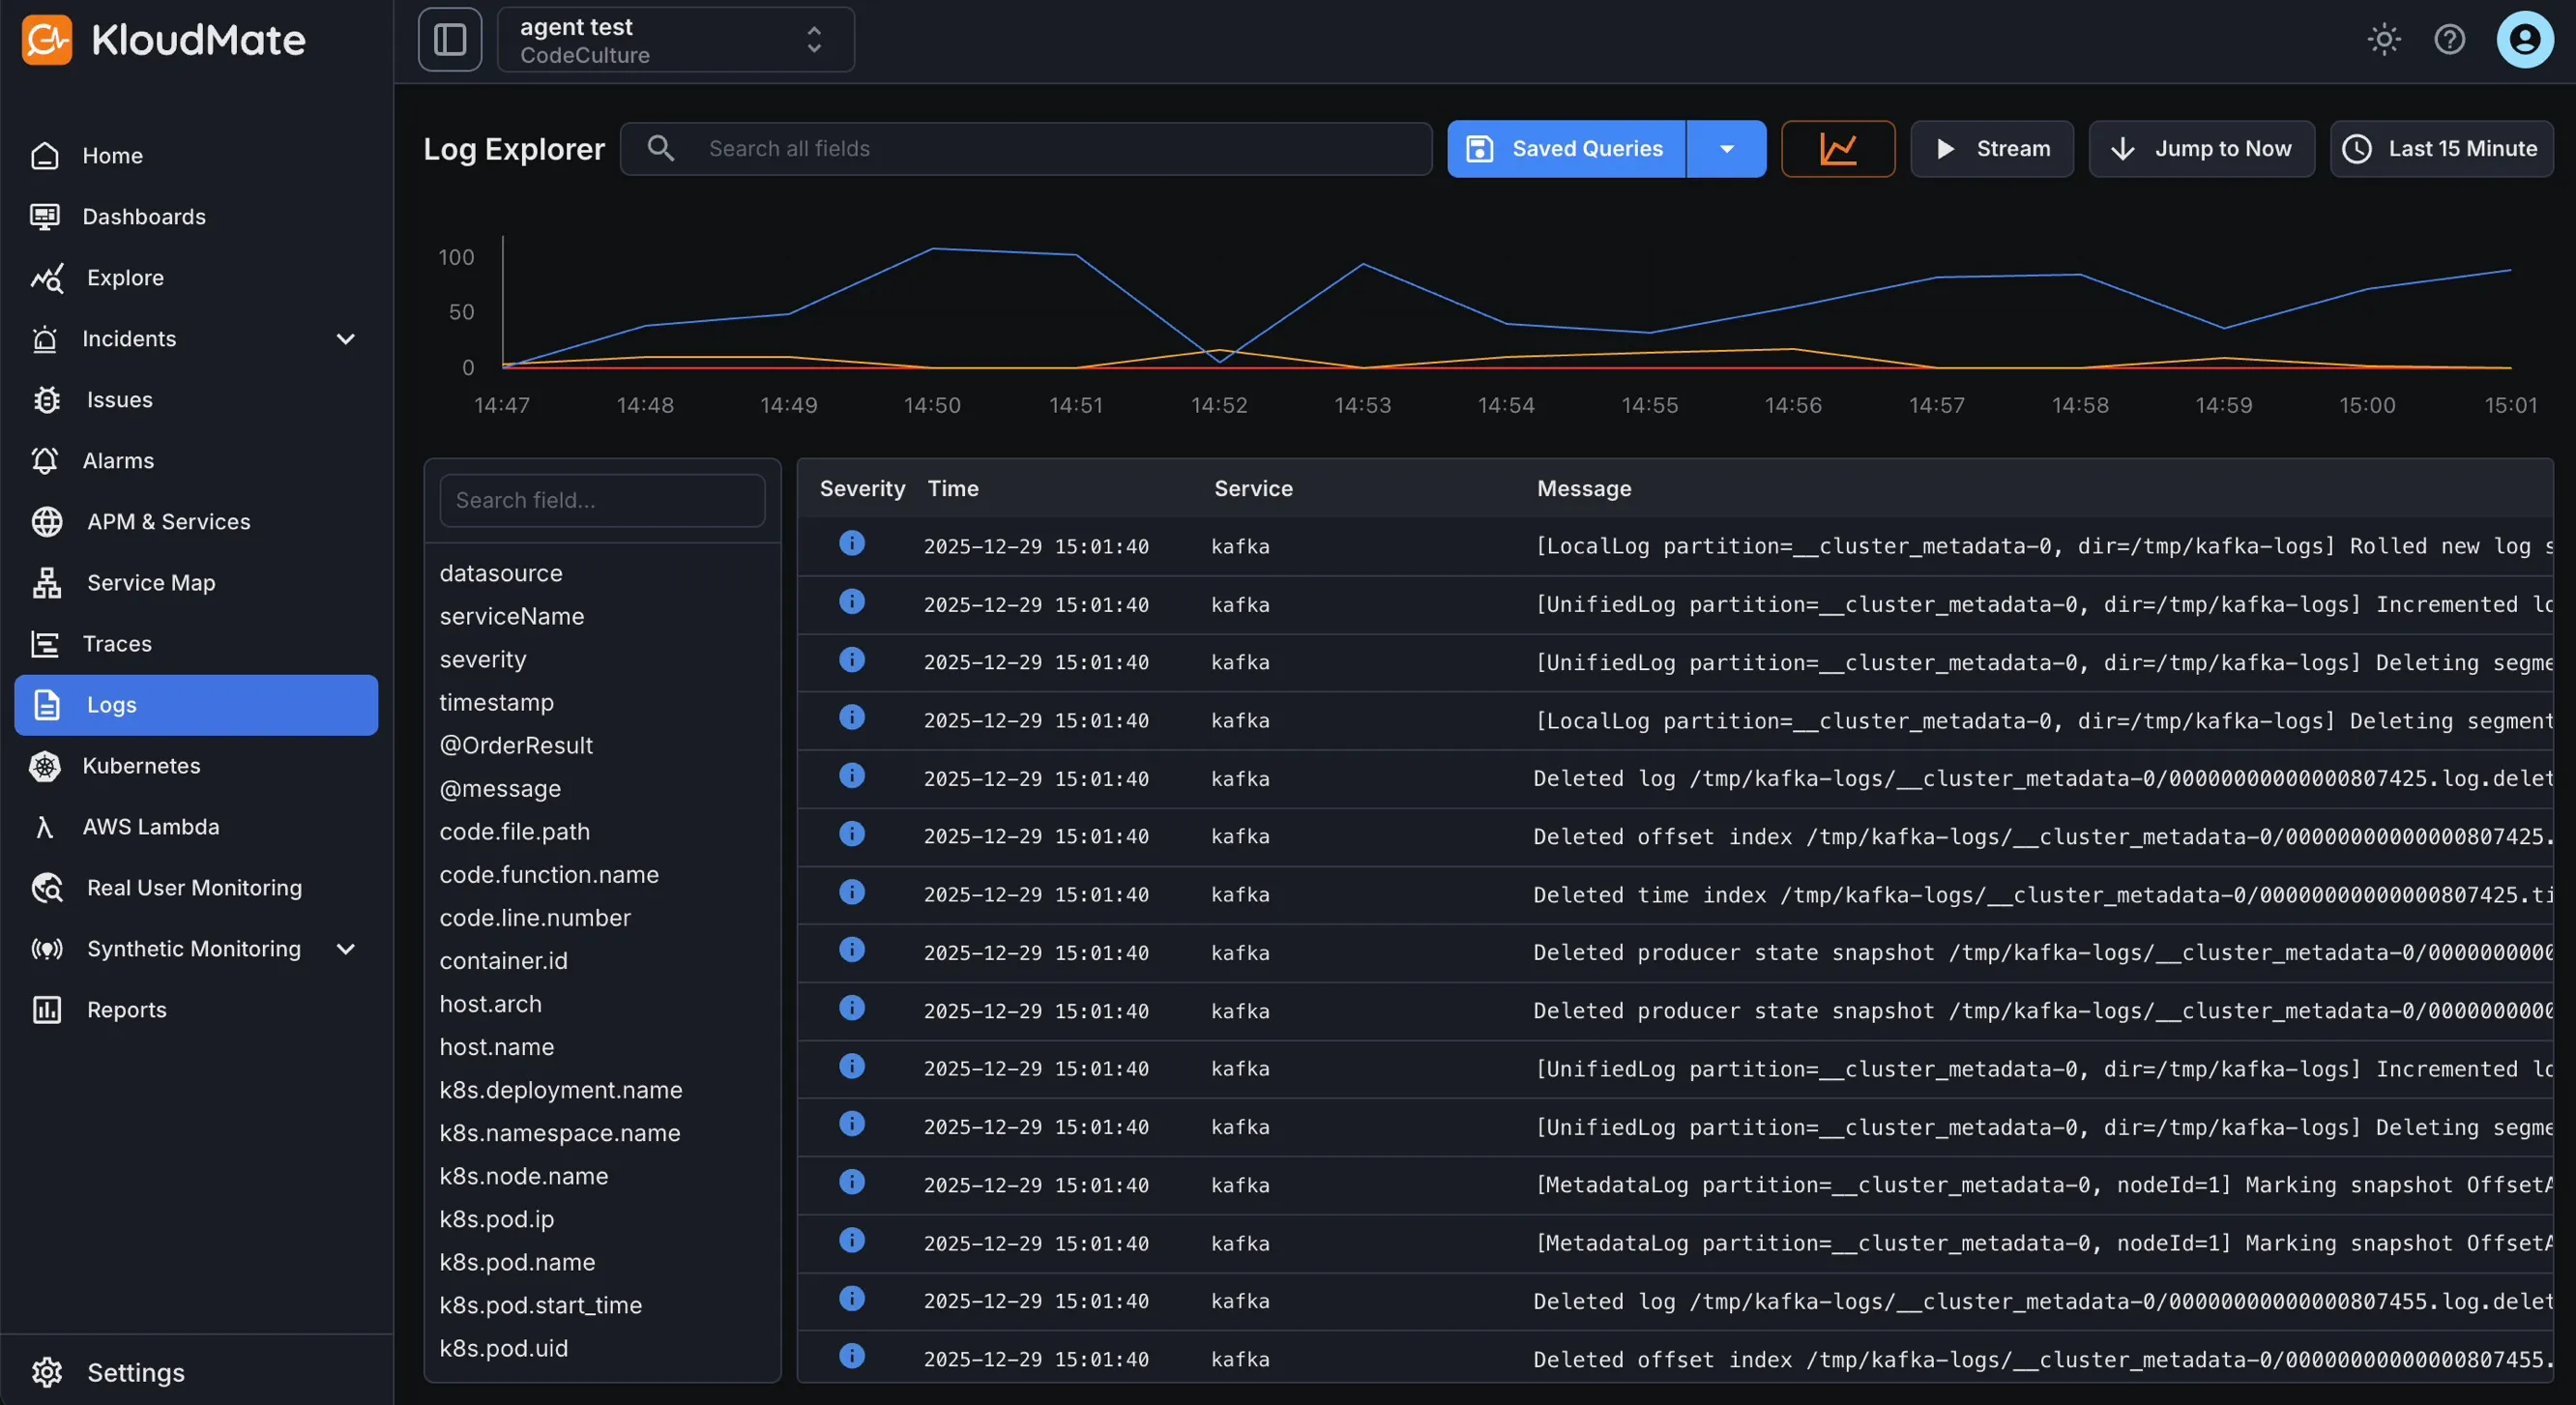
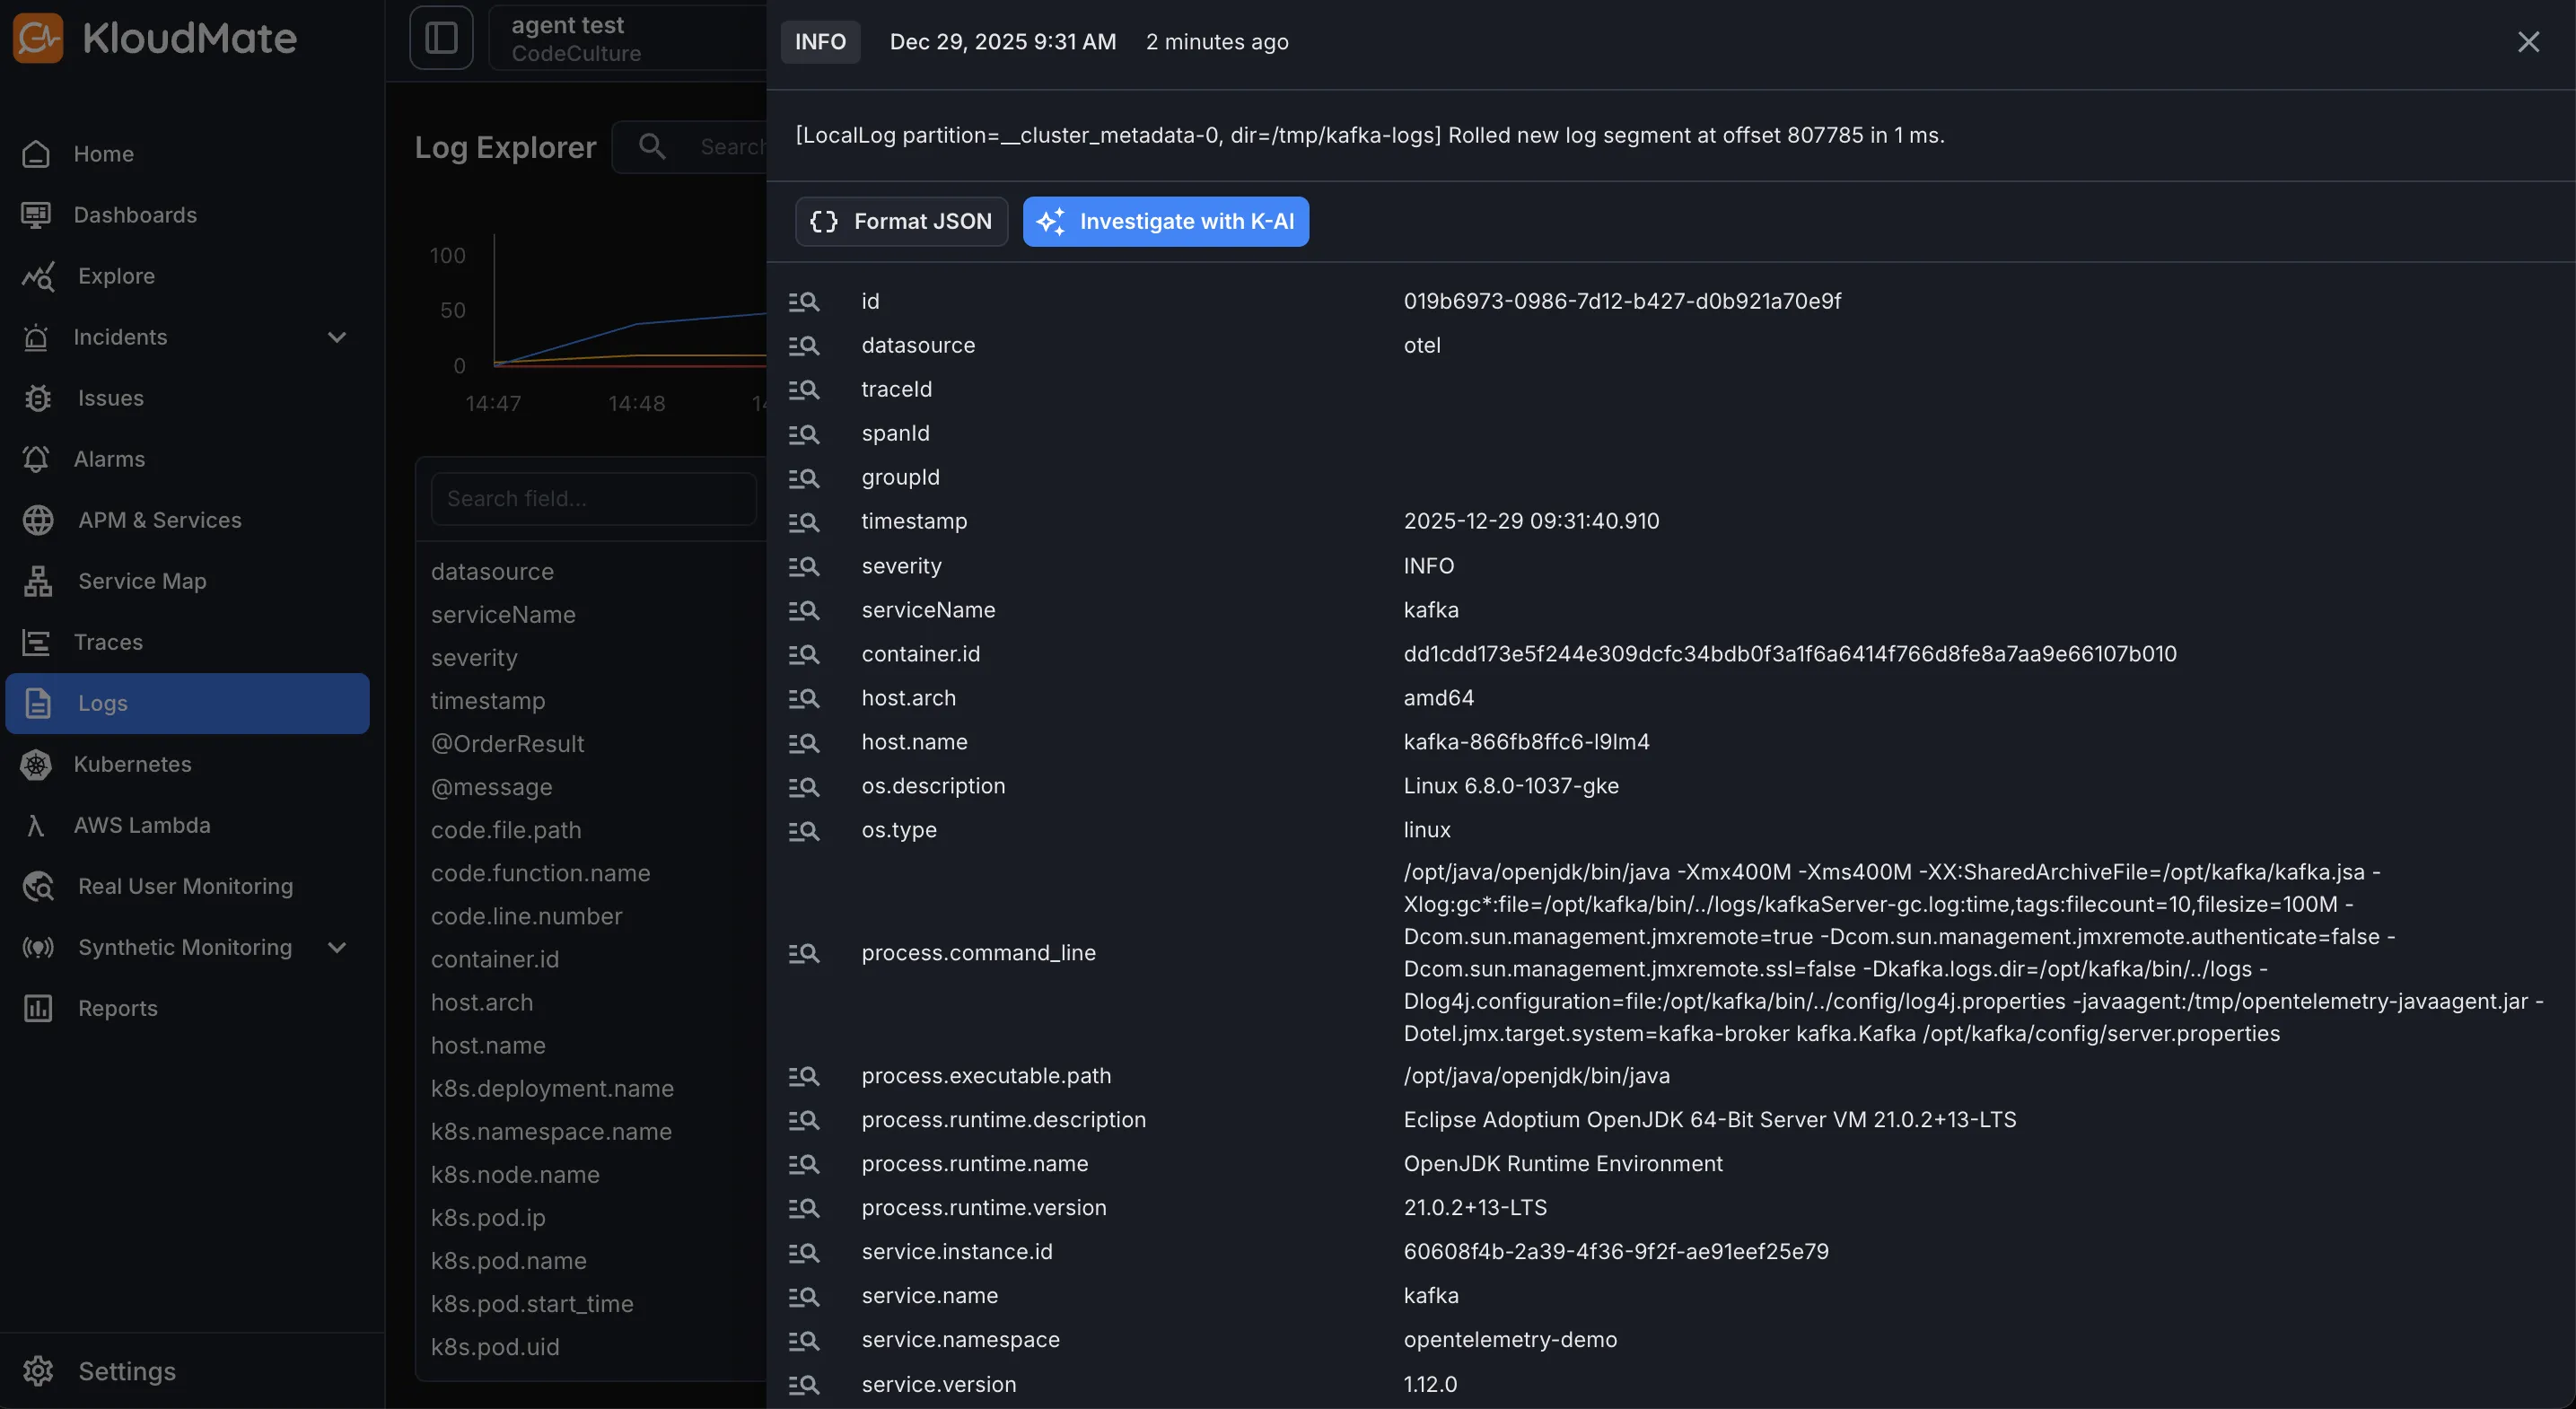
Select any log entry to inspect its full payload, labels, and metadata.
Search and Filter Logs
Section titled “Search and Filter Logs”Search
Section titled “Search”Use the search bar at the top of Log Explorer to find matching log entries across your environment.
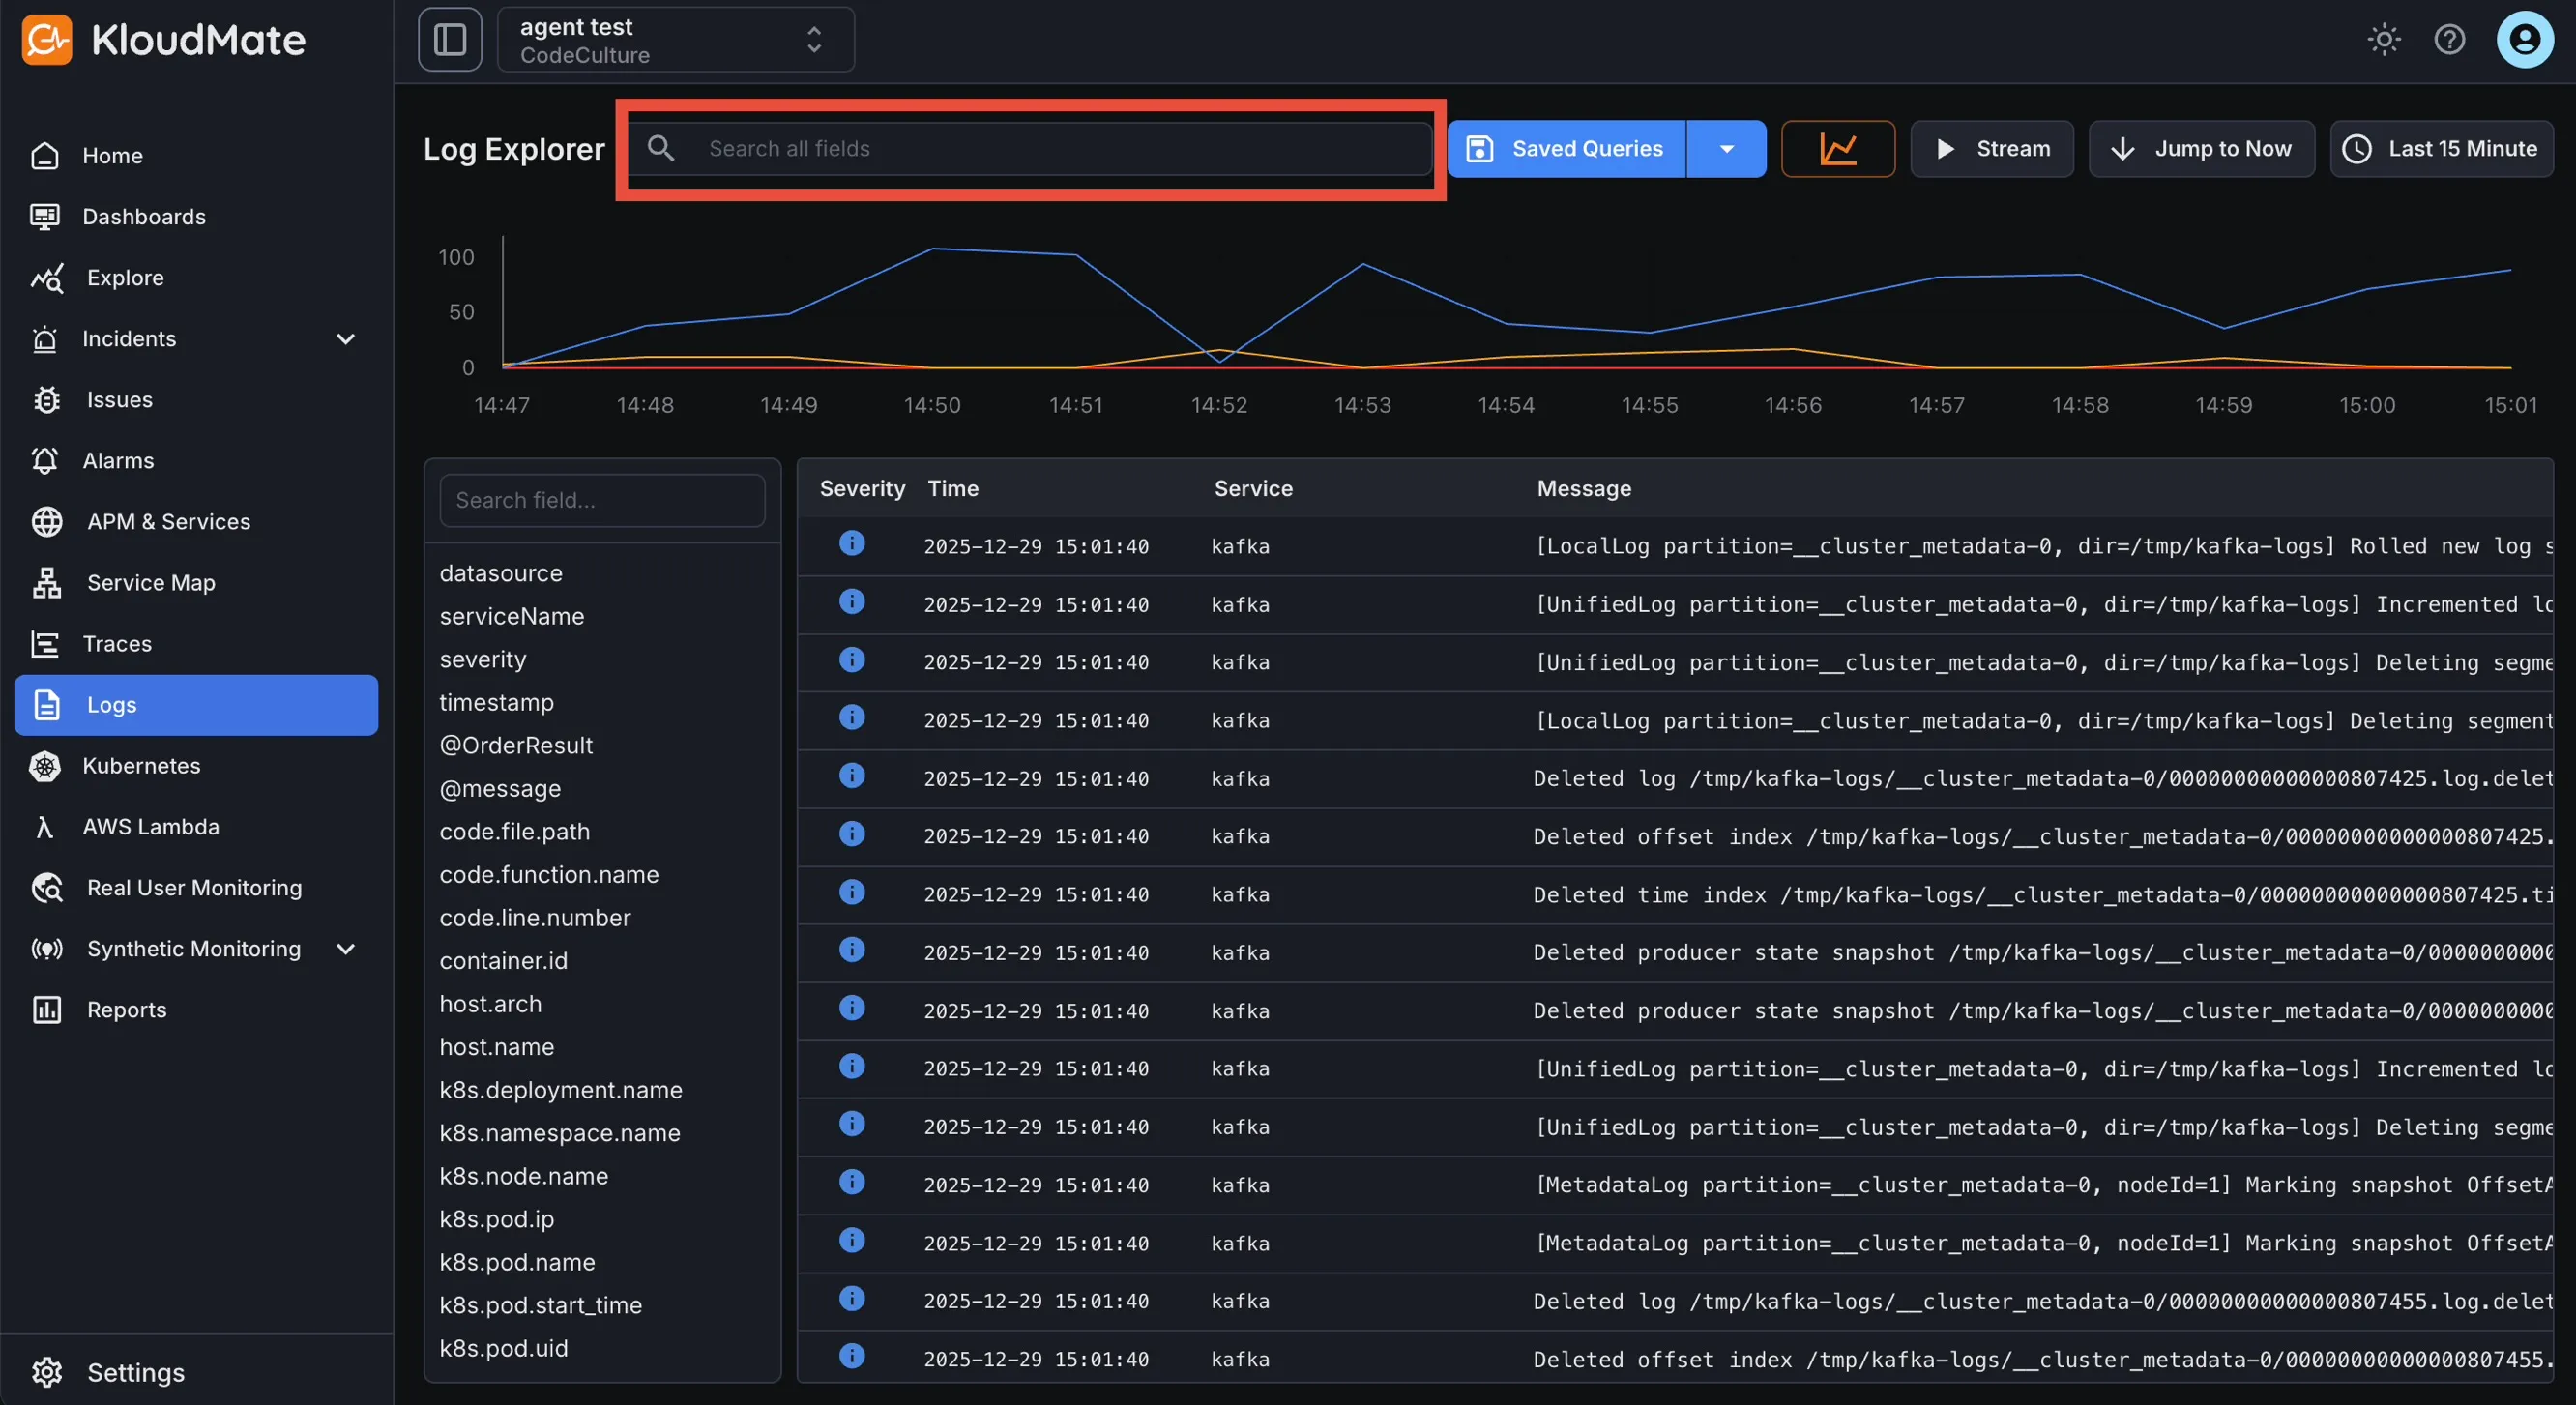
Refine results further by adjusting the selected time range from the time scale menu.
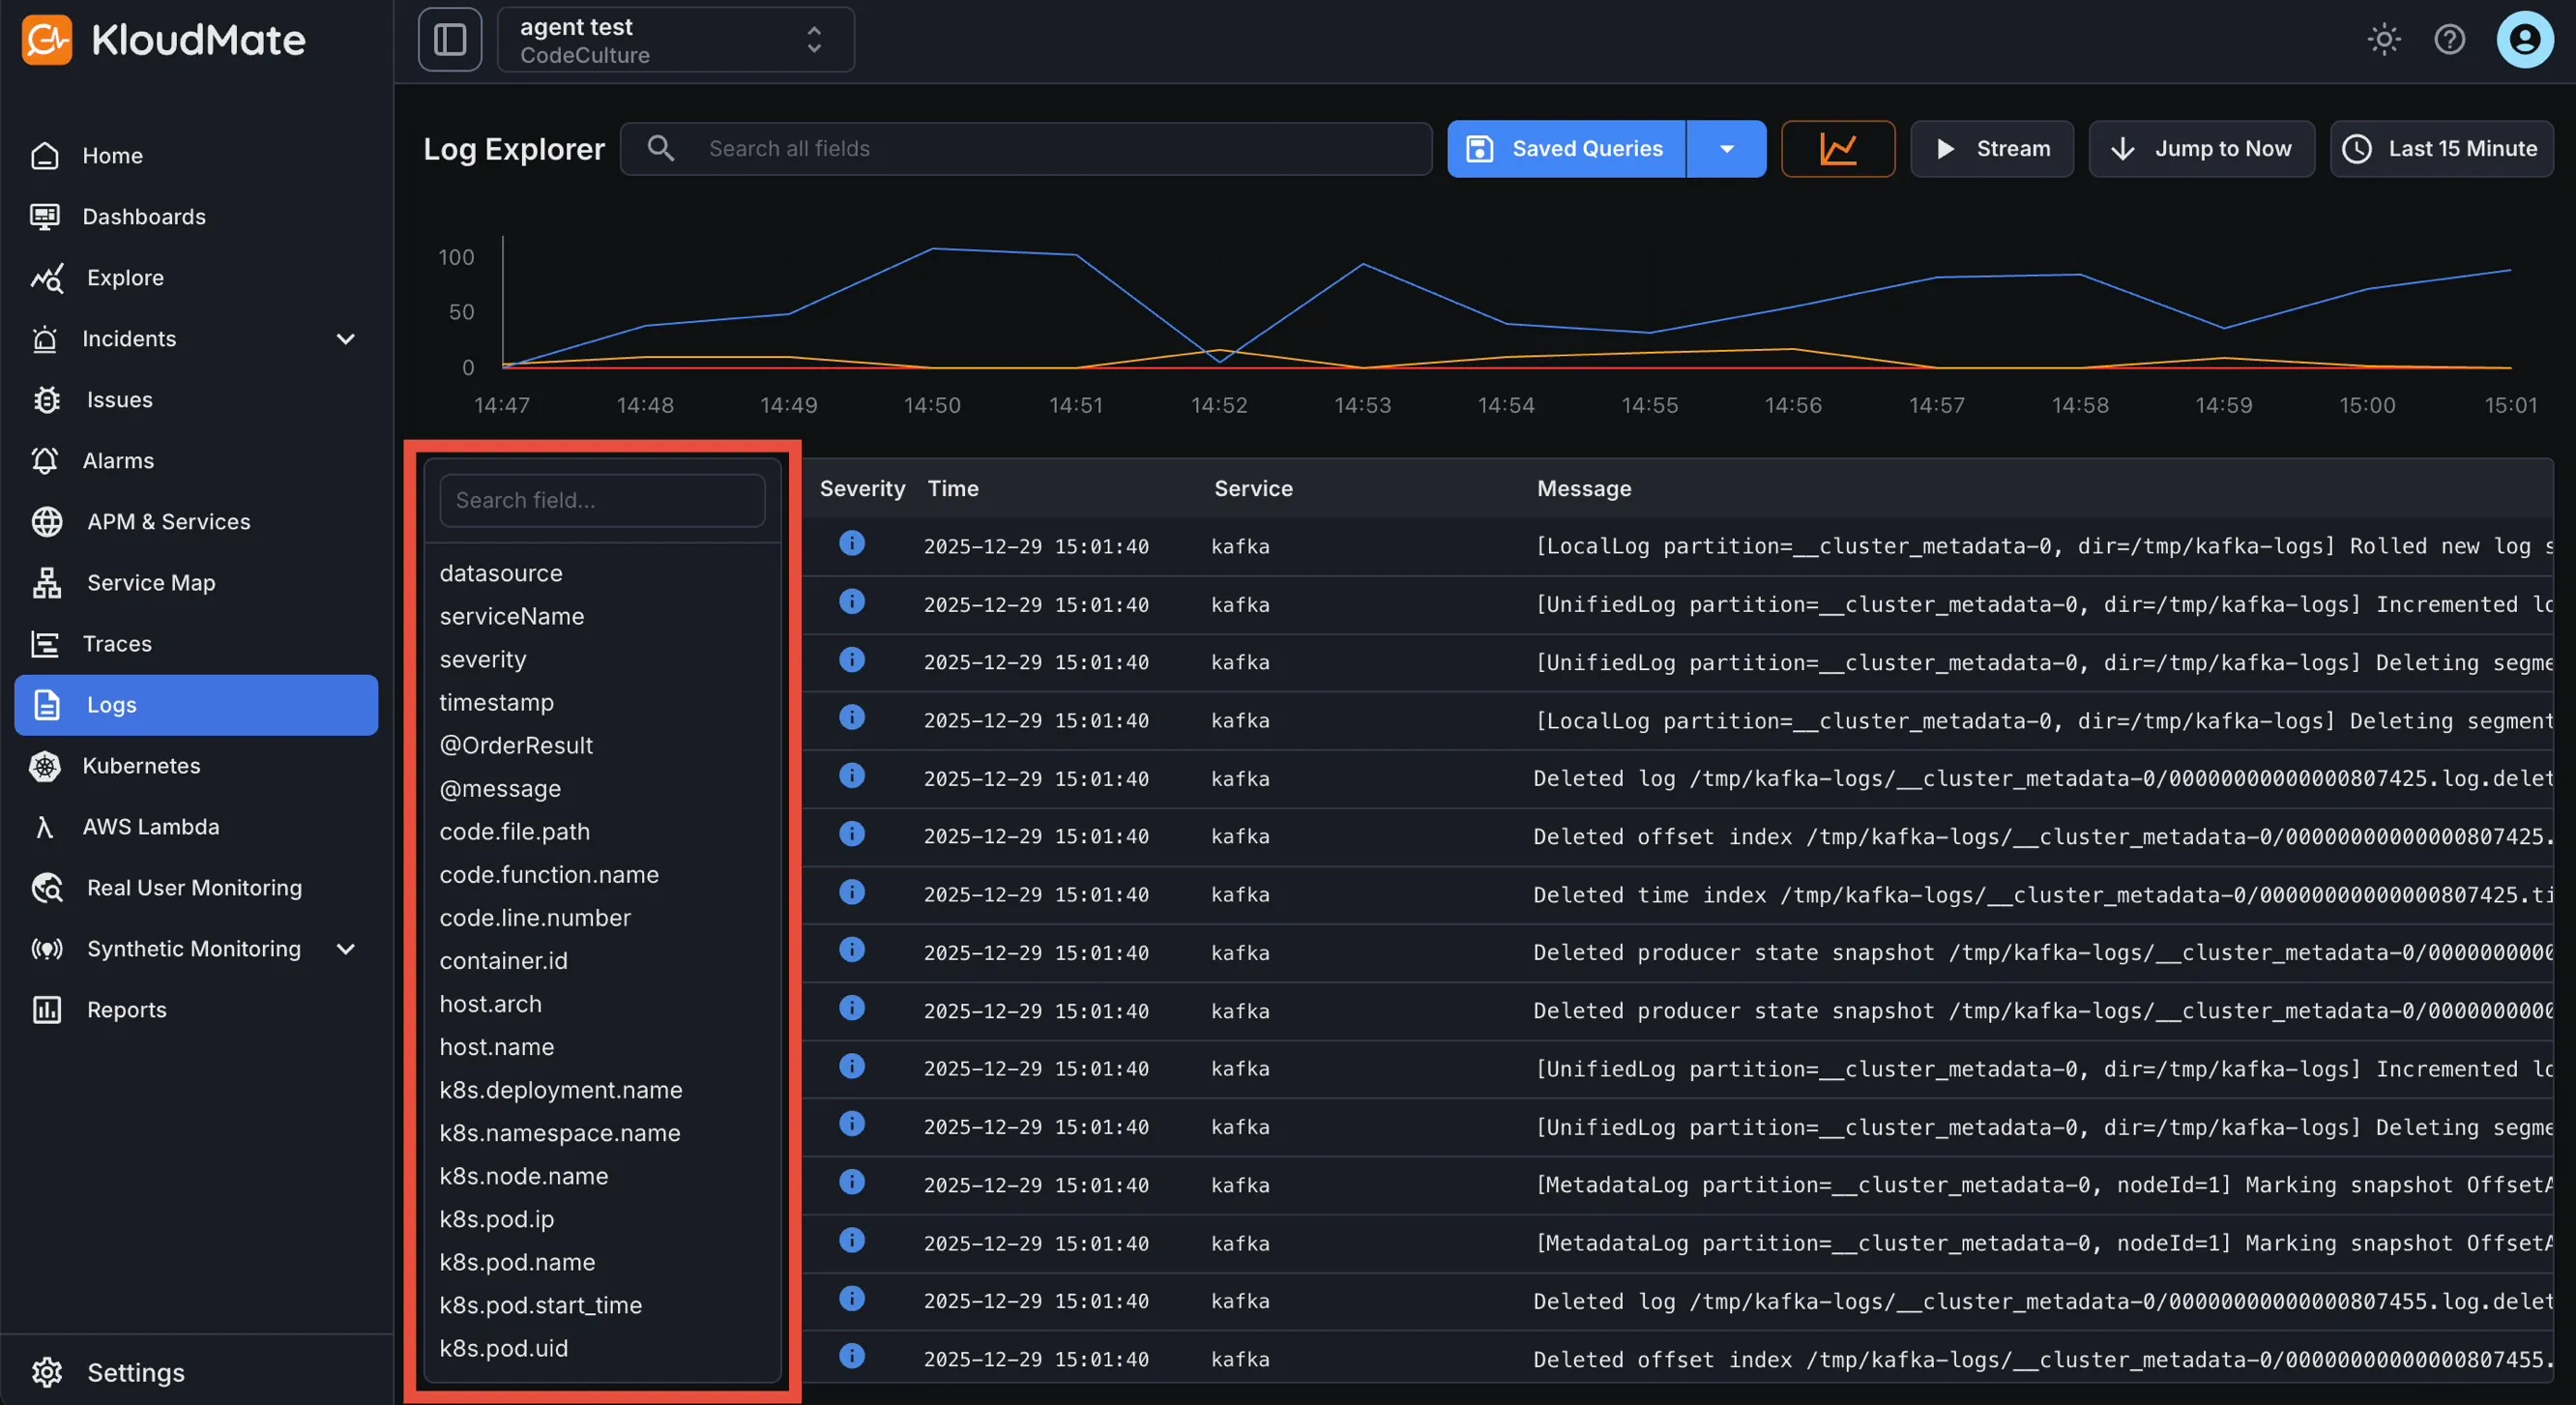
Filter
Section titled “Filter”Use the sidebar filters to narrow the result set by relevant dimensions. Multiple filters can be combined to isolate a very specific set of logs.
Saved Queries
Section titled “Saved Queries”To save a query, click the dropdown arrow next to Saved Queries in the top-right area of Log Explorer. Enter a query name, description, and folder, then click Save.
Saved queries remain available from the Saved Queries section for quick reuse.
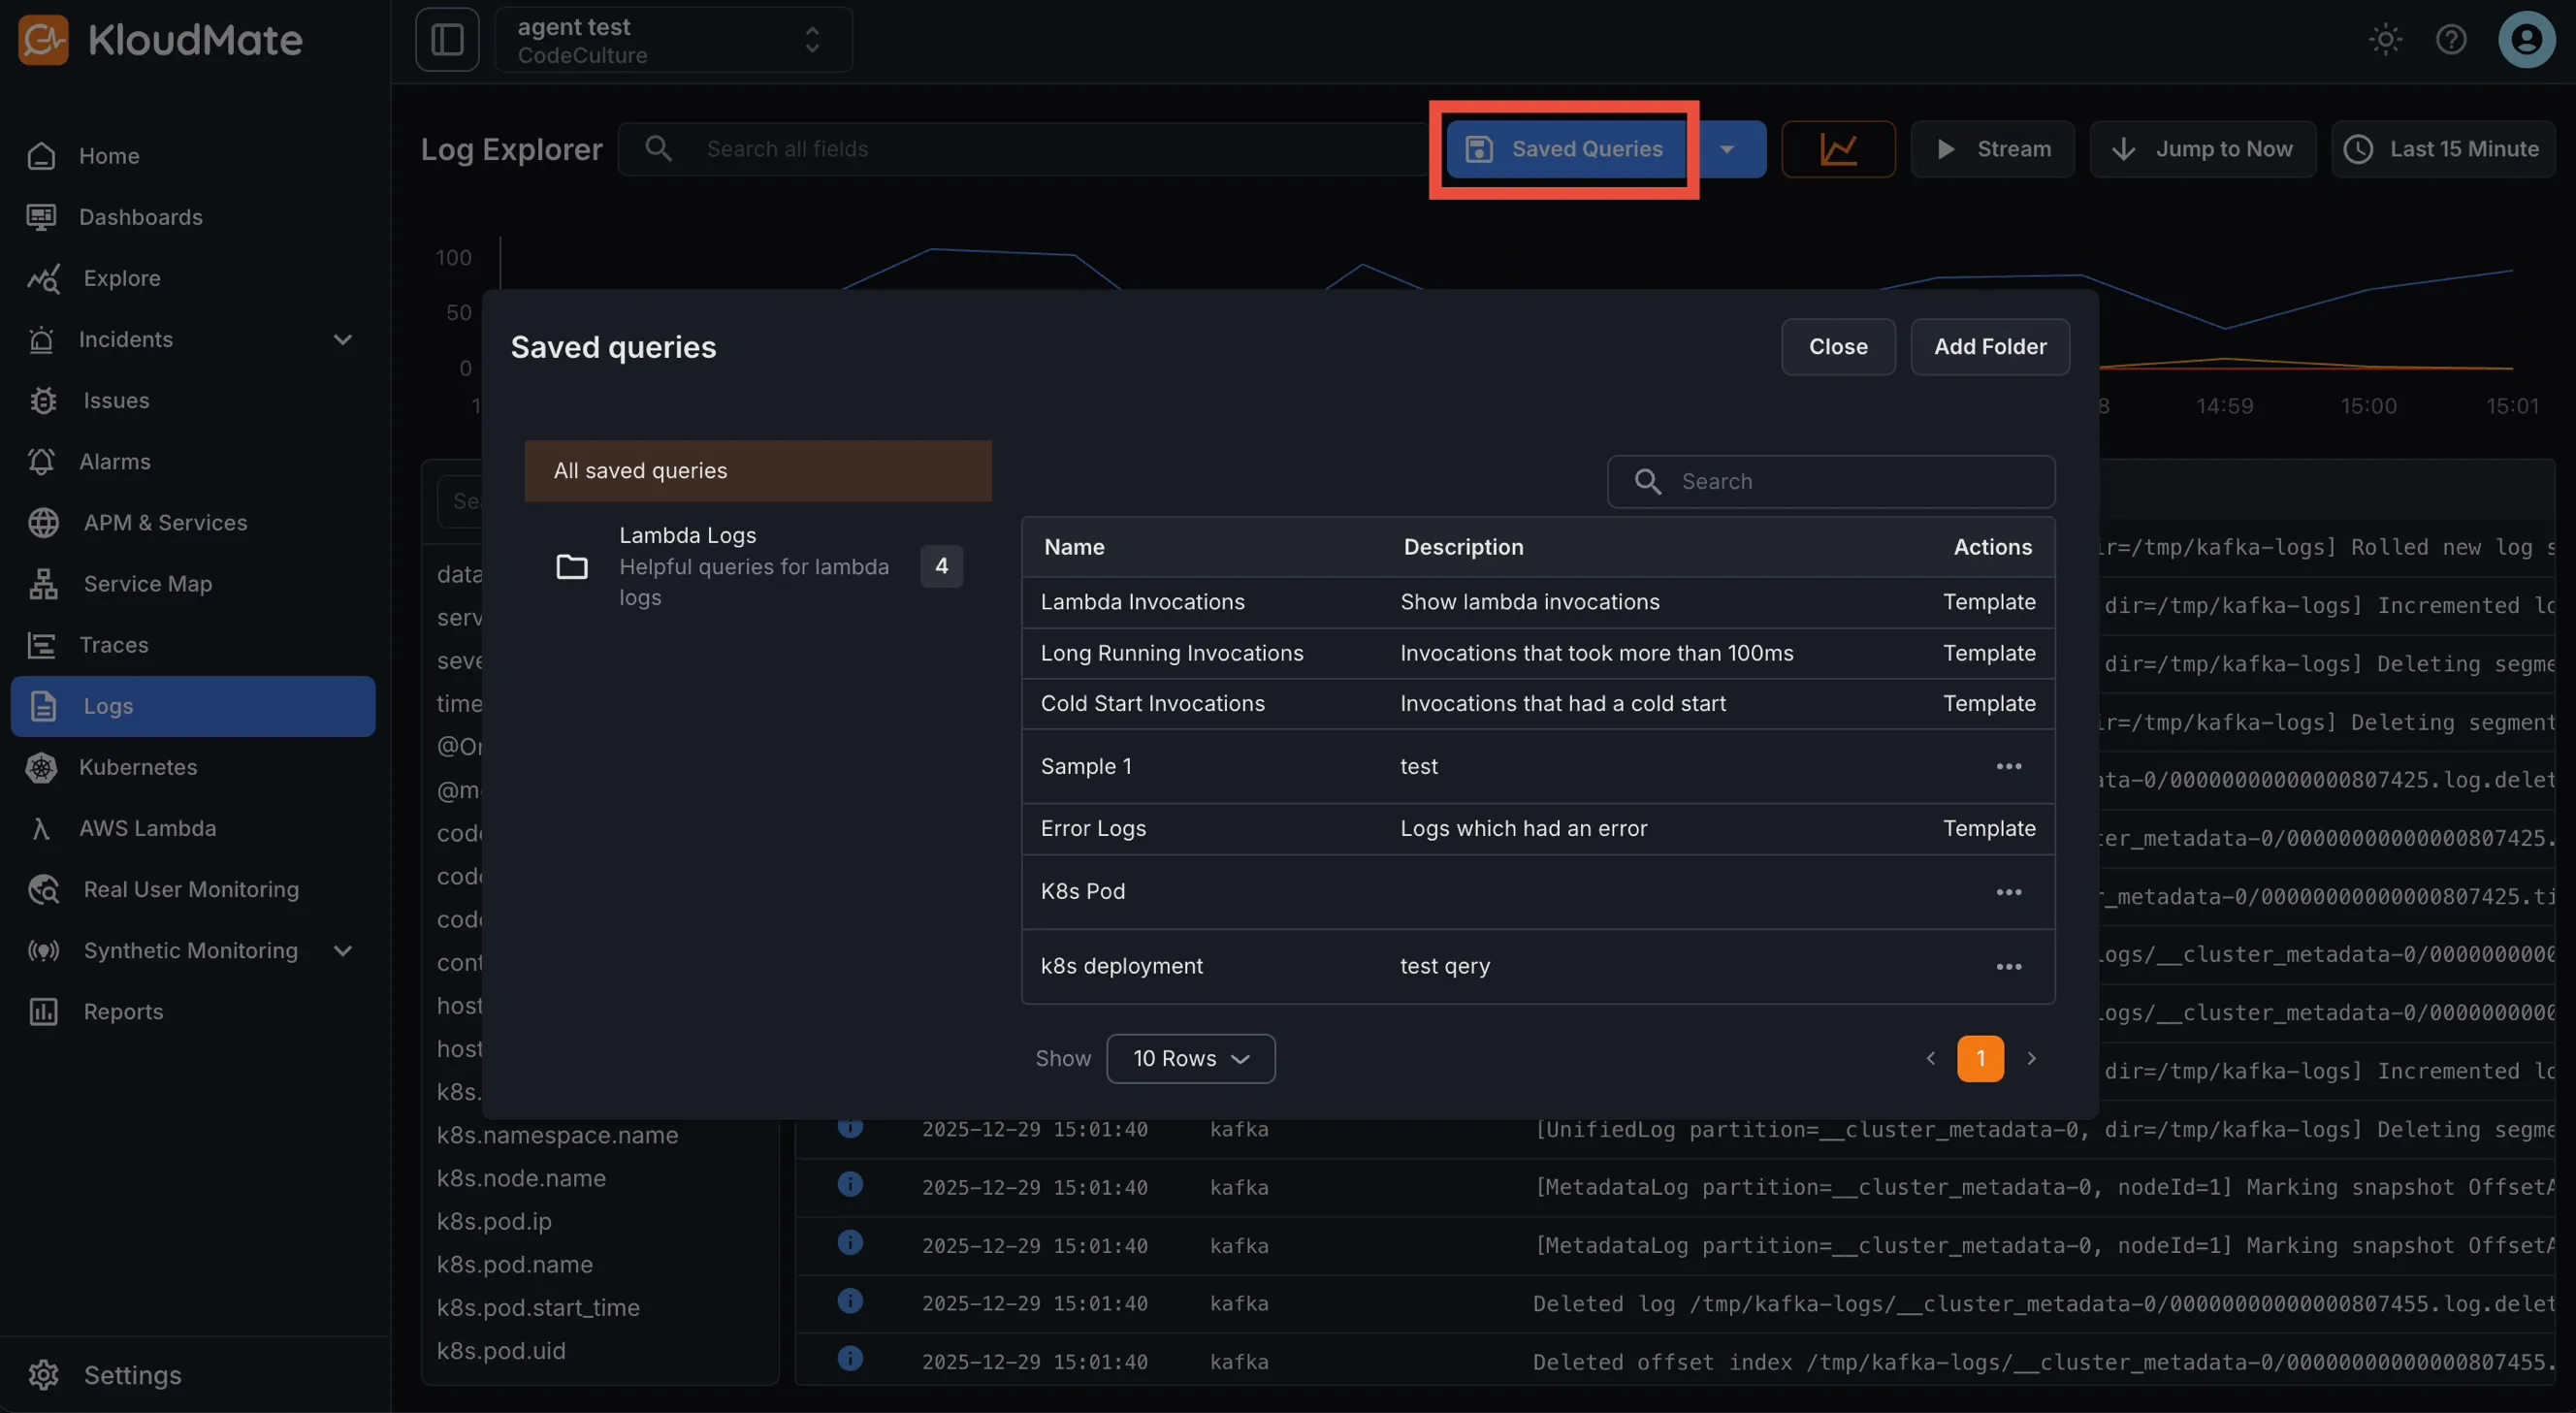
Use folders to keep saved queries organized by service, team, or use case.
Inspect Log Entries
Section titled “Inspect Log Entries”Select any log entry to view detailed information and analysis.

For error logs, use Investigate with KloudMate Assistant to generate a summary, identify the probable root cause, and suggest a next step.
Refer to the KloudMate Assistant documentation for more details.
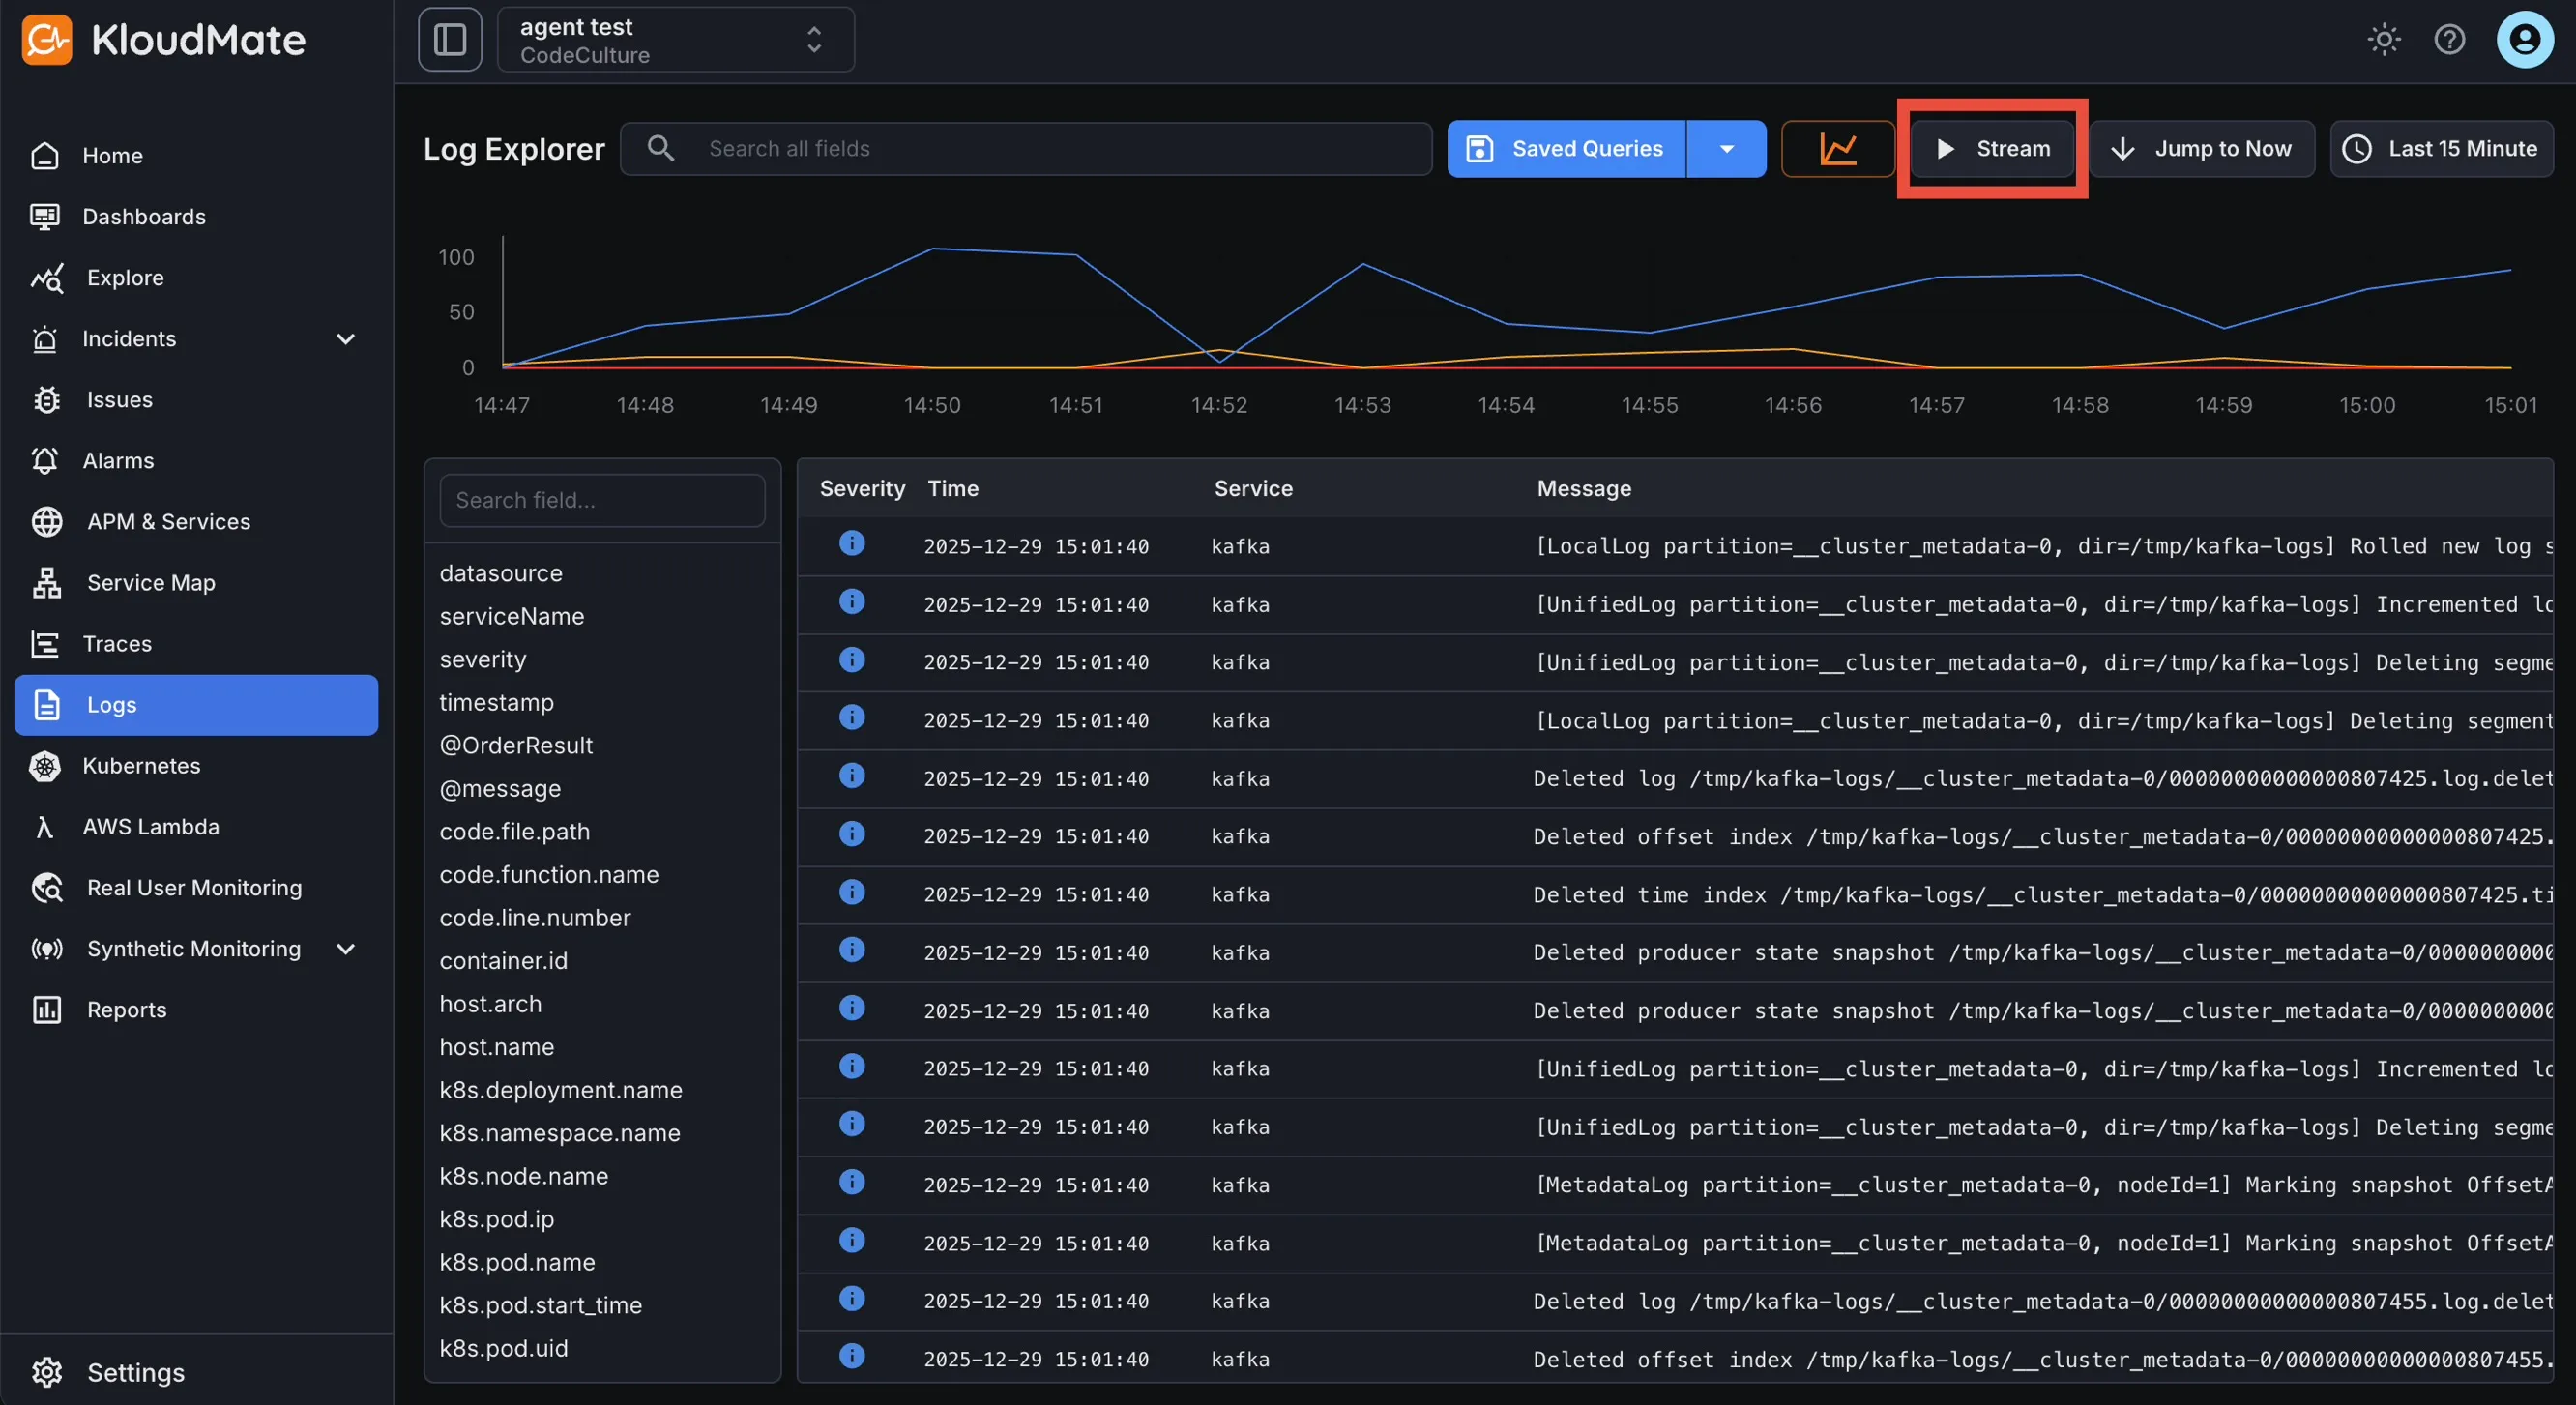
Stream Logs
Section titled “Stream Logs”Use Stream to watch logs as they are ingested into KloudMate.