MongoDB
MongoDB is a widely used NoSQL database designed for scalability and flexibility. It stores data in a JSON-like format (BSON), enabling dynamic schema design and efficient handling of unstructured data. MongoDB is known for its high performance in read- and write-heavy environments and is commonly used for real-time analytics, content management, and IoT systems. It supports horizontal scaling through sharding and provides built-in replication for high availability.
MongoDB Monitoring in KloudMate helps you observe the health, performance, and behavior of your MongoDB servers by collecting metrics and logs using the KloudMate Agent powered by OpenTelemetry. This allows you to monitor MongoDB instances running on AWS EC2, Azure Virtual Machines, or on-premise servers from a centralized view.
What This Integration Provides
Section titled “What This Integration Provides”With MongoDB Monitoring enabled, KloudMate collects telemetry at multiple levels, including:
- Server-level performance metrics
- Database and collection-level metrics
- Connection, operation, and lock behavior
- Network and storage usage
- MongoDB server logs
This visibility helps identify performance bottlenecks, abnormal query behavior, resource saturation, and availability issues.
Pre-requisites
Section titled “Pre-requisites”Before configuring MongoDB Monitoring, ensure the following:
- MongoDB server is running
- Supported MongoDB versions: 4.0+, 5.0, 6.0, 7.0
- KloudMate Agent installed on the MongoDB host
- MongoDB user configured with least-privilege access.
MongoDB recommends creating a user with the clusterMonitor role to collect metrics. Refer to lpu.sh for an example of how to configure these permissions.
Example:
Step 1: Access Agents and OpenTelemetry Collector Configuration
Section titled “Step 1: Access Agents and OpenTelemetry Collector Configuration”- Log in to the KloudMate platform
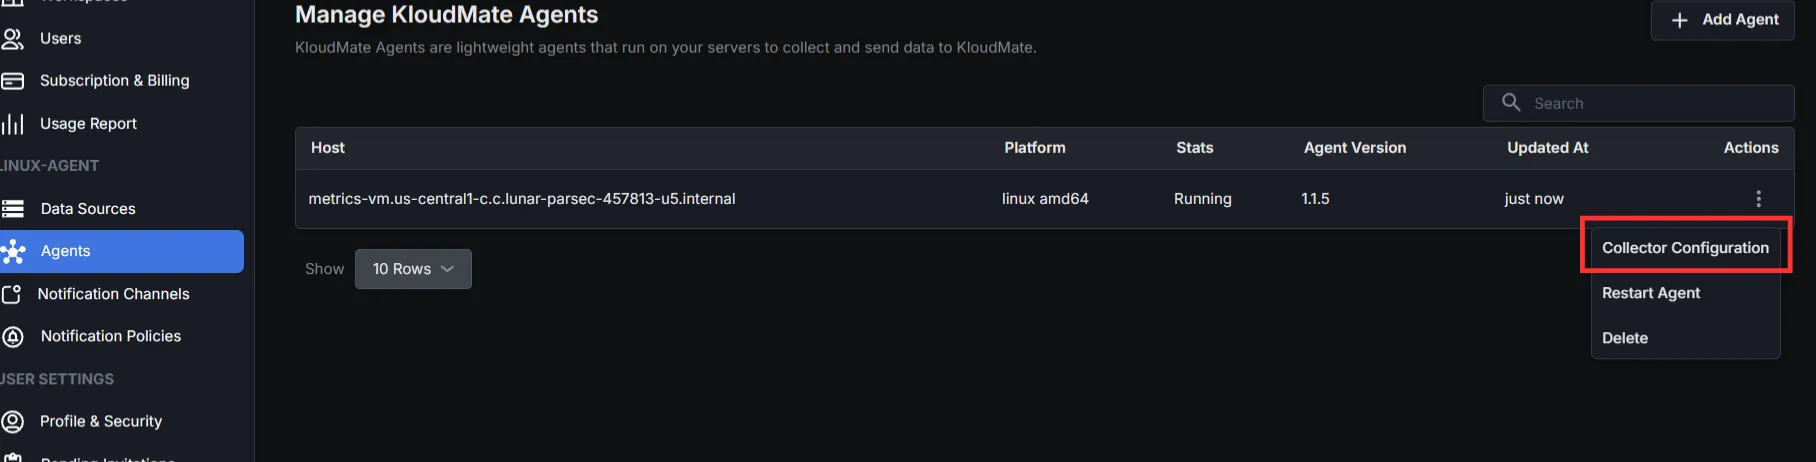
- Navigate to Settings → Agents
- Select the agent running on the MongoDB host
- Open Collector Configuration from the agent actions
- The configuration editor opens, allowing you to modify the YAML directly
Step 2: Add Required Extensions and Receivers
Section titled “Step 2: Add Required Extensions and Receivers”Extensions
Add the following extensions to support health checks, debugging, and local storage:
Receivers
Two receivers can be used with MongoDB:
- MongoDB Receiver – Collects MongoDB metrics
- File Log Receiver – Collects MongoDB logs
If you only need metrics, configure only the MongoDB receiver.
Step 3: Configure Processors
Section titled “Step 3: Configure Processors”Set up the processor component to identify resource information from the host and either append or replace the resource values in the telemetry data with this information.
Choose one configuration based on where MongoDB is running.
- Server (On-premise / Non-cloud / Cloud)
- AWS EC2:
(Optional) To collect EC2 tags, attach an IAM role with EC2:DescribeTags permission.
- Azure Virtual Machines:
Step 4: Configure Exporter and Pipelines
Section titled “Step 4: Configure Exporter and Pipelines”Configure the KloudMate backend exporter and define pipelines for metrics and logs.
Step 5: Save Configuration and Restart Agent
Section titled “Step 5: Save Configuration and Restart Agent”After updating the configuration, click Save Configuration in the KloudMate UI.

You can also restart the agent from your server’s console.
For Linux:
- Execute the following commands:
These commands restart the KloudMate Agent and display its current status.
For Windows
- Open the Services window
- Press
Win + R, typeservices.msc, and pressOK - Or search for Services from the Start menu
- Press
- Locate the KloudMate Agent service.
- Right-click the service and select Restart.
After restarting the agent, verify that MongoDB metrics and logs are visible in the KloudMate dashboard.
Post‑Integration Data Validation
Section titled “Post‑Integration Data Validation”Verify that metrics are flowing into KloudMate using the Explore view.
After the agent restarts:
- Log in to KloudMate
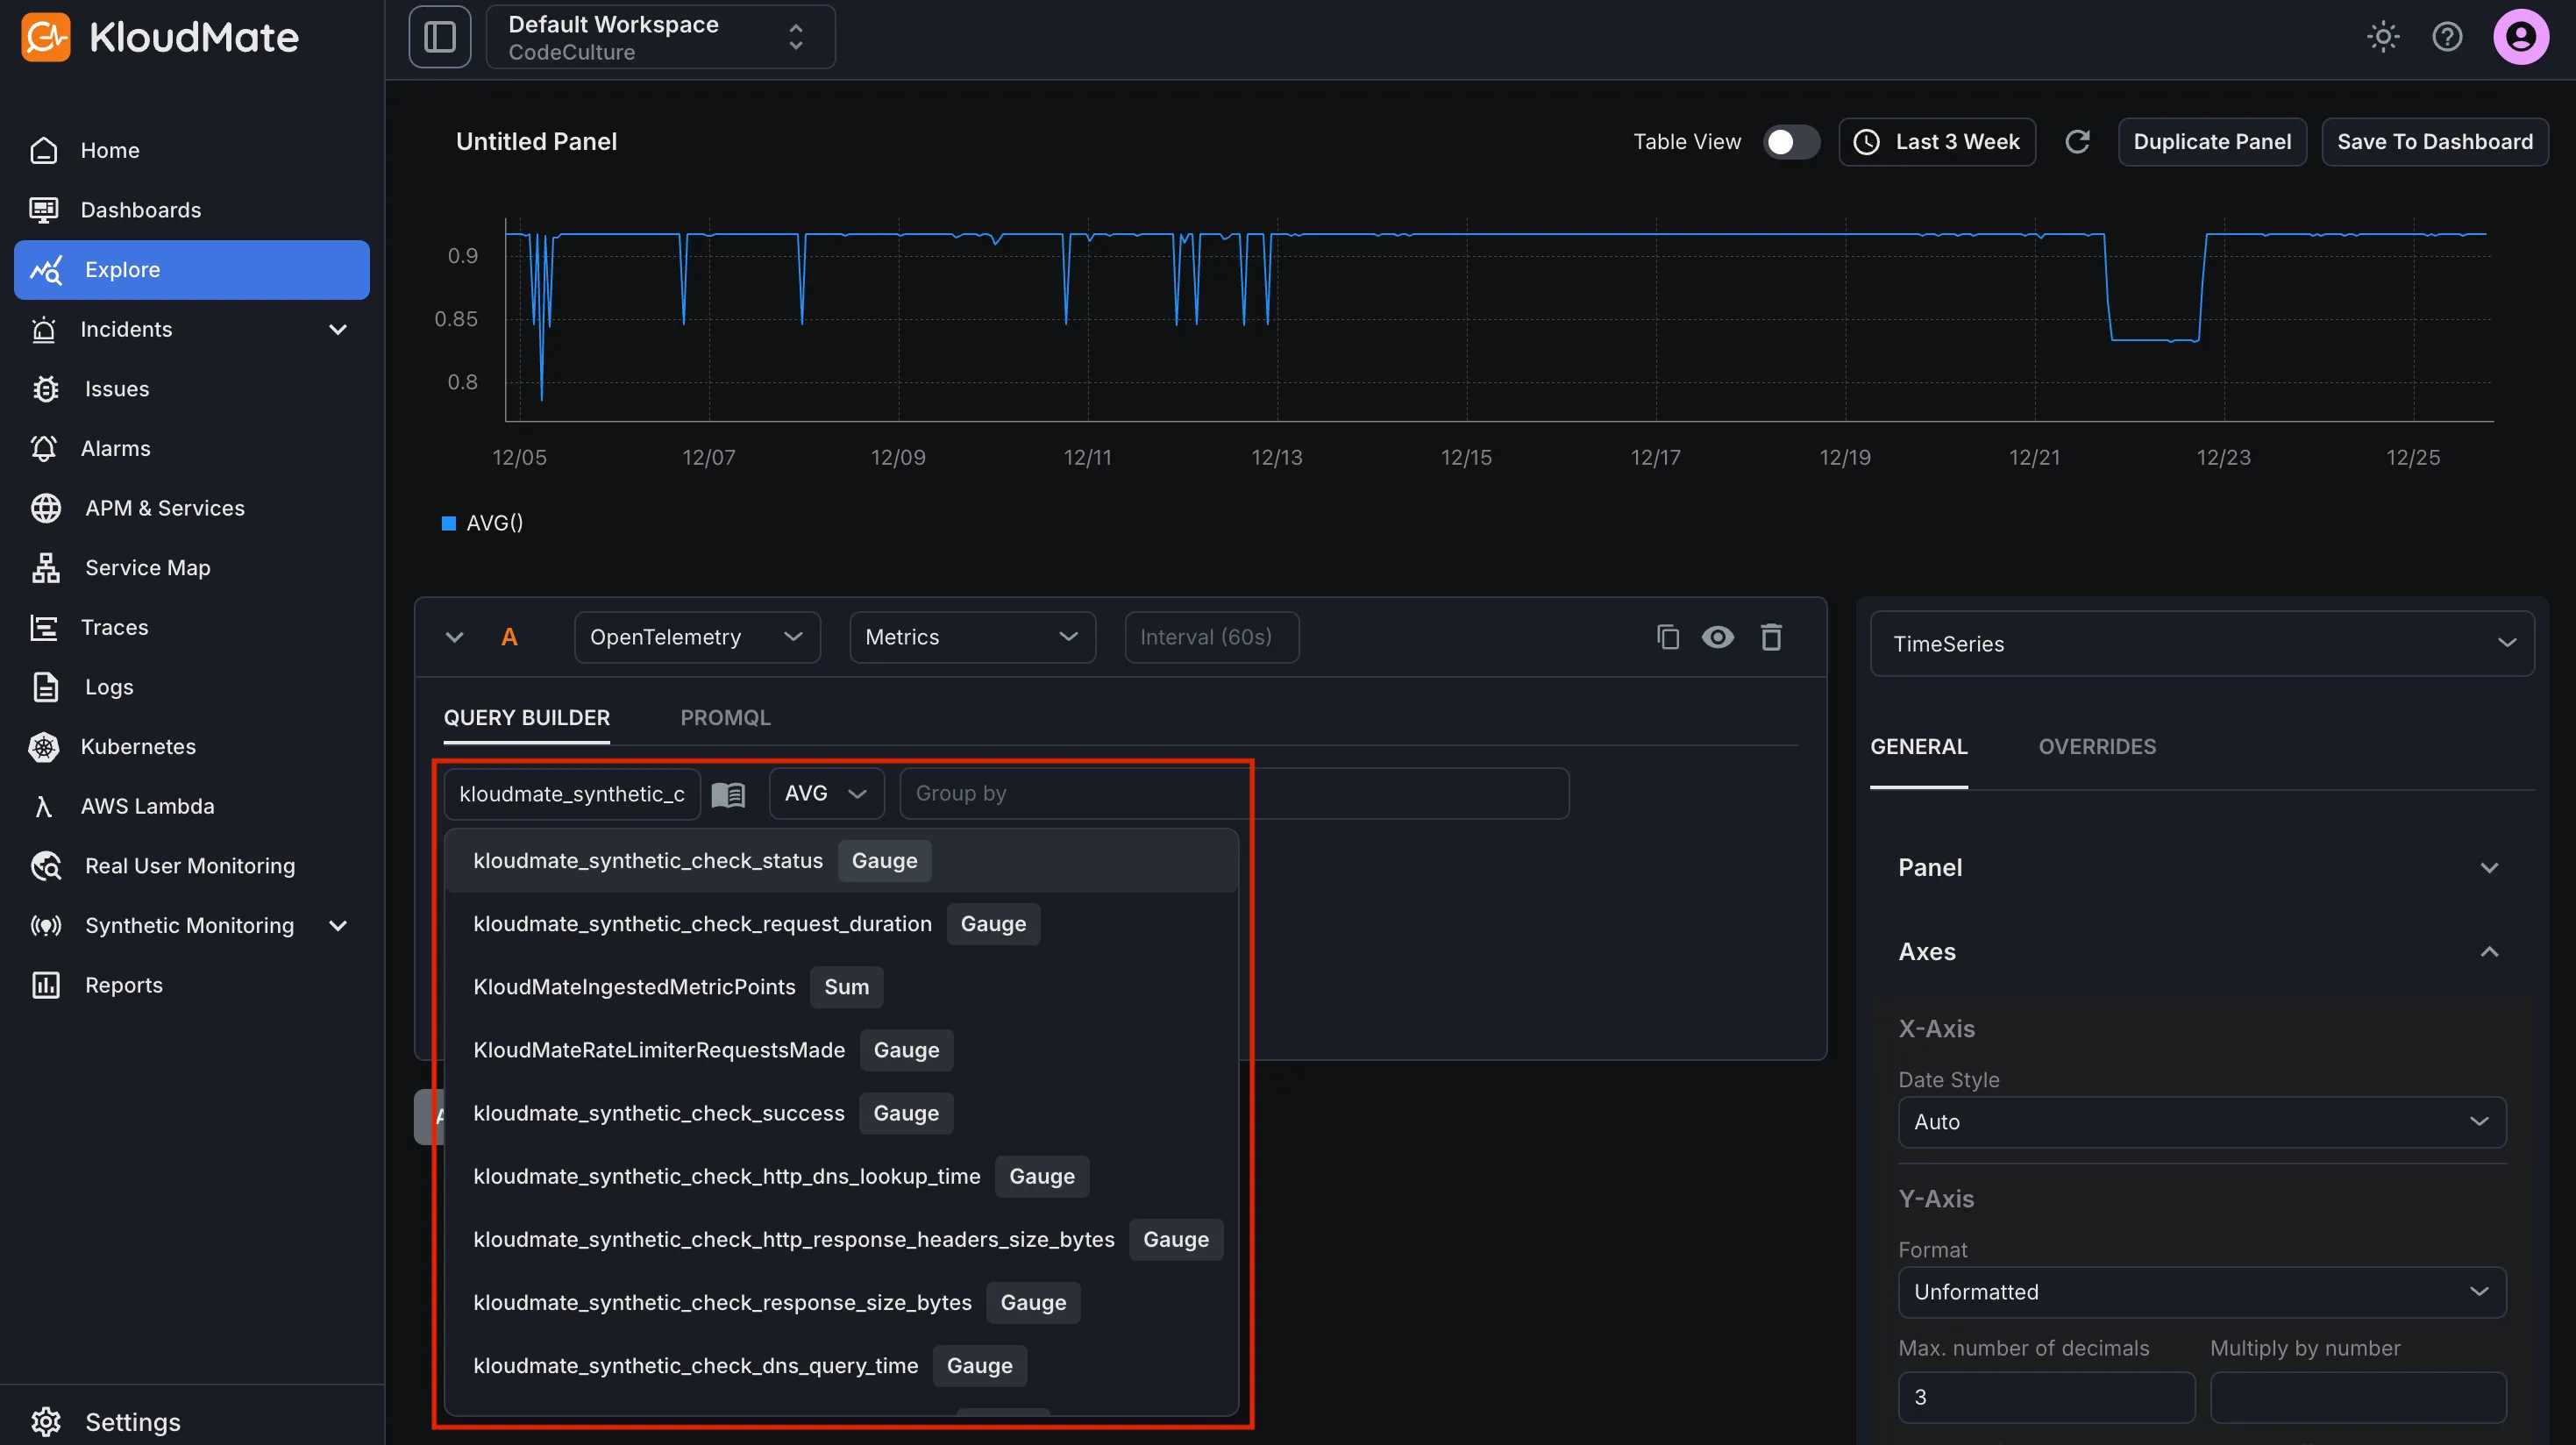
- Navigate to Explore
- Select OpenTelemetry → Metrics
- Choose a MongoDB metric and run the query
Seeing time-series data confirms that MongoDB telemetry is flowing successfully.
Standard MongoDB Dashboards
Section titled “Standard MongoDB Dashboards”KloudMate provides prebuilt MongoDB dashboards through dashboard templates. These dashboards visualize MongoDB server performance, operations, storage, and resource usage.
To import and start using these templates, follow the steps described in Import from Templates.
Default MongoDB Metrics
Section titled “Default MongoDB Metrics”MongoDB Monitoring automatically collects commonly used MongoDB metrics when enabled.
Example Metrics
| Metric Name | Description |
|---|---|
| mongodb_connection_count | The number of connections. |
| mongodb_operation_count | The number of operations executed. |
| mongodb_operation_latency_time | The latency of operations. |
| mongodb_data_size | The size of the collection. Data compression does not affect this value. |
| mongodb_storage_size | The total amount of storage allocated to this collection. |
| mongodb_network_io_receive | The number of bytes received. |
| mongodb_network_io_transmit | The number of bytes transmitted. |
| mongodb_lock_acquire_count | Number of times the lock was acquired in the specified mode. |
| mongodb_lock_acquire_time | Cumulative wait time for the lock acquisitions. |
| mongodb_health | The health status of the server. |
| mongodb_uptime | The amount of time that the server has been running. |
For the complete metrics list, refer to the metrics reference.
Optional Deployment Methods
Section titled “Optional Deployment Methods”VM/EC2 with Fluent Bit
Section titled “VM/EC2 with Fluent Bit”Streaming MongoDB Metrics & Logs to KloudMate Using Fluent Bit