Configuration & Management
The KloudMate Agent is designed to be managed centrally from the KloudMate web UI. This means you don’t need to SSH into your servers or manually edit local YAML files to update settings—changes made in the dashboard are automatically pushed to your agents across your infrastructure.
Agents Overview
Section titled “Agents Overview”The KloudMate agent’s landing page allows you to view, add, and manage your agents. Once an agent is integrated, you can view its details:
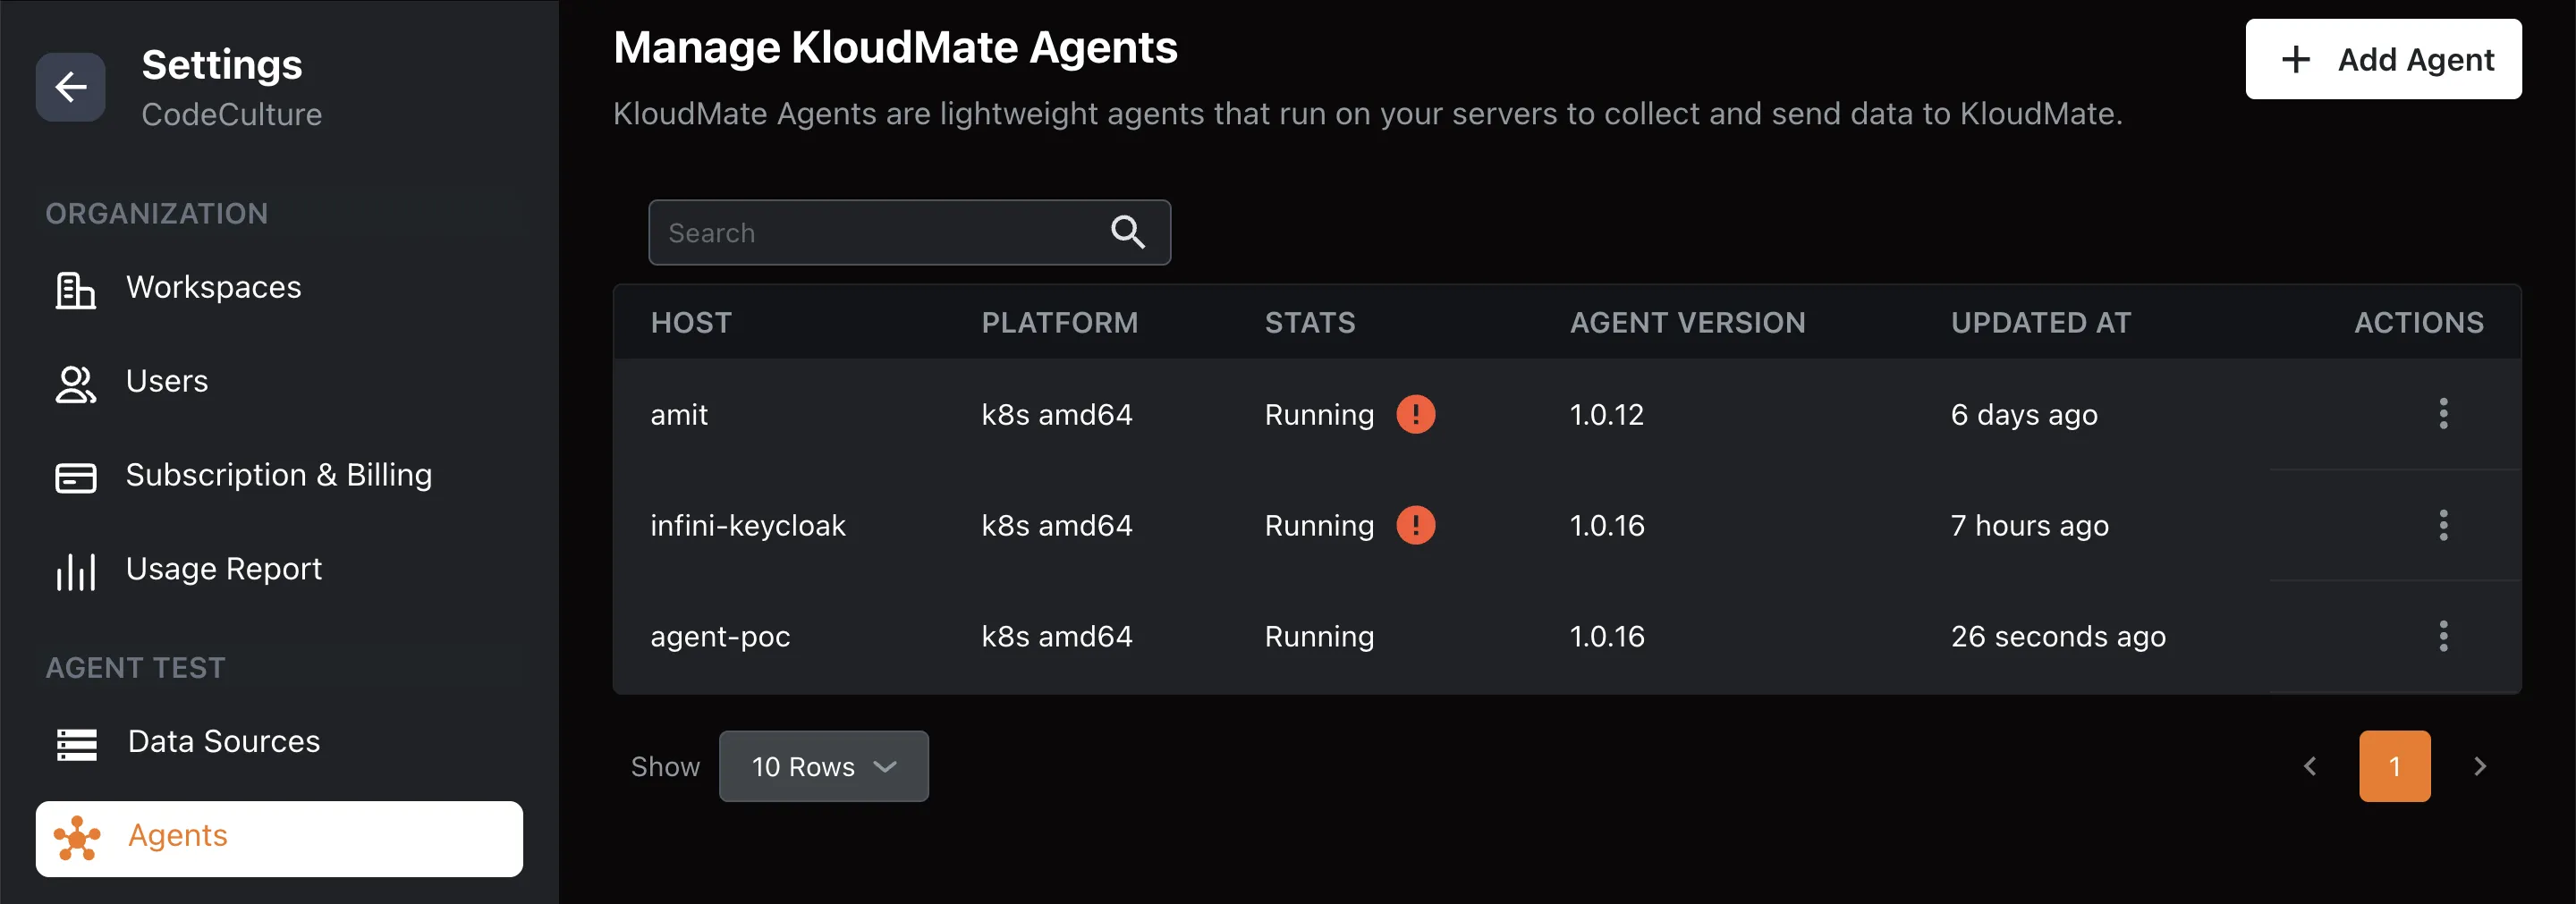
- Hostname: The agent’s host machine name.
- Platform: The operating system or environment of the agent.
- Status: Current running status of the agent.
- Agent Version: Version of the KloudMate agent used during integration.
- Updated At: The last time the collector configuration was updated.
Adding a New Agent
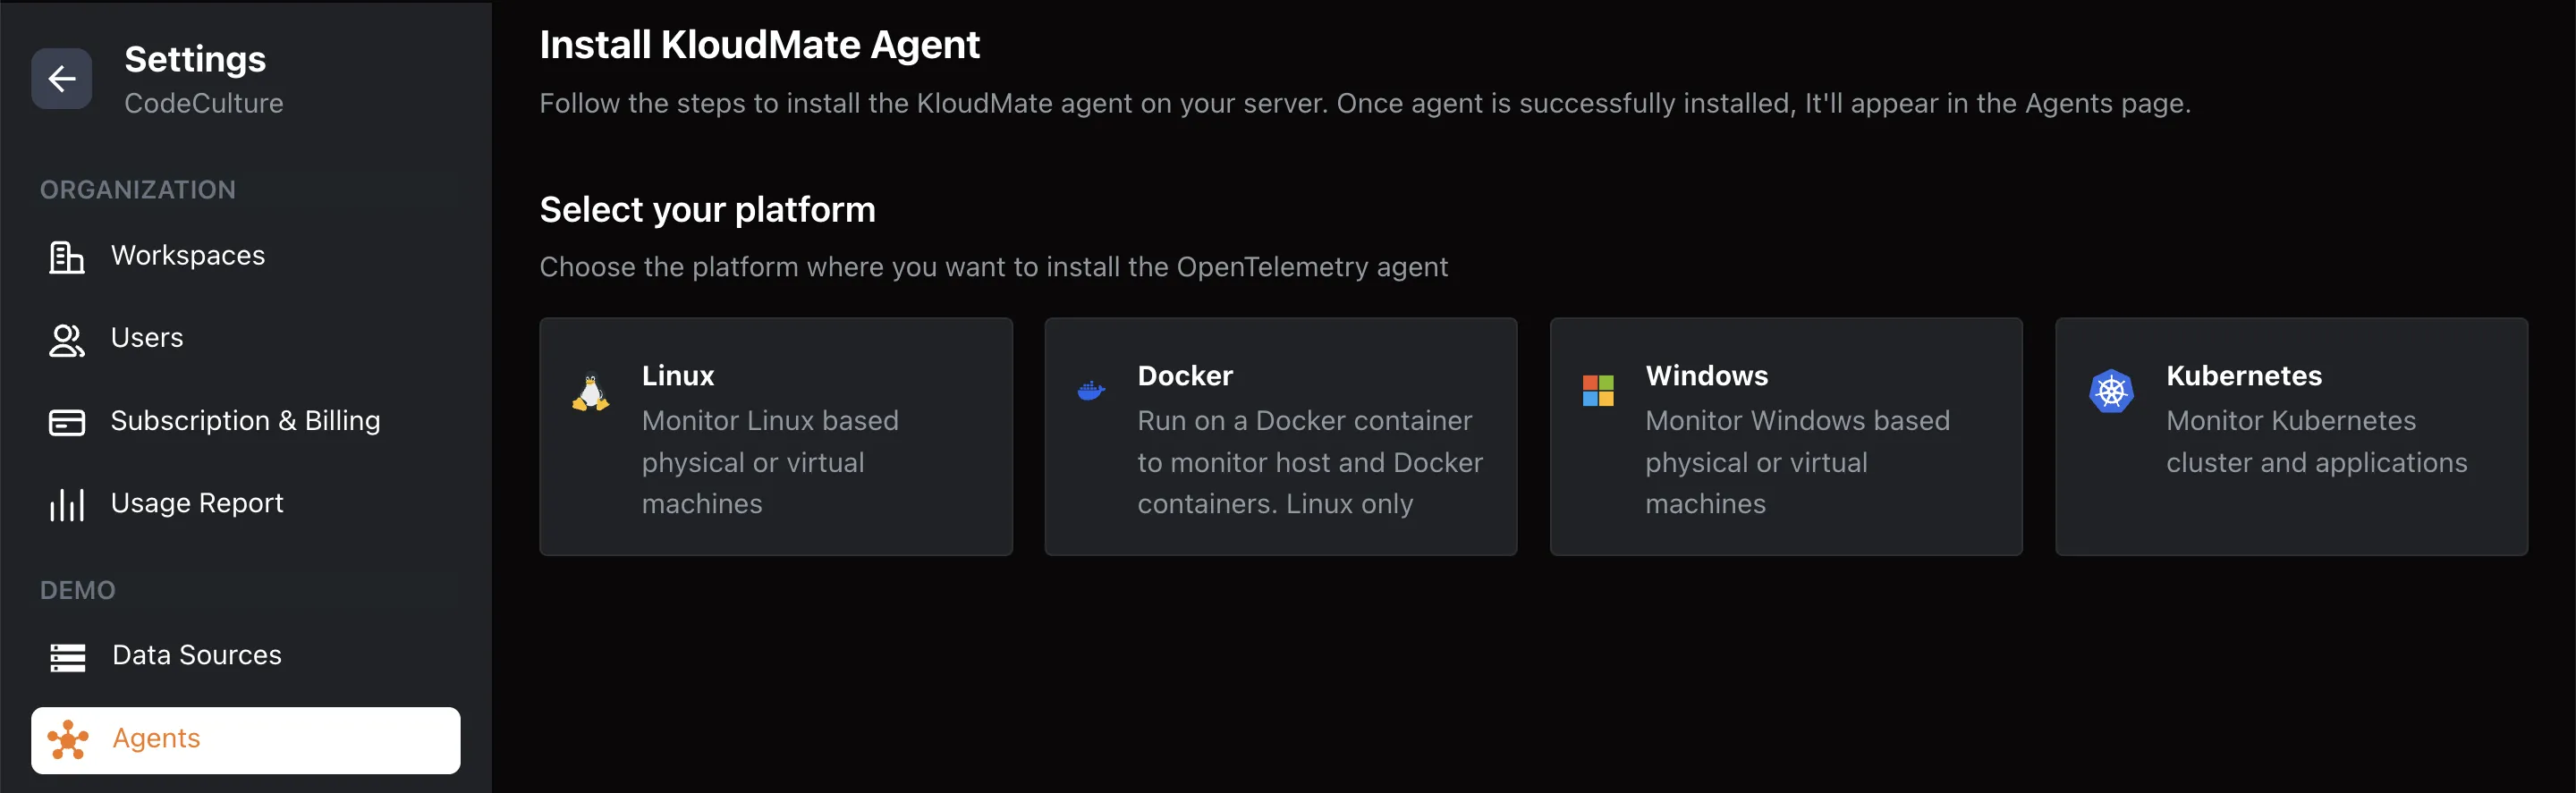
Section titled “Adding a New Agent”- Click the Add Agent button located at the top right corner of the page.
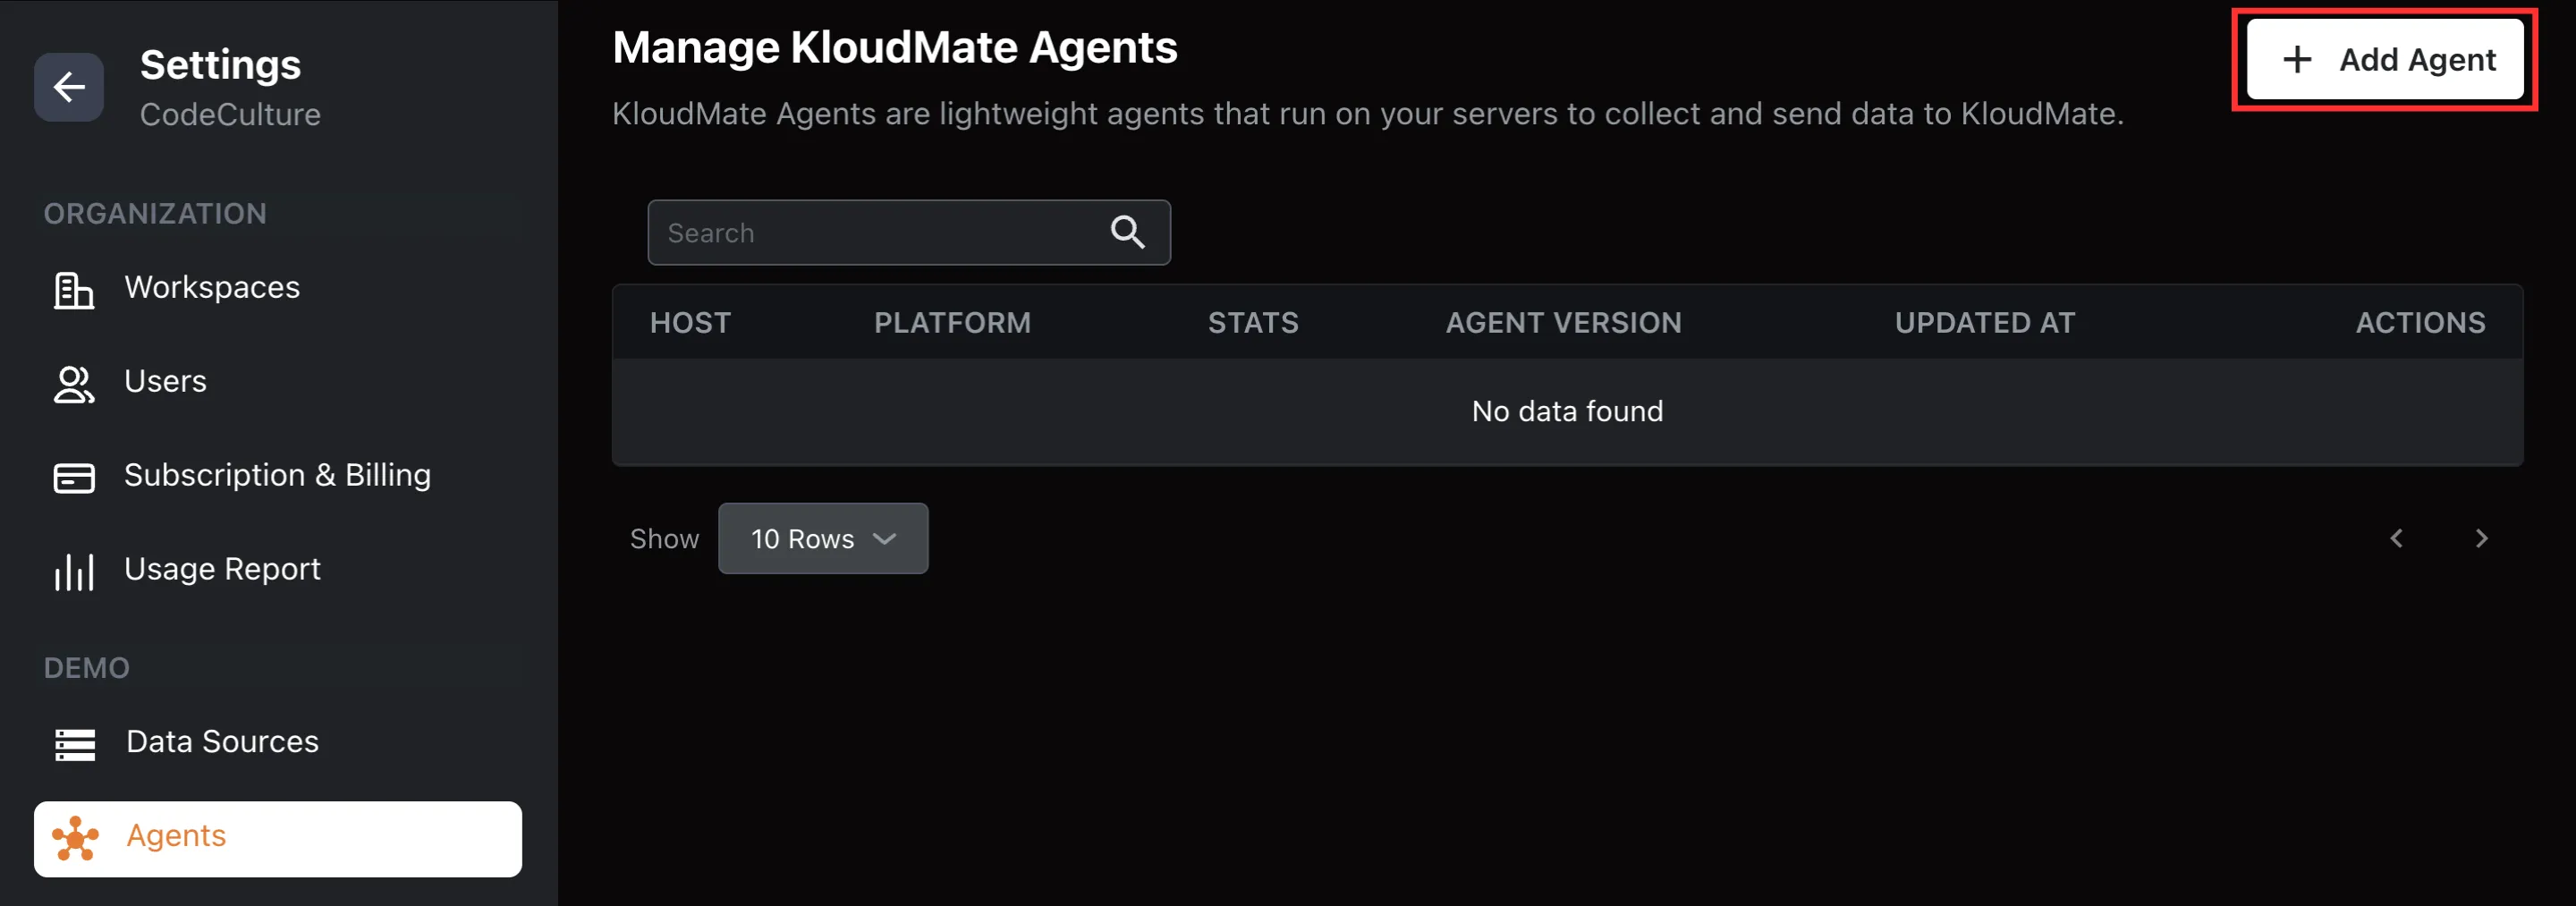
- Select an agent from the available integrations list.
Remote Configuration Editor
Section titled “Remote Configuration Editor”The agent watches for remote configuration changes via a secure connection and updates itself automatically.
From the KloudMate platform, you can update the collector configuration associated with any agent:
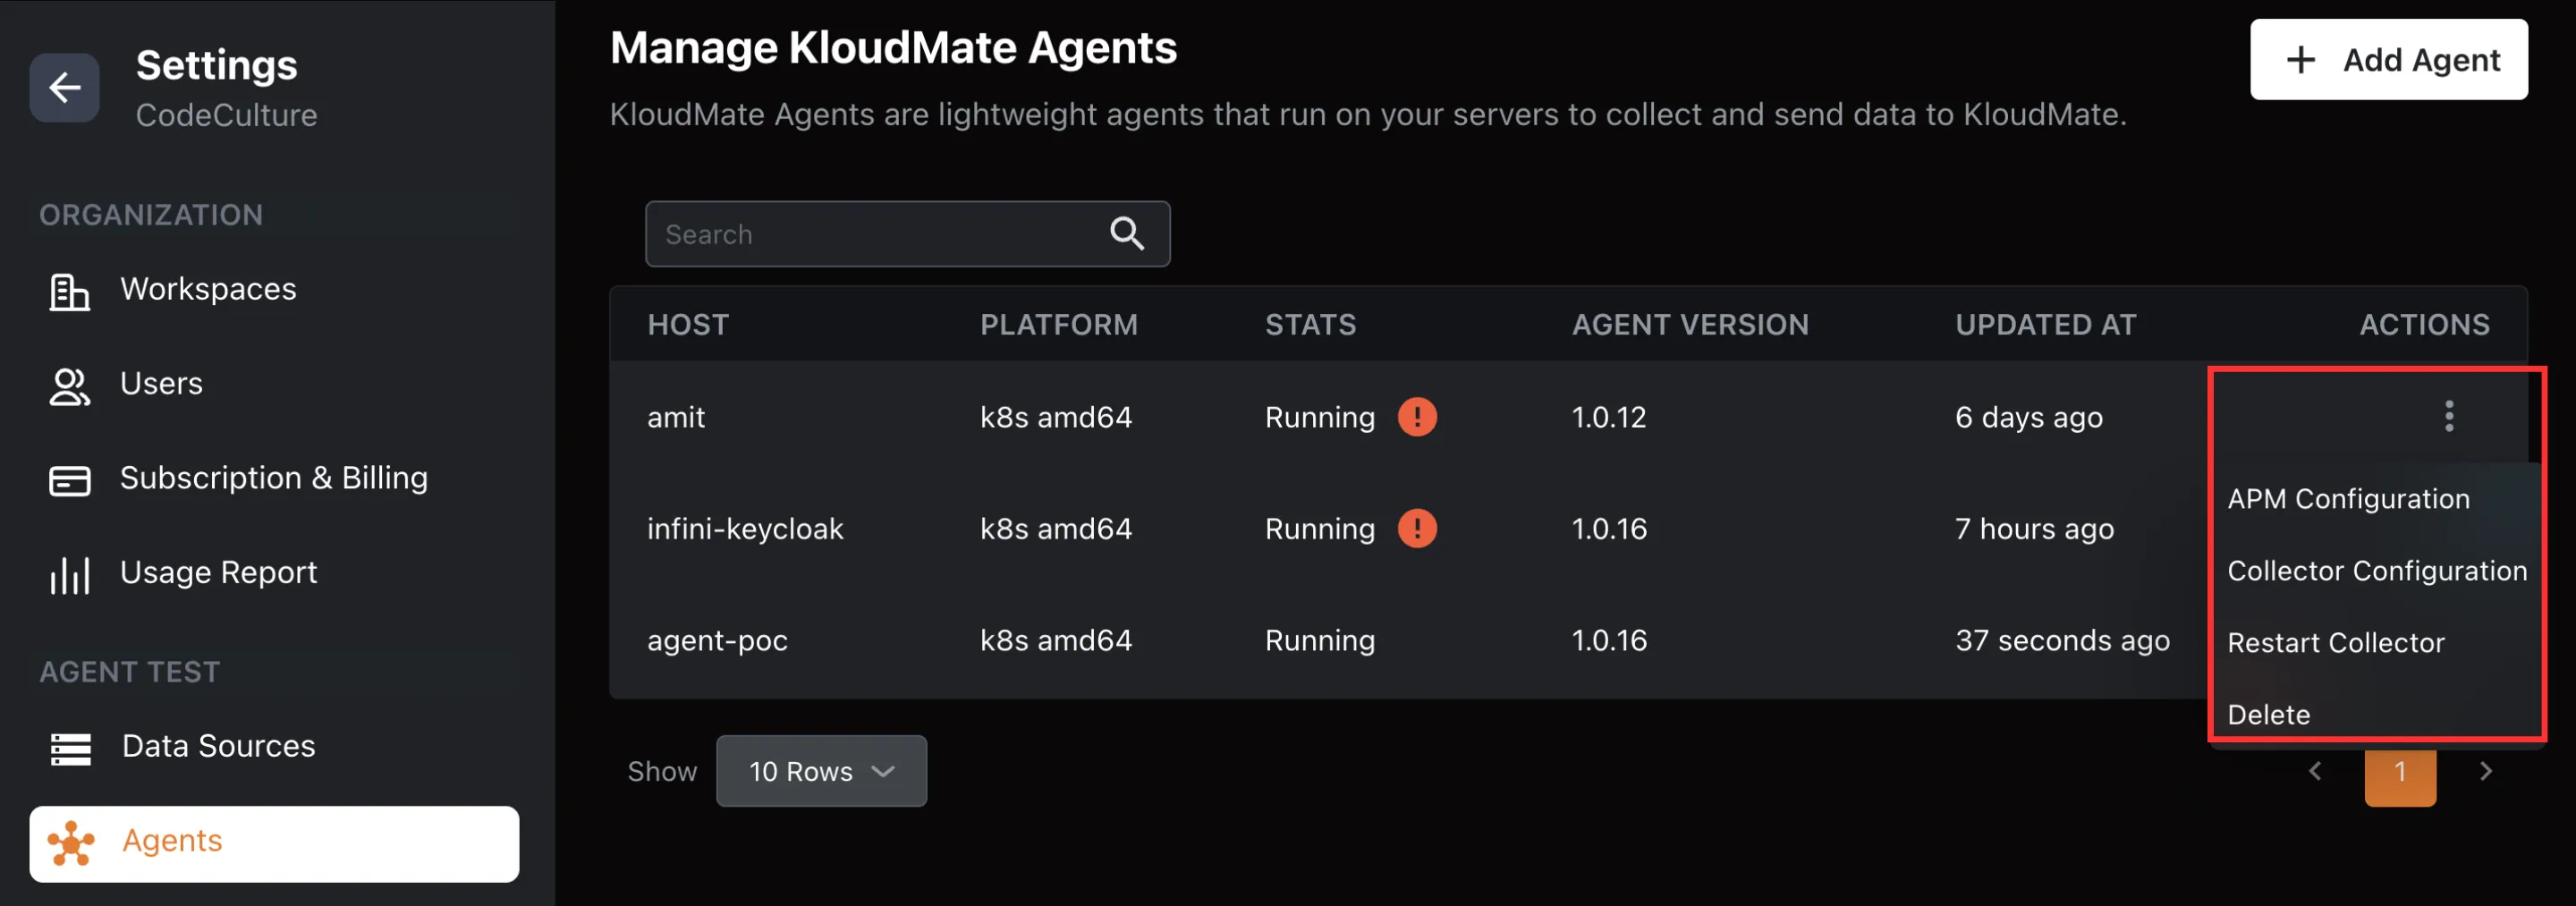
- Collector Configuration: Open the web-based YAML editor to make changes to the collector settings and apply updates automatically where the agent is installed.
- APM Configuration: Configure the applications running on your Kubernetes cluster (applicable only for Kubernetes agents).
- Restart Collector: Restart the collector service when needed.
- Delete: Removes the agent from the list on the KloudMate Agent landing page. To completely remove the agent, you must also uninstall it from the source environment.
Common Configurations
Section titled “Common Configurations”Feature Flags
Section titled “Feature Flags”You can control which telemetry signals the agent collects by updating the feature flags in the configuration:
| Flag | Default | Description |
|---|---|---|
| featuresEnabled.metrics | true | Enables metrics collection |
| featuresEnabled.traces | true | Enables trace collection |
| featuresEnabled.apm | false | Enables application performance monitoring |
| featuresEnabled.logs | false | Enables log collection |
eBPF Configuration
Section titled “eBPF Configuration”To enable deep kernel-level visibility, you can configure the eBPF Receiver in your config.yaml. Below is a standard configuration snippet:
Database Monitoring Configuration
Section titled “Database Monitoring Configuration”Enable heuristic SQL detection and tune caches for high-load environments to capture database query performance:
Best Practices
Section titled “Best Practices”- Use filters and search on the Agents landing page to quickly locate agents by host , platform , or status.
- For clusters with multiple agents, consider bulk restarting or updating collectors where supported.
- Always confirm that agent configurations have applied successfully by checking your dashboards.