MYSQL
The MySQL integration delivers near real-time health and performance metrics for your MySQL databases. These metrics are visualized using a built-in dashboard, and you can configure alerts to notify your team about important MySQL conditions.
MySQL Monitoring in KloudMate helps you observe the health, performance, and behavior of your MySQL databases by collecting metrics and logs using the KloudMate Agent powered by OpenTelemetry. This enables centralized monitoring of MySQL instances running on AWS EC2, Azure Virtual Machines, or on-premise servers.
MySQL Integration using KloudMate Agents
Section titled “MySQL Integration using KloudMate Agents”What This Integration Provides
Section titled “What This Integration Provides”With MySQL Monitoring enabled, KloudMate collects telemetry that provides visibility into: • Buffer pool usage and operations • Connection handling and thread states • InnoDB row locks, double writes, and log operations • Index I/O waits and table operations • Query execution, sorts, and temporary resources • MySQL server uptime and opened resources • Slow query logs and error logs
This visibility helps identify buffer pool inefficiencies, connection bottlenecks, InnoDB performance issues, and slow query problems.
Pre-requisites
Section titled “Pre-requisites”Before configuring MySQL Monitoring, ensure the following:
- MySQL version 8.0 or MariaDB 10.11 is installed and running.
- Refer to the MySQL documentation for supported versions and configuration requirements.
- The monitoring user must have permission to execute
SHOW GLOBAL STATUS. - To collect query samples,
performance_schemamust be enabled and the monitoring user must be granted access:`GRANT SELECT ON performance_schema.* TO <your-user>@'%';` - KloudMate Agent installed on the MySQL host
- MySQL username and password for authentication.
- MySQL logs must be enabled from configurations.
Step 1: Access Agents and OpenTelemetry Collector Configuration
Section titled “Step 1: Access Agents and OpenTelemetry Collector Configuration”- Log in to the KloudMate platform
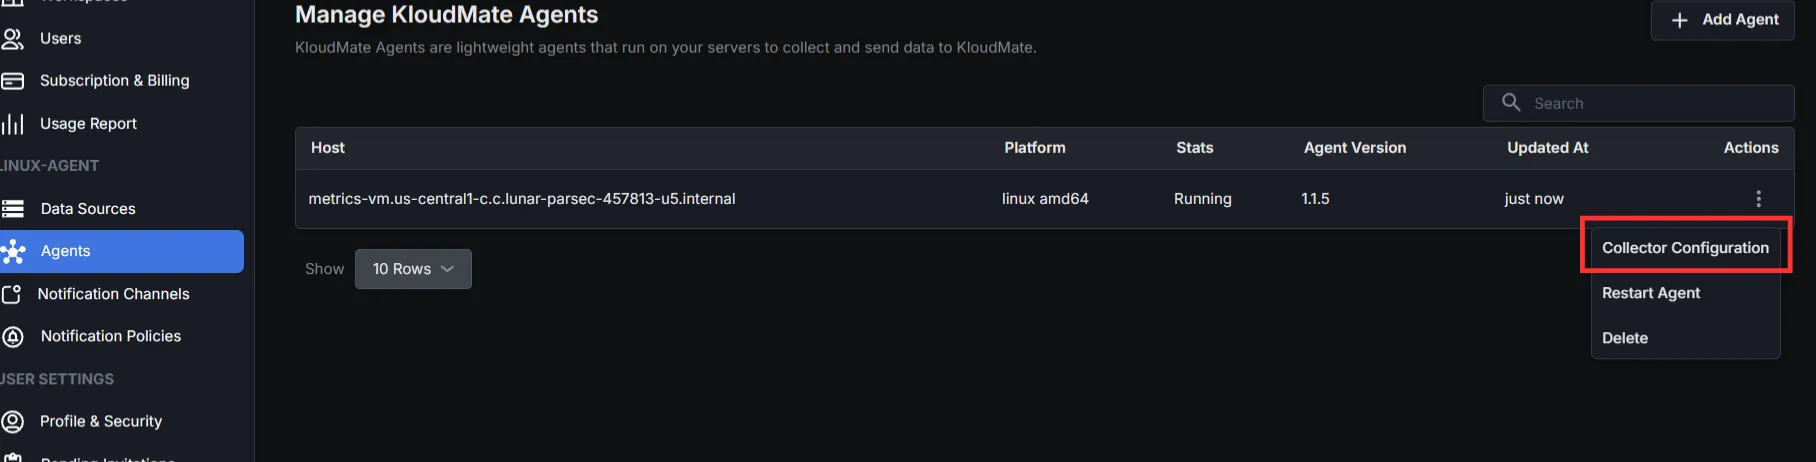
- Go to Settings → Agents
- Select the agent running on the MySQL host
- Click Actions → Collector Configuration
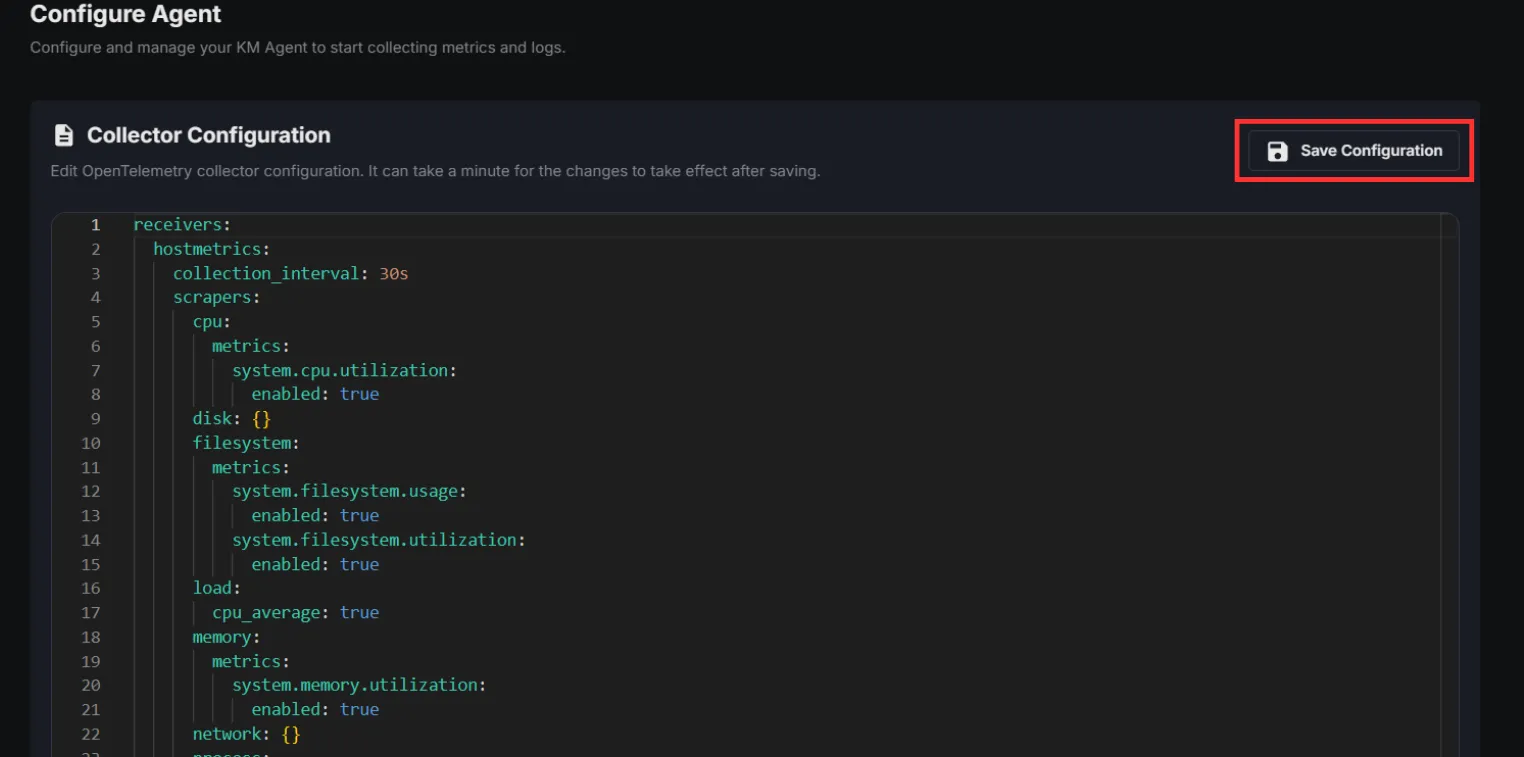
- YAML editor opens for configuration
Step 2: Add Required Extensions and Receivers
Section titled “Step 2: Add Required Extensions and Receivers”Extensions
Receivers
Two receivers are used:
- MySQL Receiver – collects metrics
- File Log Receiver – collects logs (general, error, slow queries)
If you only need metrics, configure only the MySQL receiver.
Step 3: Configure Processors
Section titled “Step 3: Configure Processors”Set up the processor component to identify resource information from the host and either append or replace the resource values in the telemetry data with this information.
Choose one configuration based on where MYSQL is running.
- Server (On-premise / Non-cloud / Cloud)
- AWS EC2:
(Optional) To collect EC2 tags, attach an IAM role with EC2:DescribeTags permission.
- Azure Virtual Machines:
Step 4: Configure Exporter and Pipelines
Section titled “Step 4: Configure Exporter and Pipelines”Configure the KloudMate backend exporter and define pipelines for metrics and logs.
Step 5: Save Configuration and Restart Agent
Section titled “Step 5: Save Configuration and Restart Agent”After updating the configuration, click Save Configuration in the KloudMate UI.
You can also restart the agent from your server’s console.
For Linux:
- Execute the following commands:
These commands restart the KloudMate Agent and display its current status.
For Windows
- Open the Services window
- Press
Win + R, typeservices.msc, and pressOK - Or search for Services from the Start menu
- Press
- Locate the KloudMate Agent service.
- Right-click the service and select Restart.
After restarting the agent, verify that MySQL metrics and logs are visible in the KloudMate dashboard.
Post‑Integration Data Validation
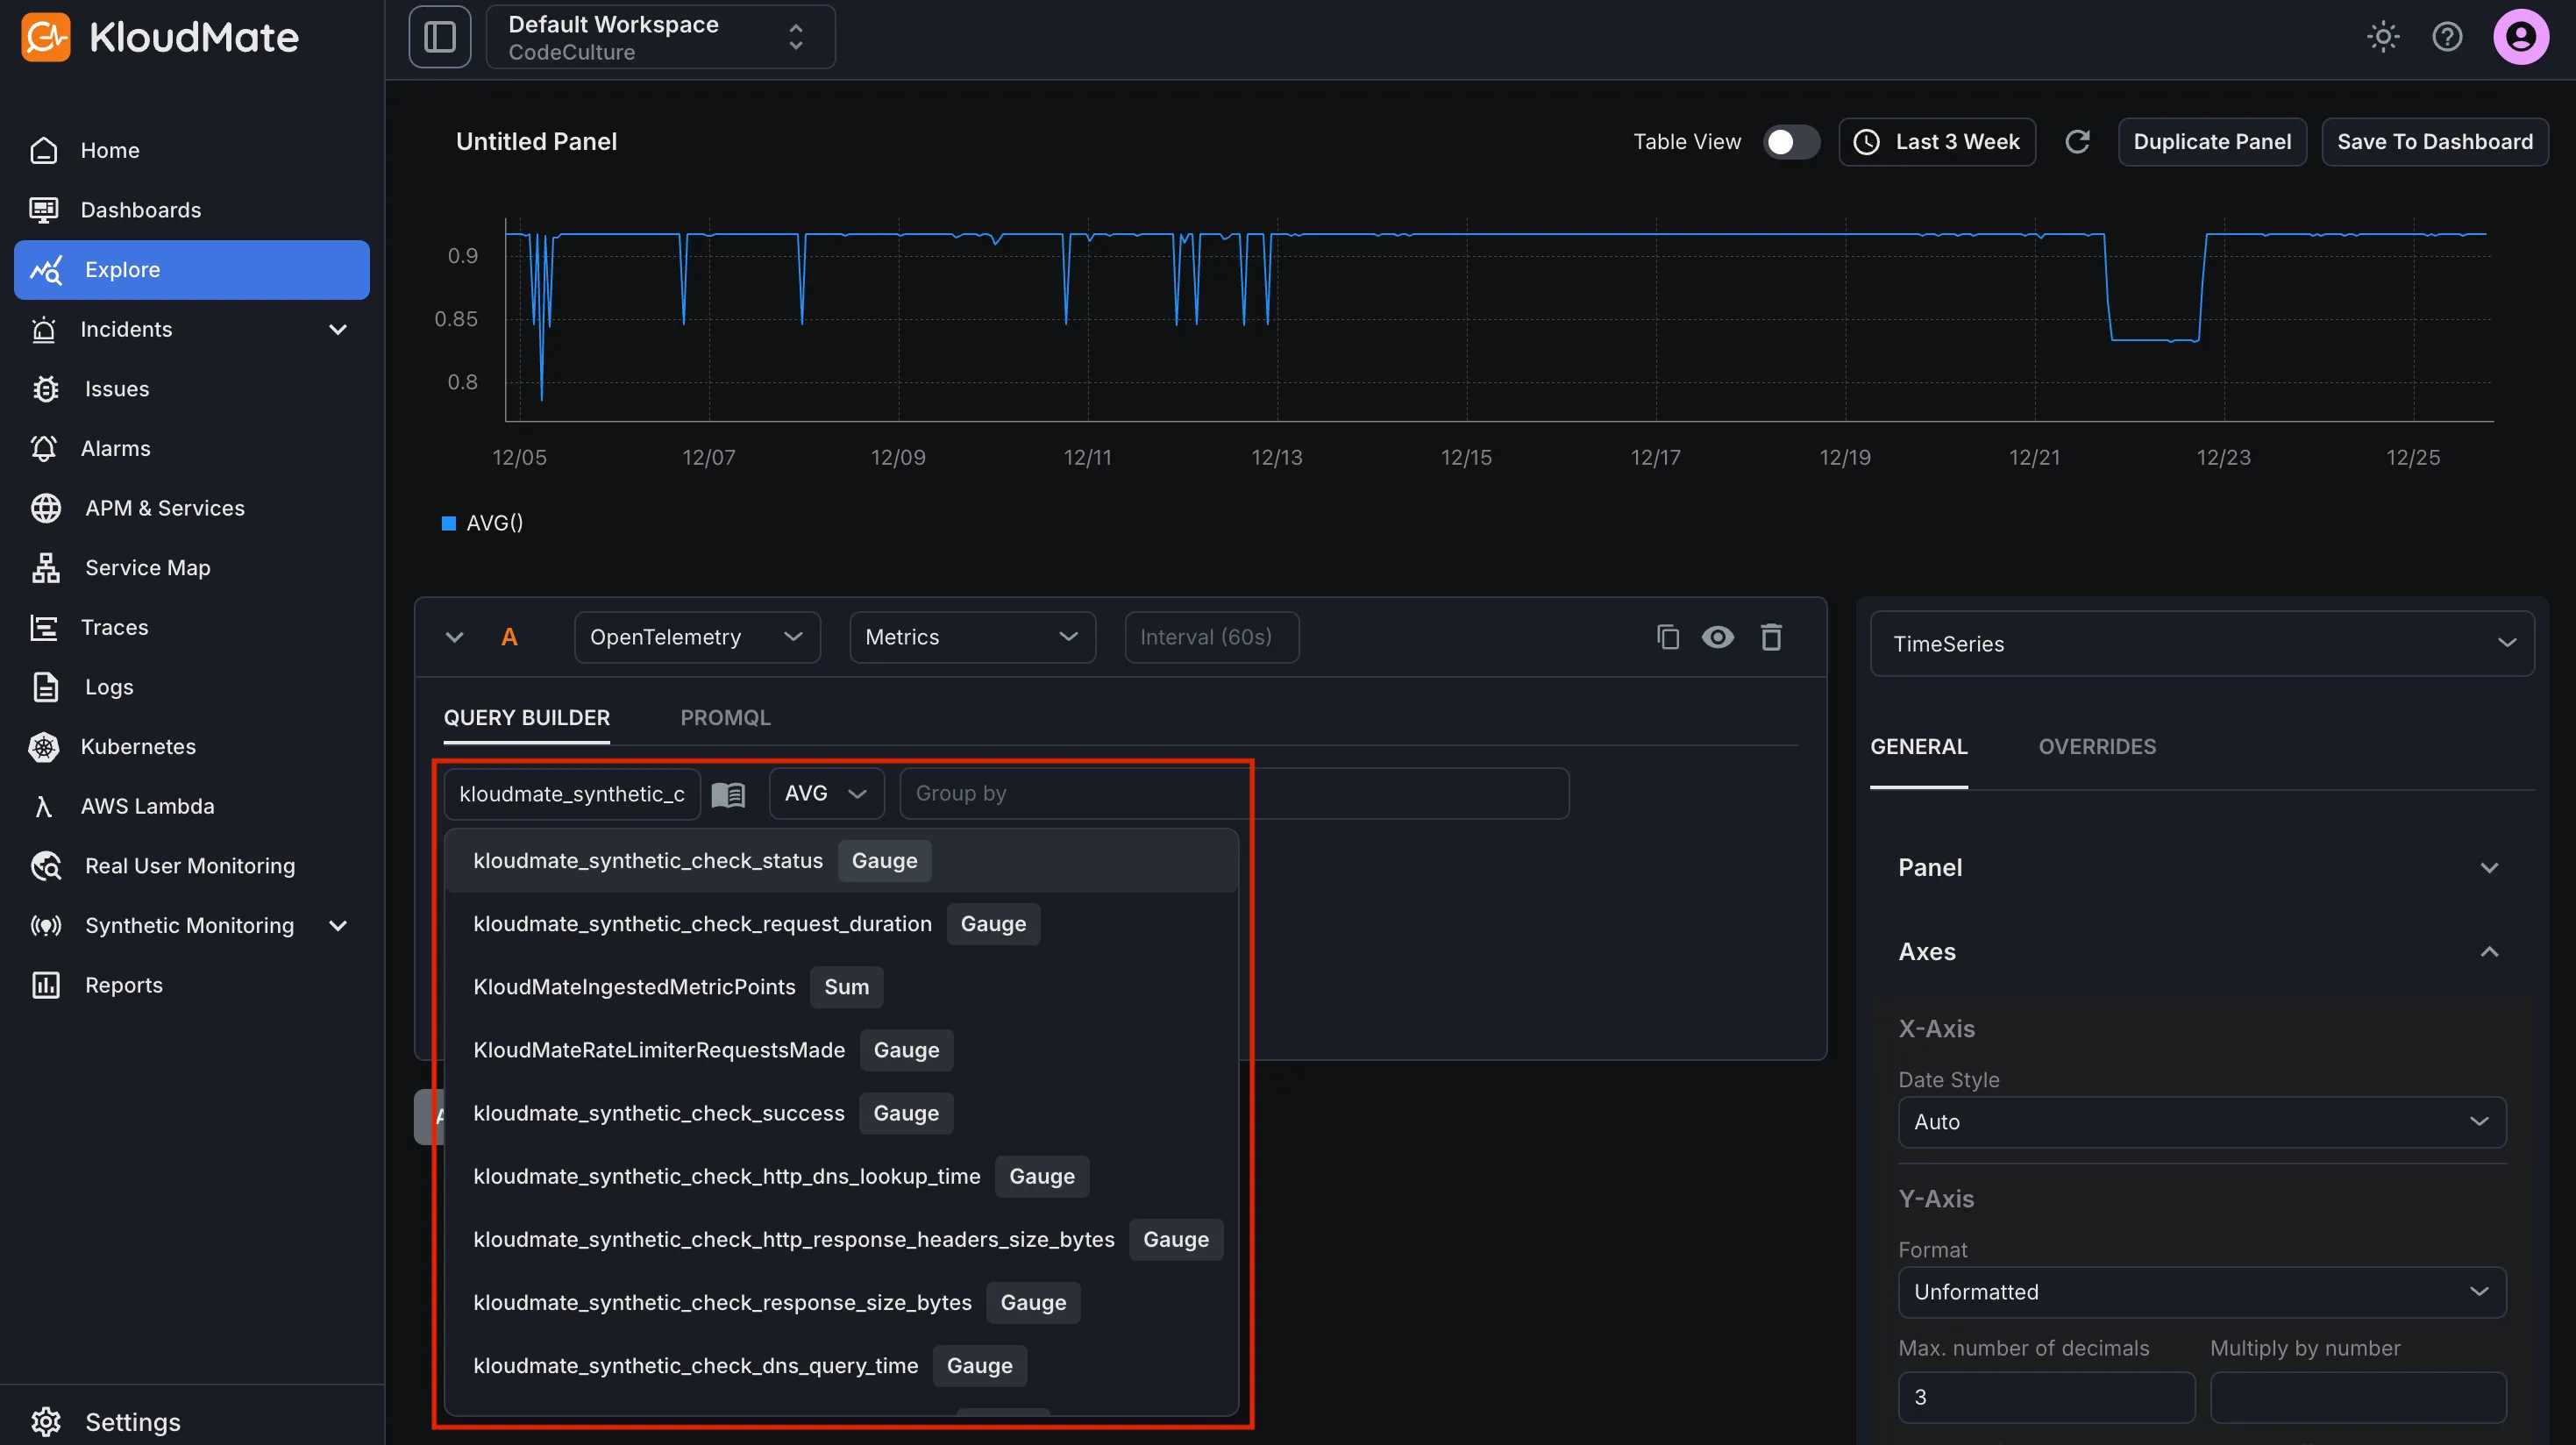
Section titled “Post‑Integration Data Validation”Verify that metrics are flowing into KloudMate using the Explore view.
After the agent restarts:
- Log in to KloudMate
- Navigate to Explore
- Select OpenTelemetry → Metrics
- Choose a MySQL metric and run the query
Seeing time-series data confirms that MySQL telemetry is flowing successfully.
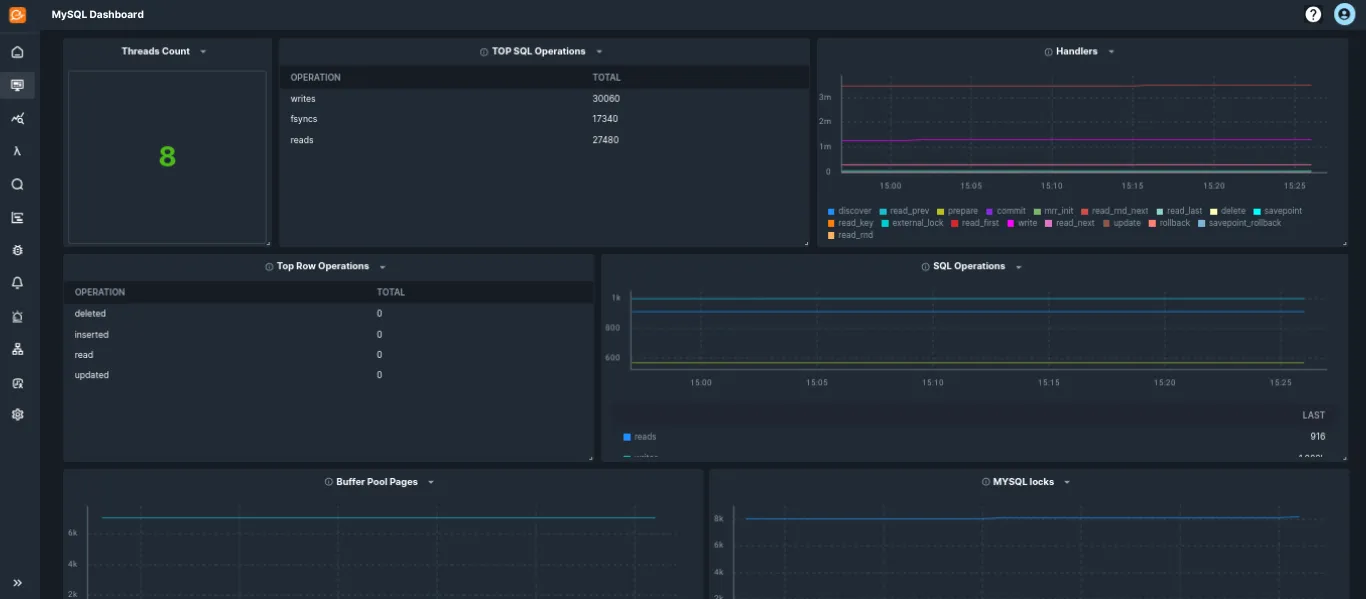
Standard MySQL Dashboards
Section titled “Standard MySQL Dashboards”KloudMate provides prebuilt MYSQL dashboards through dashboard templates. These dashboards visualize MYSQL database performance, query operations, connections, and resource usage.
To import and start using these templates, follow the steps described in Import from Templates.
Default Metrics
Section titled “Default Metrics”| Metric Name | Description |
|---|---|
| mysql_operations | Total operations including fsync, reads and writes |
| mysql_buffer_pool_data_pages | Number of data pages for an InnoDB buffer pool |
| mysql_buffer_pool_limit | Configured size of the InnoDB buffer pool |
| mysql_buffer_pool_operations | Number of operations on the InnoDB buffer pool |
| mysql_buffer_pool_page_flushes | Sum of Requests to flush pages for the InnoDB buffer pool |
| mysql_mysqlx_connections | Total MySQLx connections |
| mysql_tmp_resources | Number of temporary resources created |
| mysql_uptime | Number of seconds since the server has been up |
| mysql_index_io_wait_count | Total time of I/O wait events for a particular index |
| mysql_handlers | Number of requests to various MySQL handlers |
| mysql_locks | Total MySQL locks |
| mysql_log_operations | Number of InnoDB log operations |
| mysql_index_io_wait_time | Total time of I/O wait events for a particular index |
| mysql_row_locks | Total InnoDB row locks present |
| mysql_buffer_pool_usage | Number of bytes in the InnoDB buffer pool |
| mysql.page_operations | Total operation on InnoDB pages |
| mysql_double_writes | Number of writes to the InnoDB doublewrite buffer pool |
| mysql_table_io_wait_count | Total I/O wait events for a specific table |
| mysql_table_io_wait_time | Total wait time for I/O events for a table |
| mysql_prepared_statements | Number of times each type of Prepared statement command got issued |
| mysql_sorts | Total MySQL sort execution |
| mysql_row_operations | Total row operations executed |
| mysql_threads | Current state of MySQL threads |
| mysql_opened_resources | Total opened resources |
| mysql_buffer_pool_pages | Sum of pages in the InnoDB buffer pool |
For the complete metrics list, refer to the metrics reference.