gRPC Monitor
The gRPC Monitor enables continuous health checks for gRPC services by invoking specified RPC methods and validating responses.
Creating a New gRPC Monitor
Section titled “Creating a New gRPC Monitor”- Navigate to Synthetic monitoring > Monitors.
- Click Add new.
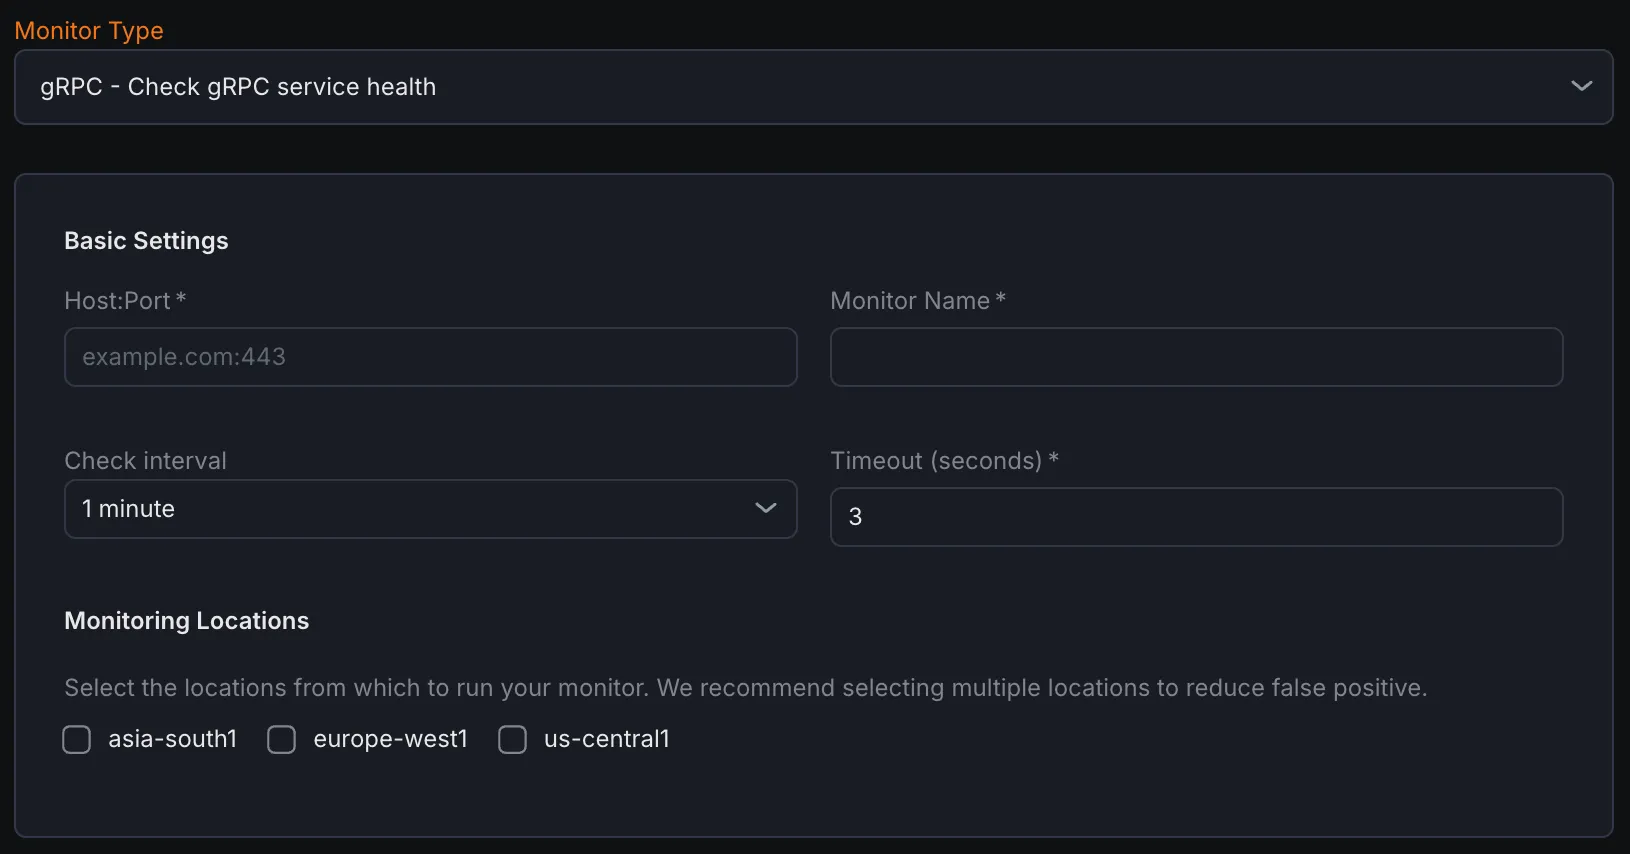
- Select gRPC - Check gRPC service health from the monitor type dropdown.
Basic Settings
Section titled “Basic Settings”- Host:Port
Enter the gRPC server’s host and port in the format
hostname:portto monitor. - Monitor Name Provide a descriptive name for the gRPC monitor.
- Check Interval Define the frequency at which the monitor sends requests to the gRPC service.
- Timeout Set the maximum allowed time to receive a response before marking the check as failed.
- Monitoring Locations Select one or more geographic locations from which the health check requests will be performed.
Notification Settings
Section titled “Notification Settings”Select one or more notification channels to receive alerts if the gRPC service becomes unhealthy or unresponsive.
gRPC Configuration
Section titled “gRPC Configuration”- Service
Specify the fully qualified name of the gRPC service to call (e.g.,
package.ServiceName). - Method
Specify the RPC method within the chosen service (e.g.,
MethodName). - Payload (JSON) Provide the request message in JSON format. Although gRPC uses binary Protobuf, the monitor converts this JSON payload automatically to Protobuf for the request.
- Use Plaintext (no TLS) Enable this option to disable SSL/TLS encryption, sending requests in plaintext.
Assertions
Section titled “Assertions”Configure assertions to validate different aspects of the gRPC responses:
- Status Code Checks the gRPC-specific status code returned by the server (distinct from HTTP status codes).
- Response Time (ms) Measures the total time taken for the gRPC request and response cycle in milliseconds.
- Response Body Validates the entire response message returned by the gRPC server.
- JSON Body (JSON Path) Allows inspection of specific fields within the JSON-converted response using JSONPath expressions.
- Header Checks gRPC metadata sent as request/response headers.
- Trailer Validates gRPC trailers—metadata sent after the response body.
Metrics
Section titled “Metrics”Metrics available to be monitored in Dashboard section
| Metric Name | Type | Description | Labels |
|---|---|---|---|
| kloudmate_synthetic_check_grpc_response_time | Gauge | Time taken for the gRPC call | check_id, check_name, check_type, target, workspace_id, location |
| kloudmate_synthetic_check_grpc_status_code | Gauge | The gRPC status code returned by the service. | check_id, check_name, check_type, target, workspace_id, location, grpc_method |
| kloudmate_synthetic_check_request_duration | Gauge | The total time taken for the primary operation of the check (e.g., HTTP request, DNS query, gRPC call). | check_id, check_name, check_type, target, workspace_id, location |
|---|