Manual Integration of Azure Monitor
This document provides a step-by-step manual approach to integrating Azure Monitor with KloudMate using KloudMate agents. The KloudMate agents allow you to scrape telemetry data from Azure Monitor resources and send them to KloudMate for centralized monitoring and analysis.
Pre-requisite
Section titled “Pre-requisite”-
Azure Service Principal for Authentication: You will need a service principal with appropriate permissions to access Azure Monitor APIs.
Required settings for authentication:
subscription_idtenant_idclient_idclient_secretTo enable authentication follow the document: Enable Service Principal Azure.
-
KloudMate Agent installed on the server scraping Azure Monitor metrics (see agent installation for Linux Agent and Windows Agent).
Step 1: Access Agents and OpenTelemetry Collector Configuration
- Navigate to the KloudMate platform and log in to your account.
- Go to Settings > Agents section.
- Here you can:
- View all installed agents.
- Access configuration settings for each agent.
- Review the default configurations provided by KloudMate.
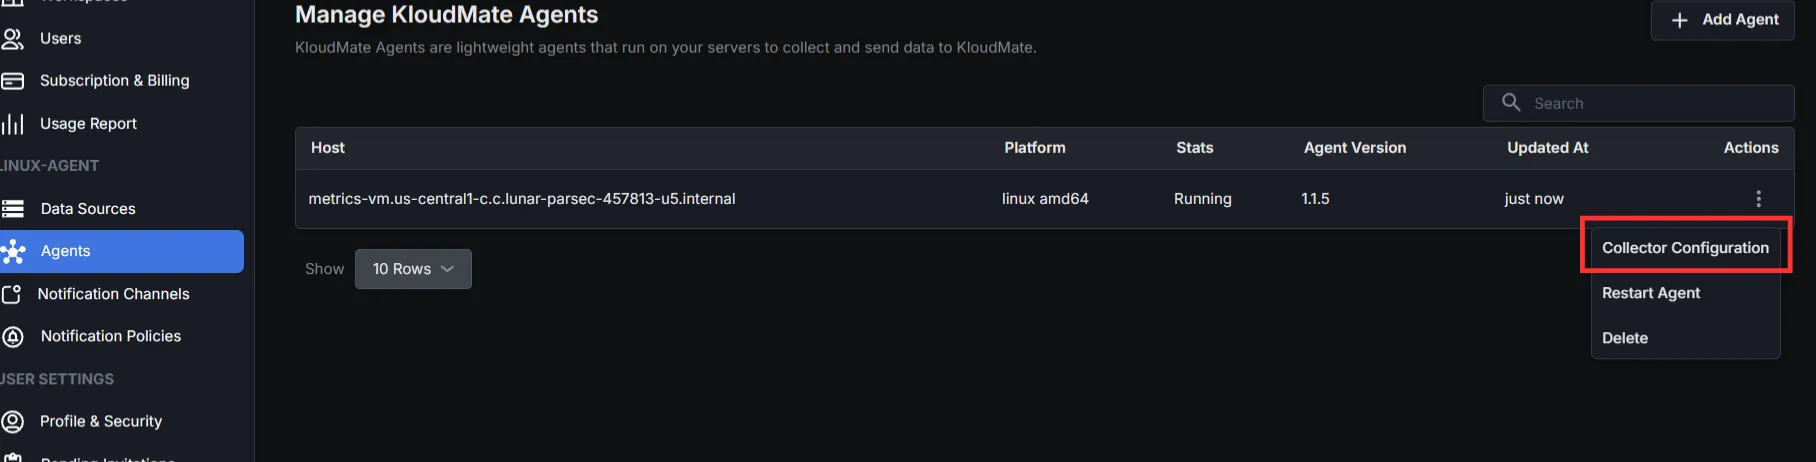
- To edit an agent’s collector configuration:
- Select the desired agent.
- Click the Actions menu (or Agent action tab).
- Choose Collector Configuration.
- A text editor UI will open, allowing you to edit the agent’s YAML configuration directly within the platform.
1. In this configuration file, ensure the Azure Monitor receiver is set up to collect and send metrics.
To monitor a specific service or resource group, the user can uncomment the resource_groups[] and services[] entries in the configuration file.
2. Set up the exporter as the KloudMate backend by specifying the endpoint and authorisation key in the agent configuration file, and configure the pipeline.
Step 2: Save Configuration and Restart Agent
After updating the configuration, click “Save Configuration ” in the UI

or, from your server’s console, run:
For Linux:
- Execute the following commands:
These commands will restart the KloudMate agent and display its current status.
For Windows:
- Open the Services window:
- Press
Win + R, typeservices.msc, and pressOK. - Alternatively, search for “
Services” in the Windows Start menu.
- Press
- In the Services window, locate the “
KloudMate agent” service. - Right-click the service and select “
Restart.”
Subsequently, monitor the metrics on the KloudMate dashboard and set up an alarm to receive notifications if the potential metrics for a specific application rise.