Monitors
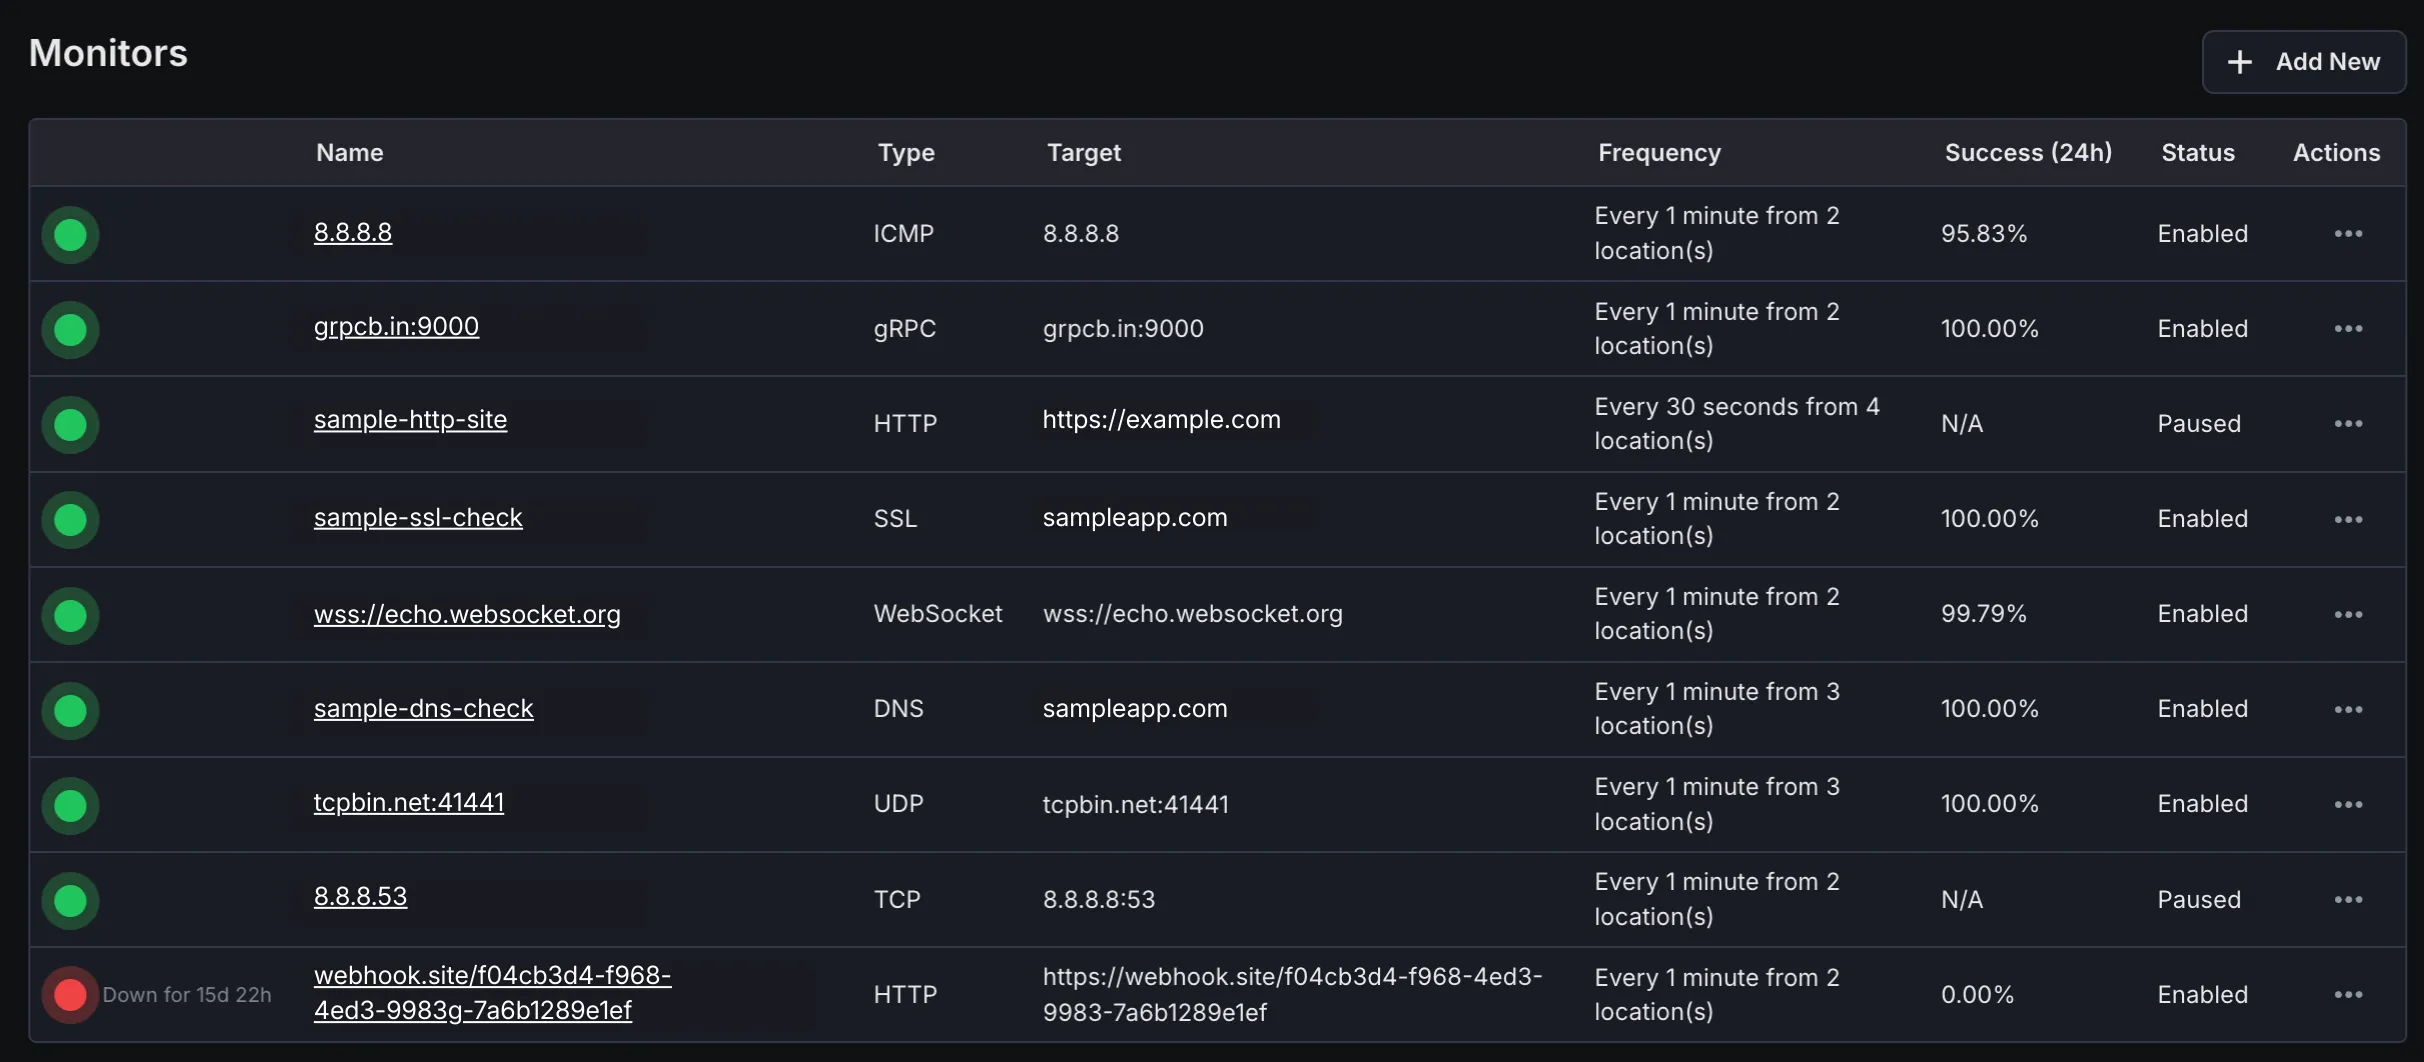
The Monitors page displays all monitors created within the current workspace, providing key status information at a glance for quick assessment of monitoring health.
Monitors Overview
Section titled “Monitors Overview”- Name: The user-defined name of each monitor, for easy identification.
- Type: Indicates the monitor type (e.g., HTTP, SSL, DNS, TCP, UDP, gRPC, WebSocket, ICMP, Push).
- Target: Shows the endpoint or host the monitor is targeting (e.g., URL, host:port, domain).
- Frequency: Displays the check interval and number of monitoring locations used for each check.
- Success (24h): Shows the success percentage of the monitor over the past 24 hours.
- Status: Indicates the current operational status of the monitor (e.g., Up, Down, Warning).
Monitor Details Page
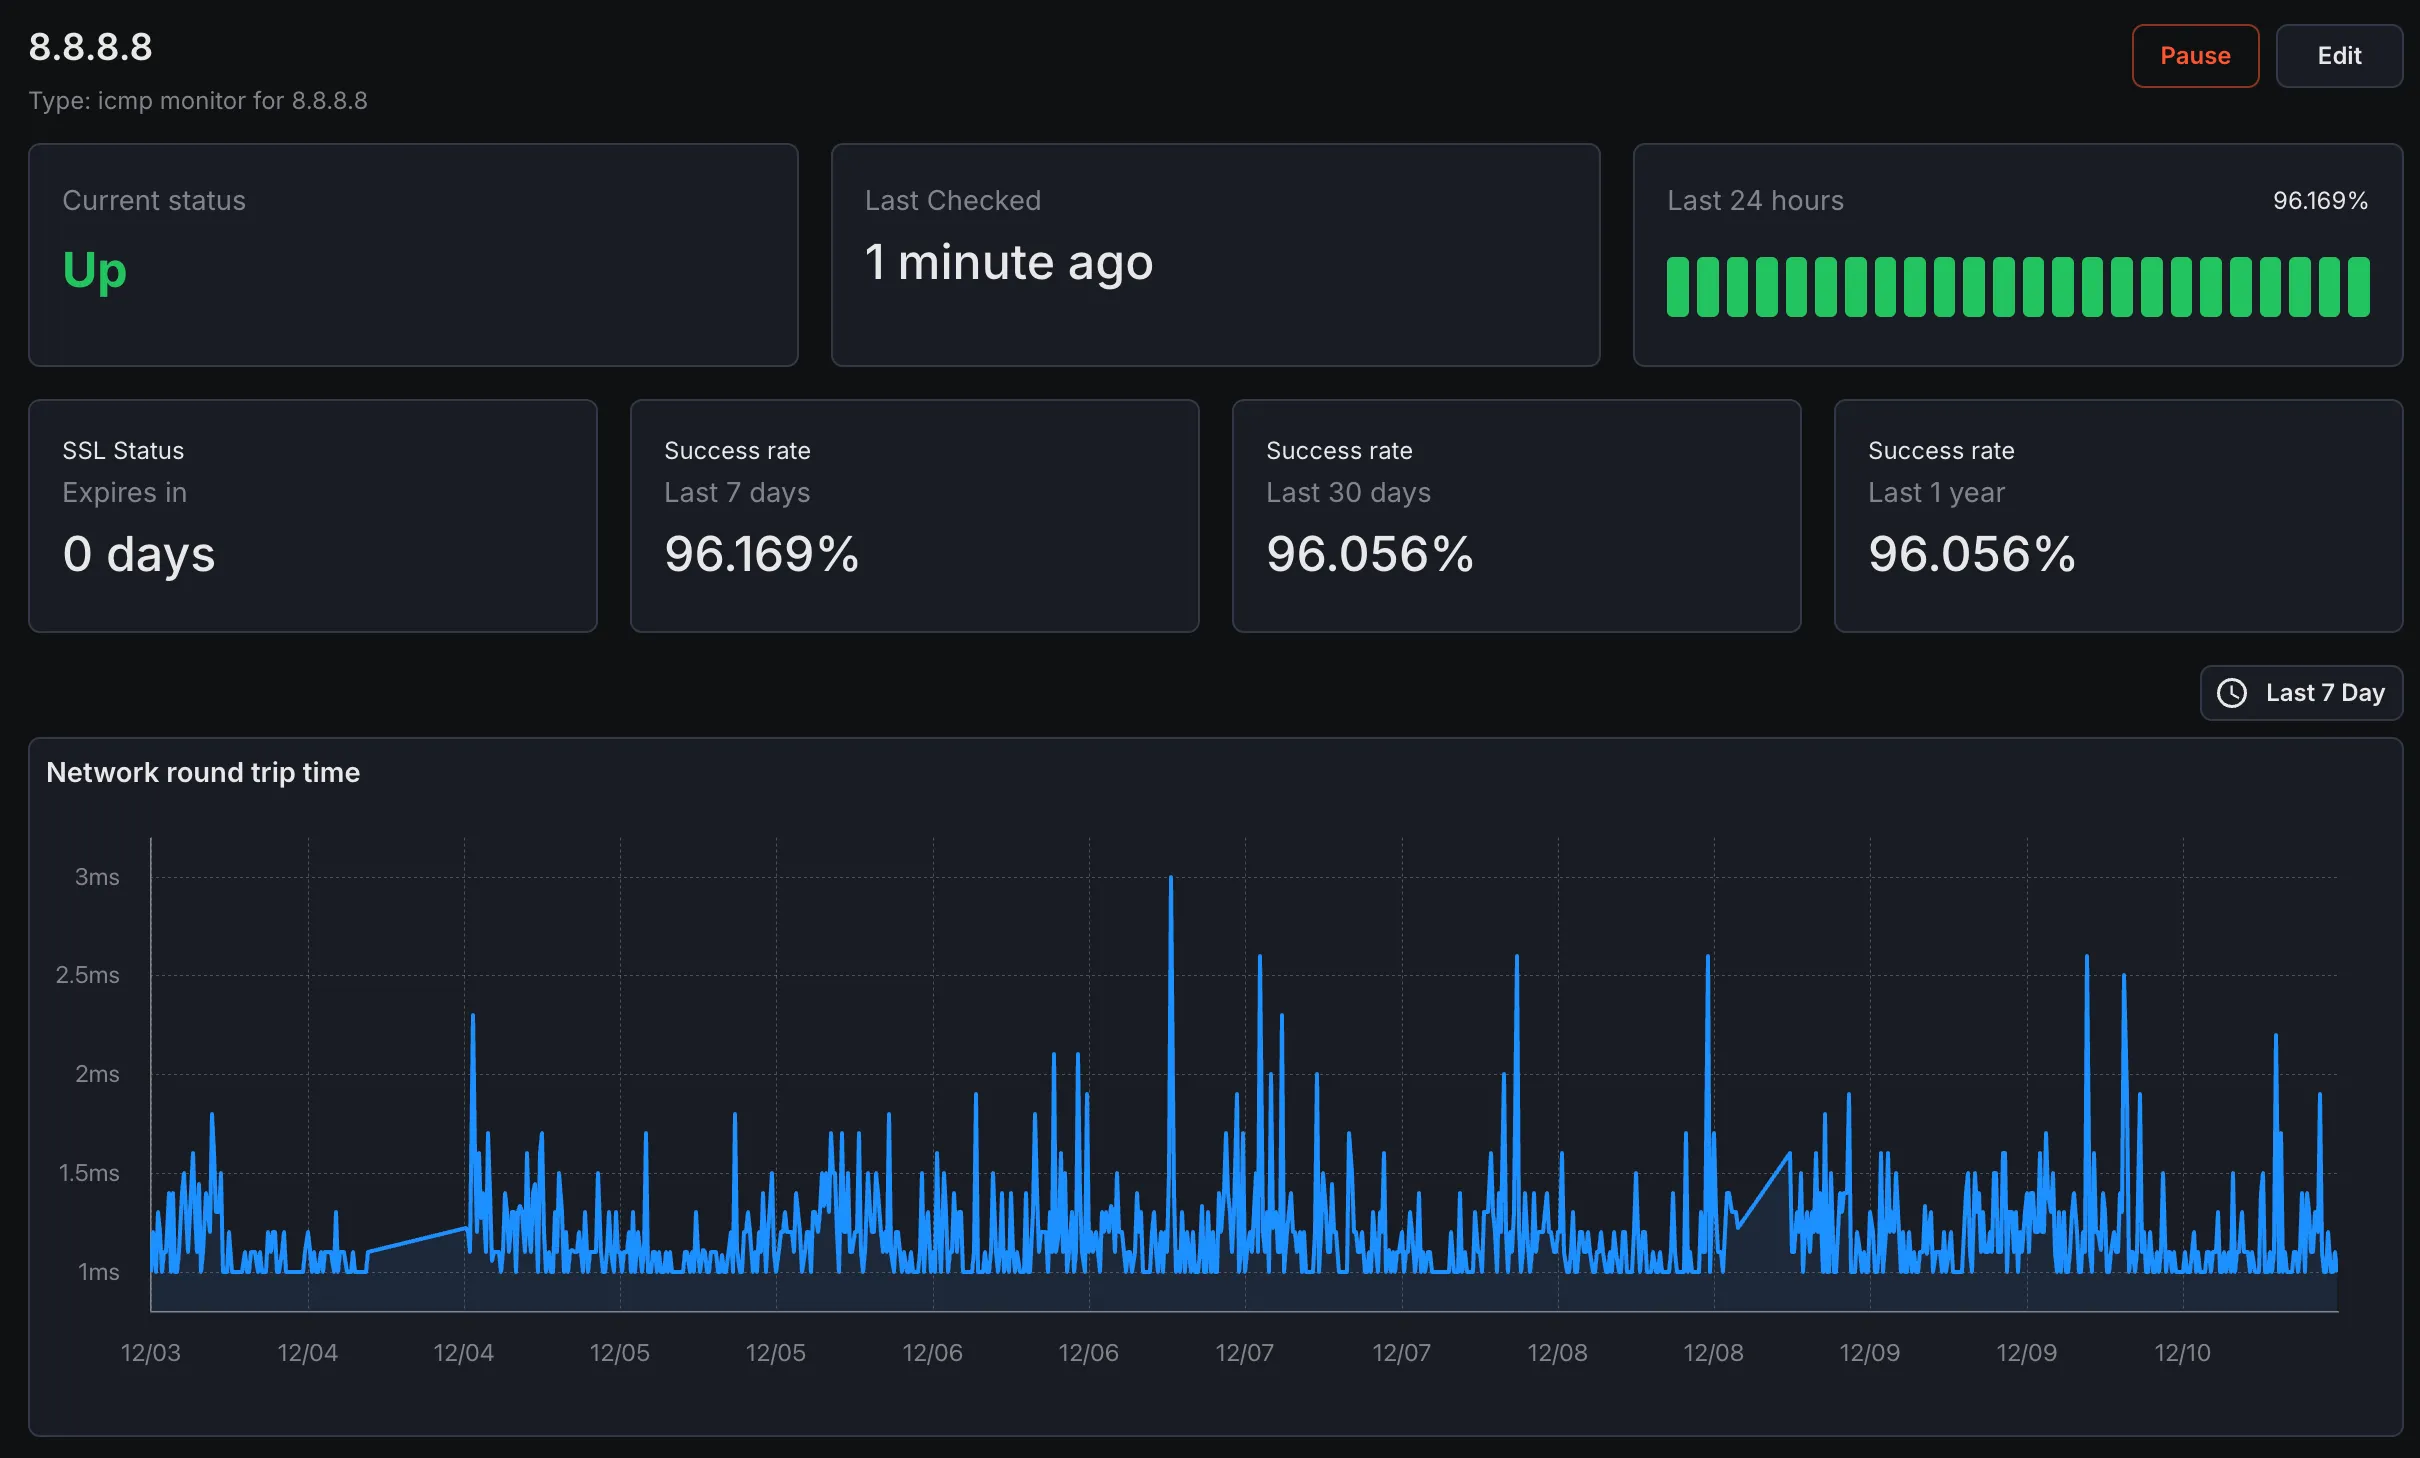
Section titled “Monitor Details Page”Clicking any monitor from the list, navigates to its dedicated details page, offering comprehensive performance and history information.
Details Page Sections - Status
Current real-time status of the monitor with visual indicators.
- Success Rate Detailed success rate metrics over various time periods.
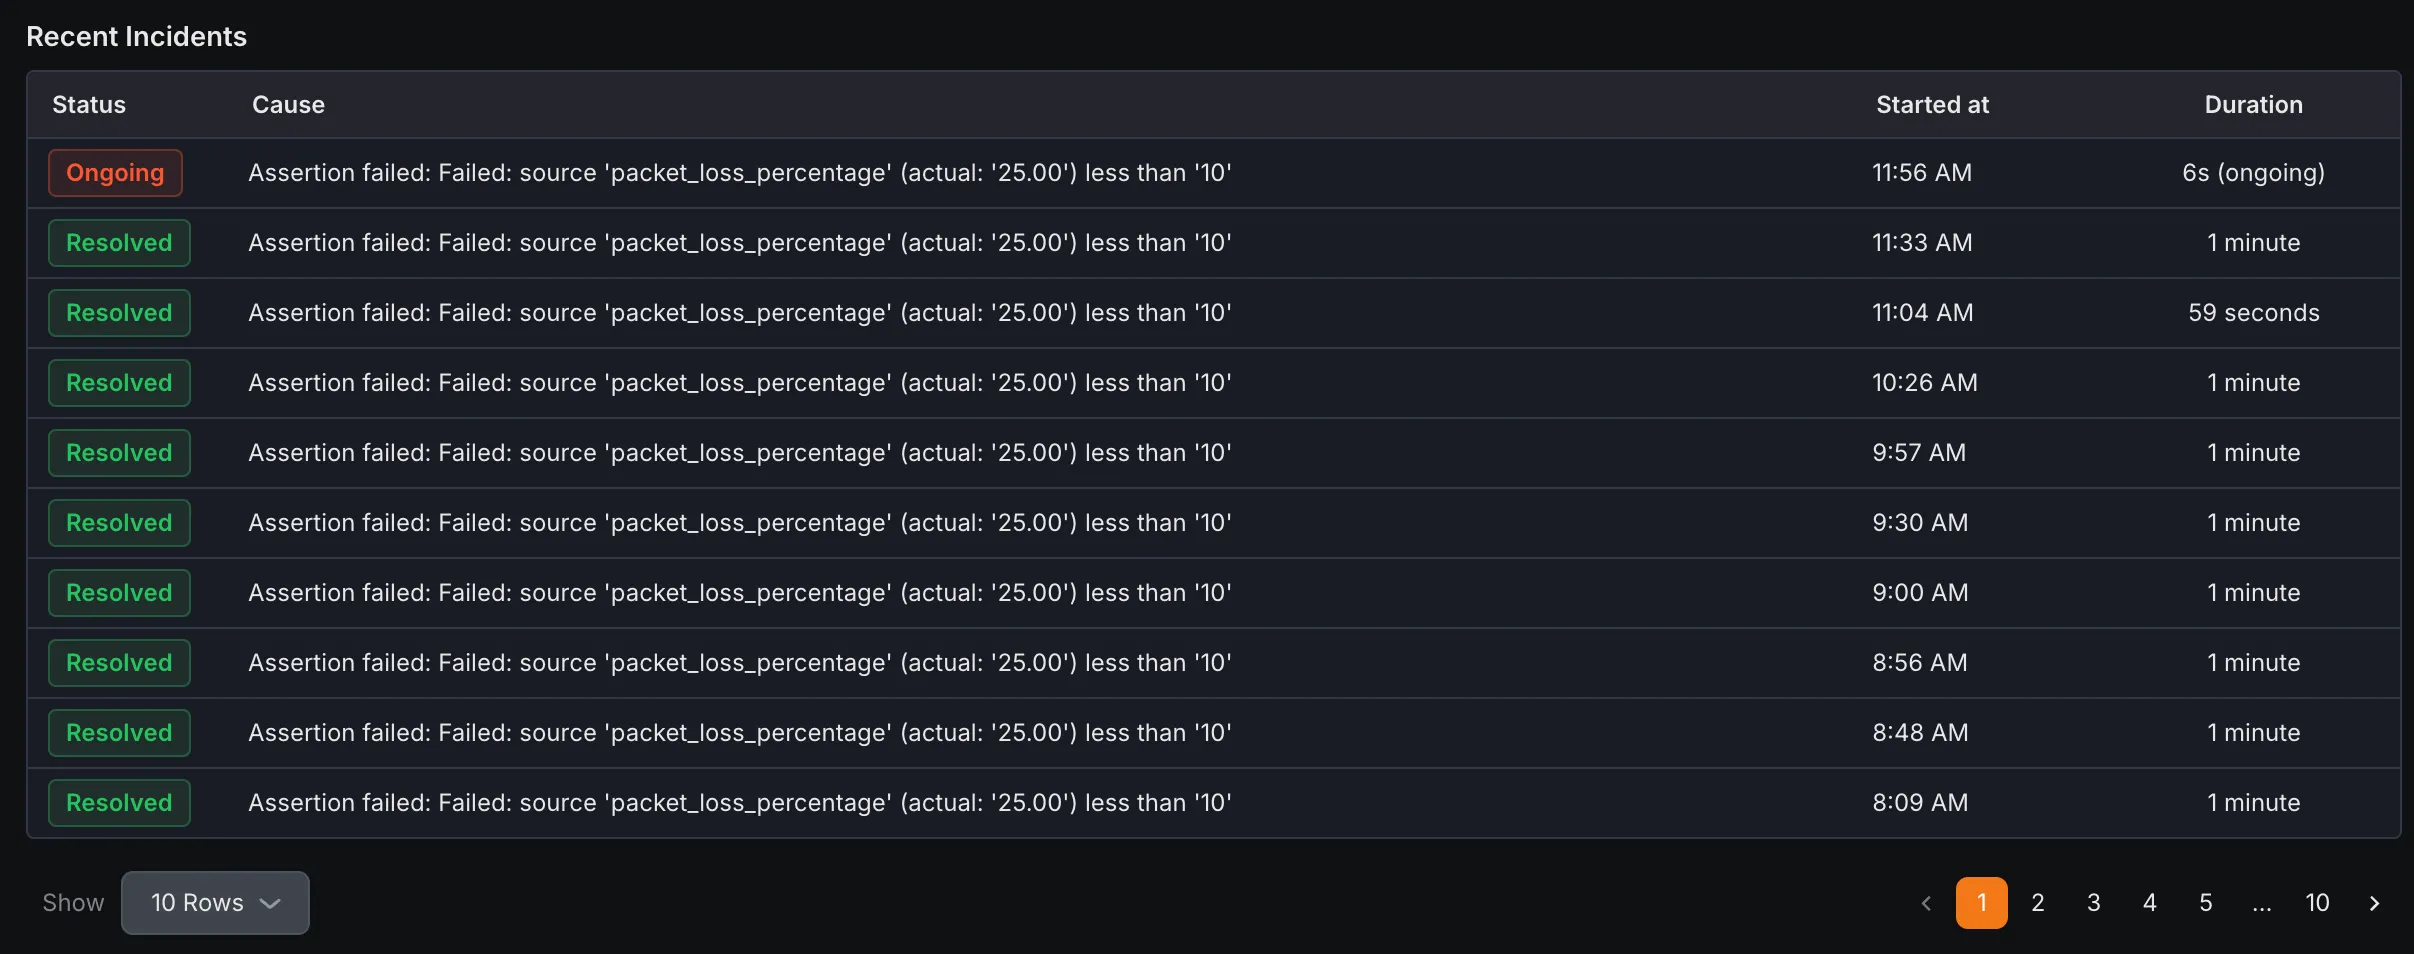
- Recent Incidents History of downtime incidents with timestamps and durations.
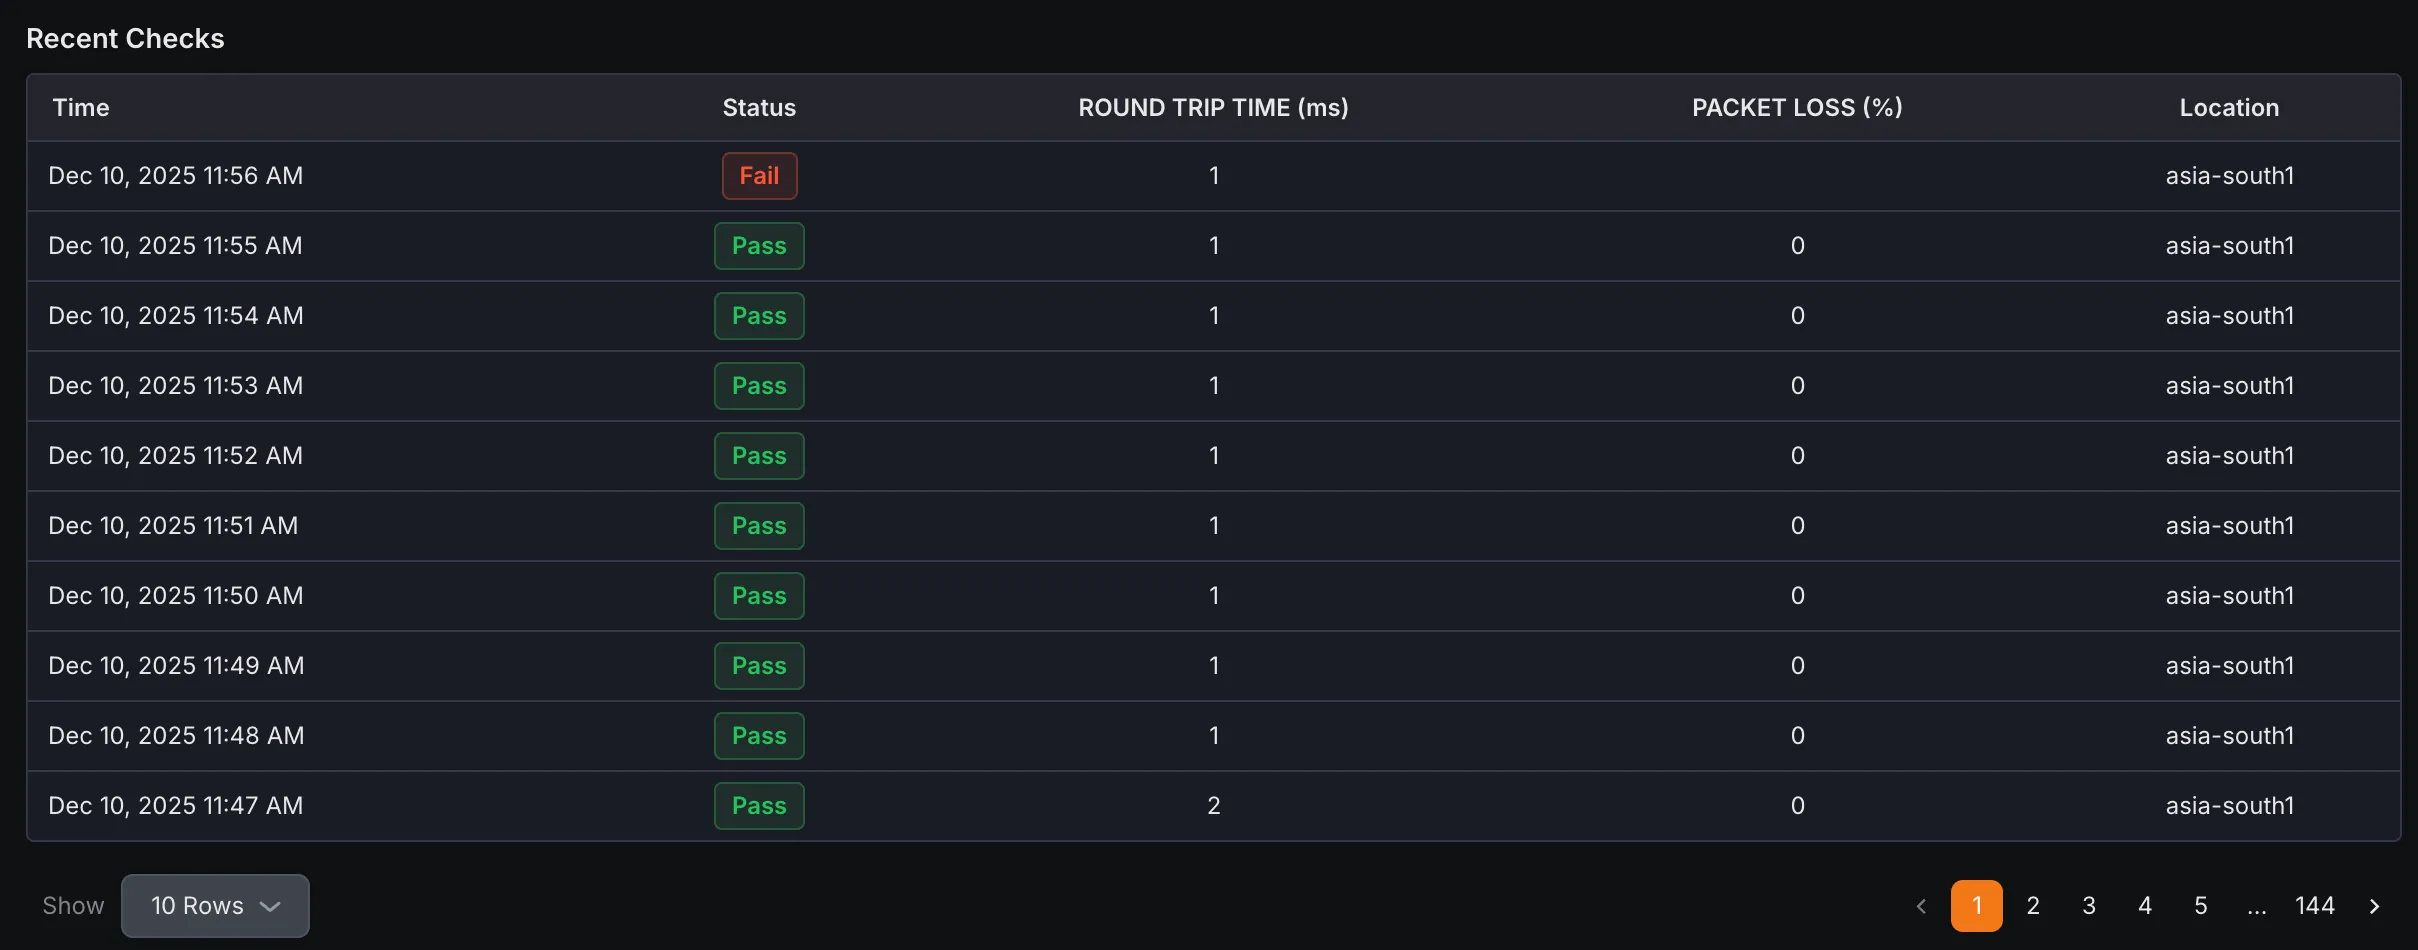
- Recent Checks
Log of the most recent check executions with results and timings.
Core Uptime and Status Metrics
Section titled “Core Uptime and Status Metrics”Metrics available to be monitored in Dashboard section. These metrics are applicable to all monitors.
| Metric Name | Type | Description | Labels |
|---|---|---|---|
| kloudmate_synthetic_check_success | Gauge | Indicates if a check was successful (1) or failed (0) based on the success quorum | check_id, check_name, check_type, target, workspace_id |
| kloudmate_synthetic_check_status | Gauge | Indicates if a check was successful (1) or failed (0) for a specific location | check_id, check_name, check_type, target, workspace_id, location |