PostgreSQL
PostgreSQL is a powerful open-source relational database known for reliability, extensibility, and strong compliance with SQL standards. It is widely used for transactional applications, analytics workloads, and enterprise systems that require data integrity and performance.
PostgreSQL Monitoring in KloudMate helps you observe the health, performance, and behavior of your PostgreSQL databases by collecting metrics and logs using the KloudMate Agent powered by OpenTelemetry. This enables centralized monitoring of PostgreSQL instances running on AWS EC2, Azure Virtual Machines, or on-premise servers.
PostgreSQL Integration using KloudMate Agents
Section titled “PostgreSQL Integration using KloudMate Agents”What This Integration Provides
Section titled “What This Integration Provides”With PostgreSQL Monitoring enabled, KloudMate collects telemetry that provides visibility into:
- Database health and performance metrics
- Locks, deadlocks, and query behavior
- Slow queries through log analysis
- Resource usage at host level
- PostgreSQL server logs
This visibility helps identify performance bottlenecks, long-running queries, locking issues, and availability problems.
Pre-requisites
Section titled “Pre-requisites”Before configuring PostgreSQL Monitoring, ensure the following:
- Refer to PostgreSQL documentation for supported versions
- Monitoring user must have SELECT permission on pg_stat_database
- PostgreSQL is installed and running
- KloudMate Agent installed on the PostgreSQL host
- PostgreSQL username and password
- PostgreSQL logging enabled in the server configuration
Step 1: Access Agents and OpenTelemetry Collector Configuration
Section titled “Step 1: Access Agents and OpenTelemetry Collector Configuration”- Log in to the KloudMate platform
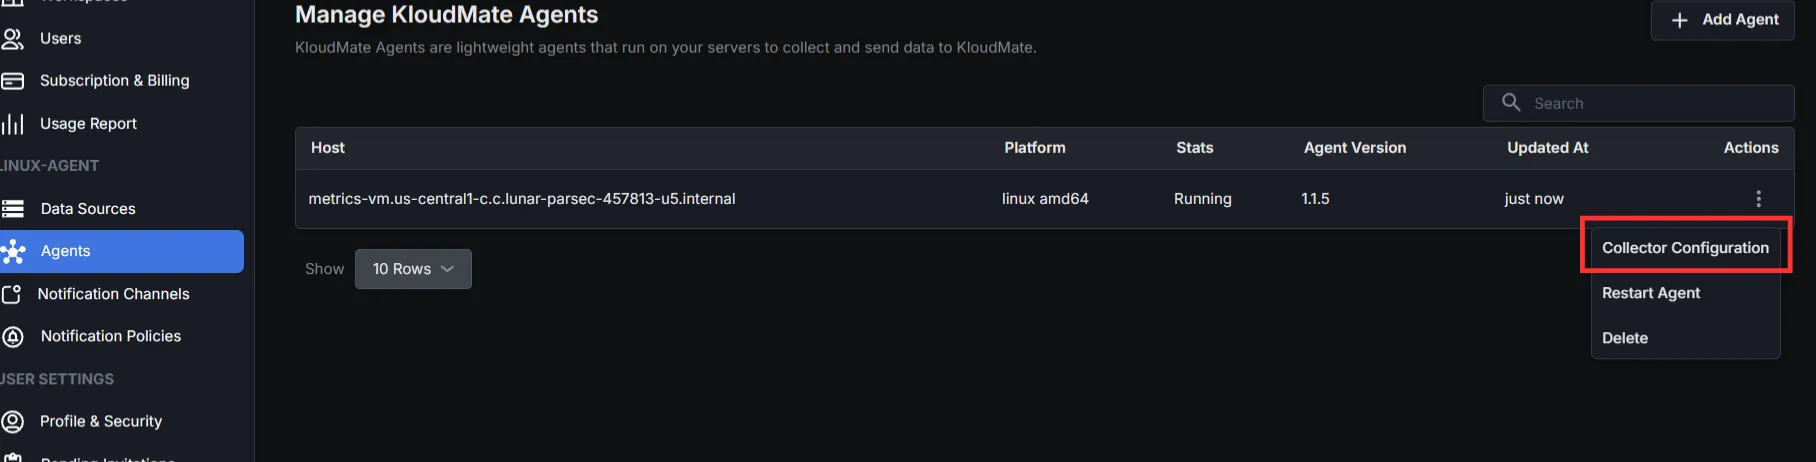
- Go to Settings → Agents
- Select the agent running on the PostgreSQL host
- Click Actions → Collector Configuration
- YAML editor opens for configuration
Step 2: Add Required Extensions and Receivers
Section titled “Step 2: Add Required Extensions and Receivers”Extensions
Receivers
Two receivers are used:
- PostgreSQL Receiver – collects metrics
- File Log Receiver – collects logs (general, error, slow queries)
If you only need metrics, configure only the PostgreSQL receiver.
Step 3: Configure Processors
Section titled “Step 3: Configure Processors”Set up the processor component to identify resource information from the host and either append or replace the resource values in the telemetry data with this information.
Choose one configuration based on where PostgresSQL is running.
- Server (On-premise / Non-cloud / Cloud)
- AWS EC2:
(Optional) To collect EC2 tags, attach an IAM role with EC2:DescribeTags permission.
- Azure Virtual Machines:
Step 4: Configure Exporter and Pipelines
Section titled “Step 4: Configure Exporter and Pipelines”Configure the KloudMate backend exporter and define pipelines for metrics and logs.
Step 5: Save Configuration and Restart Agent
Section titled “Step 5: Save Configuration and Restart Agent”After updating the configuration, click Save Configuration in the KloudMate UI.

You can also restart the agent from your server’s console.
For Linux:
- Execute the following commands:
These commands restart the KloudMate Agent and display its current status.
For Windows
- Open the Services window
- Press
Win + R, typeservices.msc, and pressOK - Or search for Services from the Start menu
- Press
- Locate the KloudMate Agent service.
- Right-click the service and select Restart.
After restarting the agent, verify that PostgreSQL metrics and logs are visible in the KloudMate dashboard.
Post‑Integration Data Validation
Section titled “Post‑Integration Data Validation”Verify that metrics are flowing into KloudMate using the Explore view.
After the agent restarts:
- Log in to KloudMate
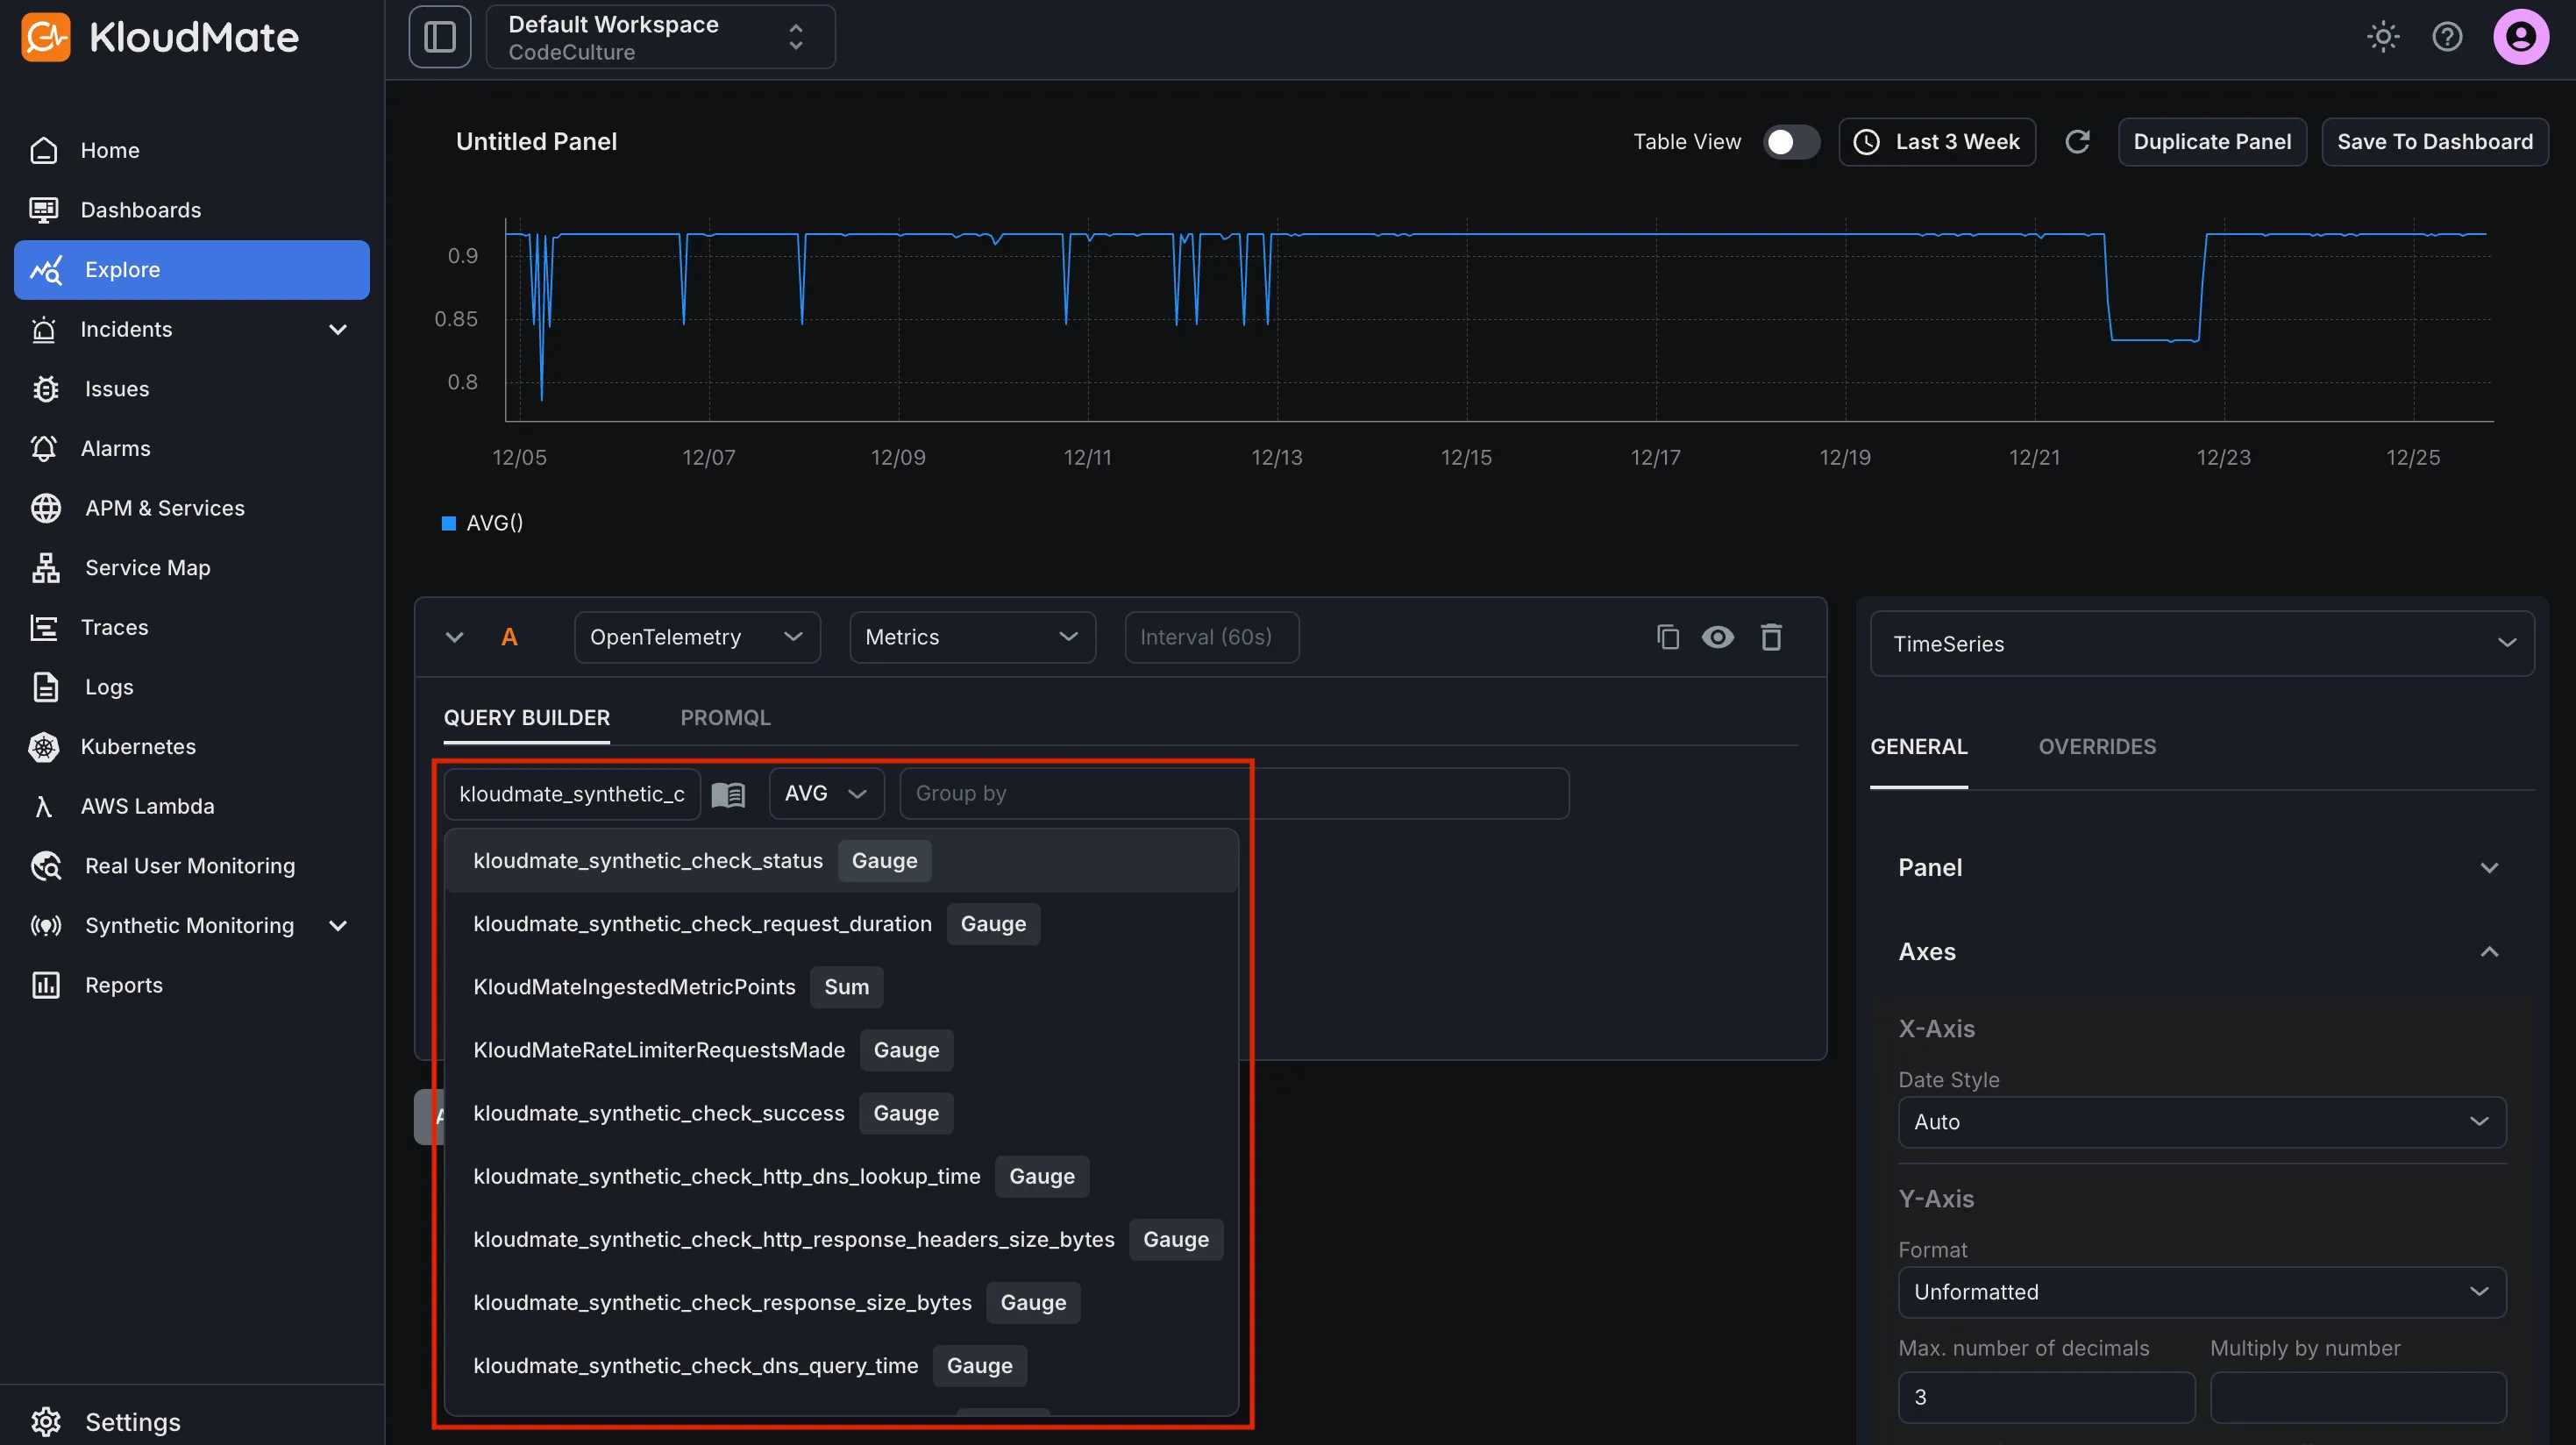
- Navigate to Explore
- Select OpenTelemetry → Metrics
- Choose a PostgreSQL metric and run the query
Seeing time-series data confirms that PostgreSQL telemetry is flowing successfully.
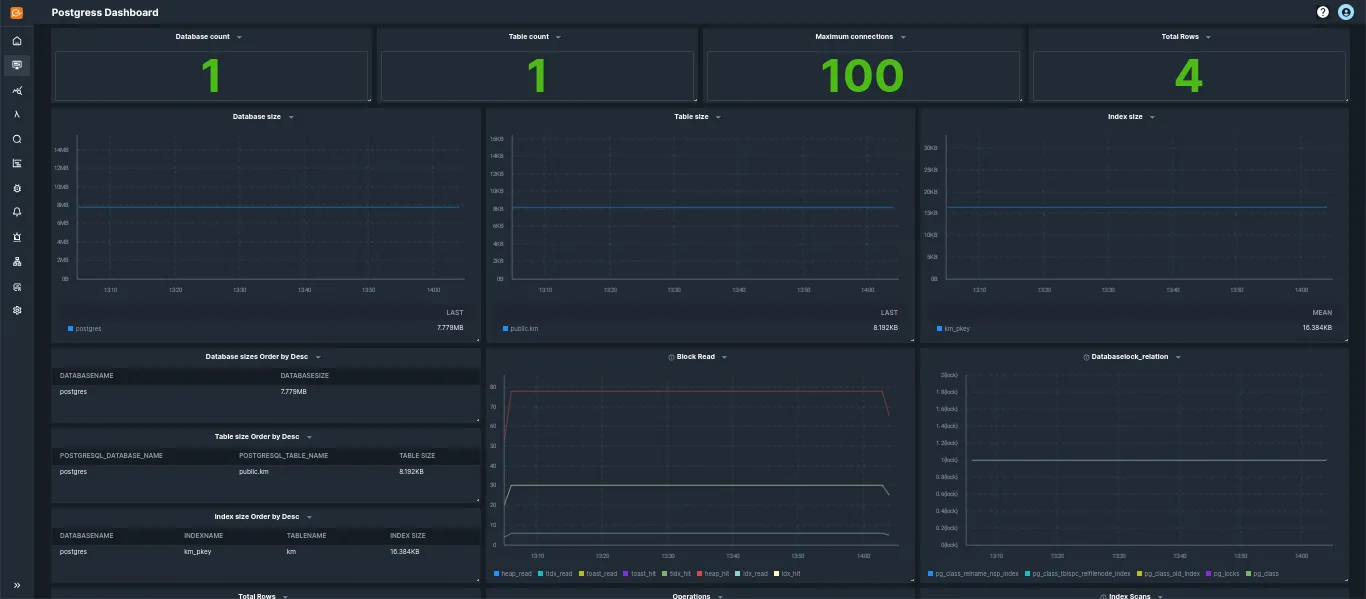
Standard PostgreSQL Dashboards
Section titled “Standard PostgreSQL Dashboards”KloudMate provides prebuilt PostgreSQL dashboards through dashboard templates. These dashboards visualize PostgreSQL database performance, query operations, connections, and resource usage.
To import and start using these templates, follow the steps described in Import from Templates.
Default Metrics for PostgreSQL
Section titled “Default Metrics for PostgreSQL”| Name | Description | Type | Unit |
|---|---|---|---|
| postgresql_backends | The number of backends | SUM | NONE |
| postgresql_connection_max | Configured the maximum number of client connections allowed | GAUGE | NONE |
| postgresql_db_size | The database disk usage | SUM | Bytes |
| postgresql_commits | The number of commits | SUM | NONE |
| postgresql_deadlocks | The number of deadlocks. | SUM | NONE |
| postgresql_database_locks | The number of database locks. | GAUGE | COUNT |
| postgresql_wal_lag | The time between flushing the recent WAL locally and receiving notification that the standby server has completed an operation on it. | GAUGE | seconds |
| postgresql_replication_data_delay | The amount of data delayed in replication | GAUGE | Bytes |
For the complete metrics list, refer to the metrics reference.
For complete observability, ensure PostgreSQL logging is enabled first. See: PostgreSQL Logging: Enable Slow Query Logs & JSON Output (v15+)