MSSQL
Microsoft SQL Server (MSSQL) is a robust relational database management system from Microsoft, renowned for its enterprise-grade performance, high availability features, and advanced analytics capabilities. It powers mission-critical applications, data warehousing, and business intelligence workloads.
MSSQL Monitoring in KloudMate helps you observe the health, performance, and behavior of your Microsoft SQL Server instances by collecting metrics and logs using the KloudMate Agent powered by OpenTelemetry. This enables centralized monitoring of MSSQL instances running on Windows hosts, AWS EC2, Azure Virtual Machines, or on-premise servers.
MSSQL Integration using KloudMate Agents
Section titled “MSSQL Integration using KloudMate Agents”What This Integration Provides
Section titled “What This Integration Provides”With MSSQL Monitoring enabled, KloudMate collects telemetry that provides visibility into:
- Database health and performance metrics
- Lock waits, blocking processes, and transaction behavior
- Buffer pool efficiency and I/O performance
- Transaction log usage and growth patterns
- Resource pool throttling and disk I/O latency
- Server-level resource utilization
This visibility helps identify performance bottlenecks, blocking issues, transaction log problems, buffer pool inefficiencies, and availability concerns.
Prerequisites
Section titled “Prerequisites”- MSSQL Server must be installed and running
- KloudMate Agent installed on the MSSQL host (see Agent Installation for Linux and Windows)
- Run agents as Administrator to collect all Windows Performance Counters
Required Permissions
Section titled “Required Permissions”- Windows Performance Counters Run the KloudMate Agent as Administrator to collect all performance counter-based metrics.
- Direct Database Connection When configured for direct SQL Server connection, the monitoring user must have:
- Database Permissions (at least one of):
•
CREATE DATABASE•ALTER ANY DATABASE•VIEW ANY DATABASE - Server State Permissions:
• SQL Server pre-2022:
VIEW SERVER STATE• SQL Server 2022+:VIEW SERVER PERFORMANCE STATE
Configuration Overview
Section titled “Configuration Overview”Step 1: Configure the KloudMate Agent with
Section titled “Step 1: Configure the KloudMate Agent with”• hostmetrics receiver (system metrics)
• sqlserver receiver (MSSQL performance metrics)
• sqlquery receiver (custom SQL metrics)
• filelog receiver (MSSQL logs)
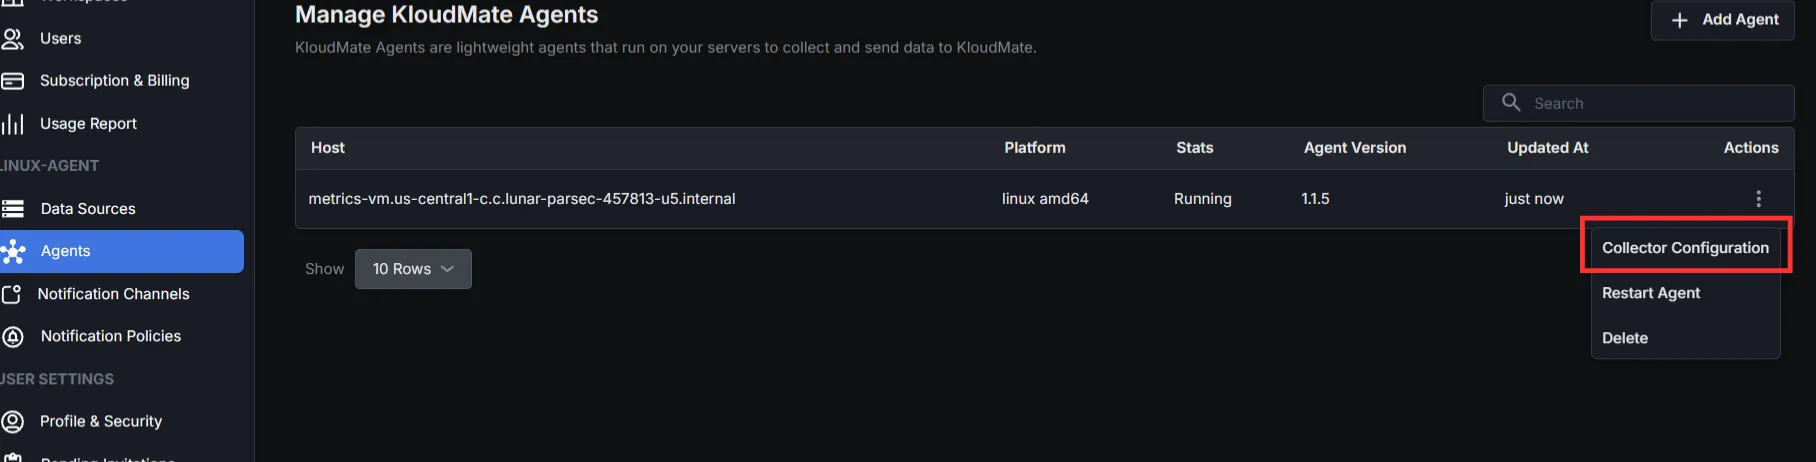
Step 2: Access Agents and OpenTelemetry Collector Configuration
Section titled “Step 2: Access Agents and OpenTelemetry Collector Configuration”- Log in to the KloudMate platform
- Go to Settings → Agents
- Select the agent running on the MSSQL host
- Click Actions → Collector Configuration
- YAML editor opens for configuration
Step 3: Add Required Extensions and Receivers
Section titled “Step 3: Add Required Extensions and Receivers”Step 4: Configure Processors
Section titled “Step 4: Configure Processors”Set up the processor component to identify resource information from the host and either append or replace the resource values in the telemetry data with this information.
Choose one configuration based on where MSSQL is running.
- Server (On-premise / Non-cloud / Cloud)
- AWS EC2:
Optional: To retrieve AWS EC2 instance tags along with logs and metrics, you need to associate an IAM role with the EC2 instance that includes the EC2:DescribeTags policy. The processor below needs to be added:
- Azure Virtual Machines:
Step 5: Configure Exporter and Pipelines
Section titled “Step 5: Configure Exporter and Pipelines”Configure the KloudMate backend exporter and define pipelines for metrics and logs.
Step 6: Save Configuration and Restart Agent
Section titled “Step 6: Save Configuration and Restart Agent”After updating the configuration, click Save Configuration in the KloudMate UI.

You can also restart the agent from your server’s console.
For Linux:
- Execute the following commands:
These commands restart the KloudMate Agent and display its current status.
For Windows
- Open the Services window
- Press
Win + R, typeservices.msc, and pressOK - Or search for Services from the Start menu
- Press
- Locate the KloudMate Agent service.
- Right-click the service and select Restart.
After restarting the agent, verify that MSSQL metrics and logs are visible in the KloudMate dashboard.
Post‑Integration Data Validation
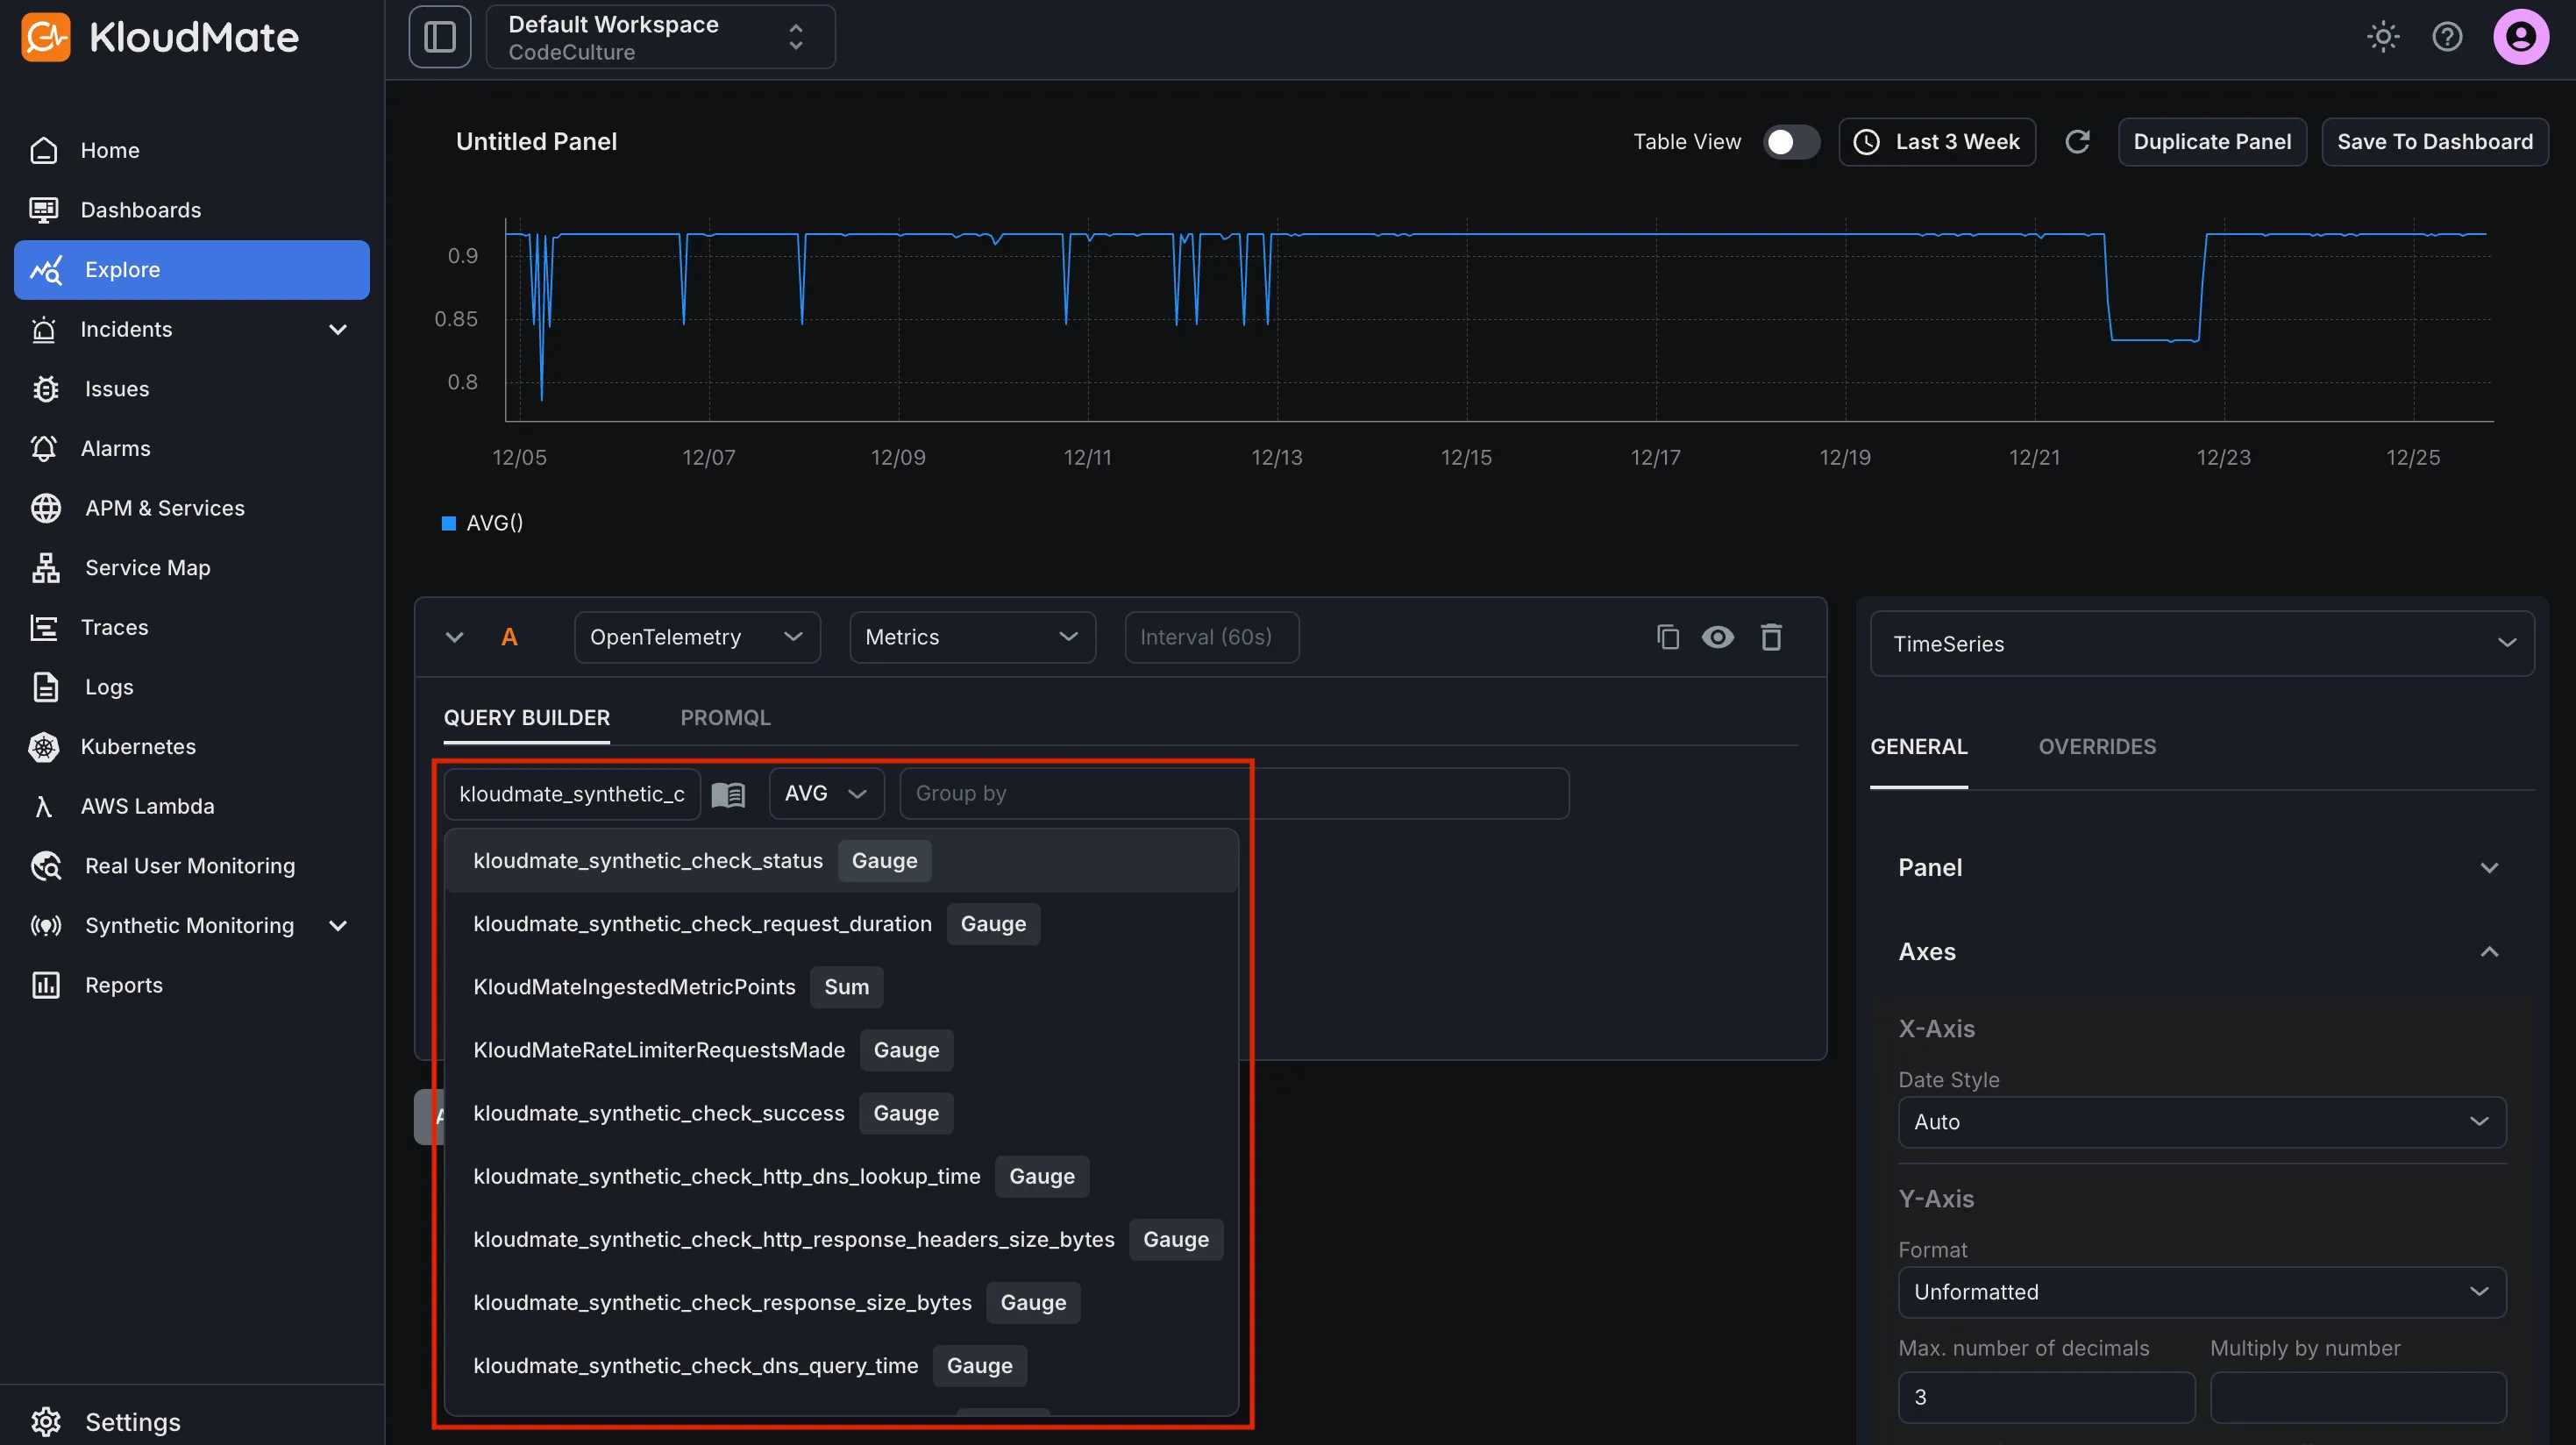
Section titled “Post‑Integration Data Validation”Verify that metrics are flowing into KloudMate using the Explore view.
After the agent restarts:
- Log in to KloudMate
- Navigate to Explore
- Select OpenTelemetry → Metrics
- Choose a MSSQL metric and run the query
Seeing time-series data confirms that MSSQL telemetry is flowing successfully.
Standard MSSQL Dashboards
Section titled “Standard MSSQL Dashboards”KloudMate provides prebuilt MSSQL dashboards through dashboard templates. These dashboards visualize MSSQL database performance, query operations, connections, and resource usage.
To import and start using these templates, follow the steps described in Import from Templates.
Default Metrics
Section titled “Default Metrics”| Metrics | Description | Type | Unit |
|---|---|---|---|
| sqlserver_user_connection_count | Number of users connected to the SQL Server. | Gauge | number |
| sqlserver_lock_wait_time_avg | Average wait time for all lock requests that had to wait. | Gauge | milliseconds |
| sqlserver_lock_wait_rate | Number of lock requests resulting in a wait. | Gauge | number |
| sqlserver_batch_request_rate | Number of batch requests received by SQL Server. | Gauge | number |
| sqlserver_batch_sql_compilation_rate | Number of SQL compilations needed. | Gauge | number |
| sqlserver_batch_sql_recompilation_rate | Number of SQL recompilations needed. | Gauge | number |
| sqlserver_page_buffer_cache_hit_ratio | Pages found in the buffer pool without having to read from disk. | Gauge | number |
| sqlserver_page_life_expectancy | Time a page will stay in the buffer pool. | Gauge | seconds |
| sqlserver_page_split_rate | Number of pages split as a result of overflowing index pages. | Gauge | number |
| sqlserver_page_lazy_write_rate | Number of lazy writes moving dirty pages to disk. | Gauge | number |
| sqlserver_page_checkpoint_flush_rate | Number of pages flushed by operations requiring dirty pages to be flushed. | Gauge | number |
| sqlserver_page_operation_rate | Number of physical database page operations issued. | Gauge | number |
| sqlserver_transaction_log_growth_count | Total number of transaction log expansions for a database. | Sum | number |
| sqlserver_transaction_log_shrink_count | Total number of transaction logs shrinks for a database. | Sum | number |
| sqlserver_transaction_log_usage | Percent of transaction log space used. | Gauge | number |
| sqlserver_transaction_log_flush_wait_rate | Number of commits waiting for a transaction log flush. | Gauge | number |
| sqlserver_transaction_log_flush_rate | Number of log flushes. | Gauge | number |
| sqlserver_transaction_log_flush_data_rate | Total number of log bytes flushed. | Gauge | bytes |
| sqlserver_transaction_rate | Number of transactions started for the database (not including XTP-only transactions). | Gauge | number |
| sqlserver_transaction_write_rate | Number of transactions that were written to the database and committed. | Gauge | number |
| sqlserver_database_latency | Total time that the users waited for I/O issued on this file. | Sum | seconds |
| sqlserver_database_operations | The number of operations issued on the file. | Sum | number |
| sqlserver_database_io | The number of bytes of I/O on this file. | Sum | bytes |
| sqlserver_resource_pool_disk_throttled_read_rate | The number of read operations that were throttled in the last second | Gauge | number |
| sqlserver_resource_pool_disk_throttled_write_rate | The number of write operations that were throttled in the last second | Gauge | number |
| sqlserver_processes_blocked | The number of processes that are currently blocked. | Gauge | number |
| sqlserver_database_count | The number of databases. | Gauge | number |
For the complete metrics list, refer to the metrics reference.