Managing Dashboards
Entering Edit Mode
Section titled “Entering Edit Mode”To make any changes to a dashboard, including editing panels, updating settings, or reorganizing layout, click the Edit icon at the top-right corner of the dashboard. This switches the toolbar to edit mode, showing Settings, Add Panel, Save, and Exit edit.
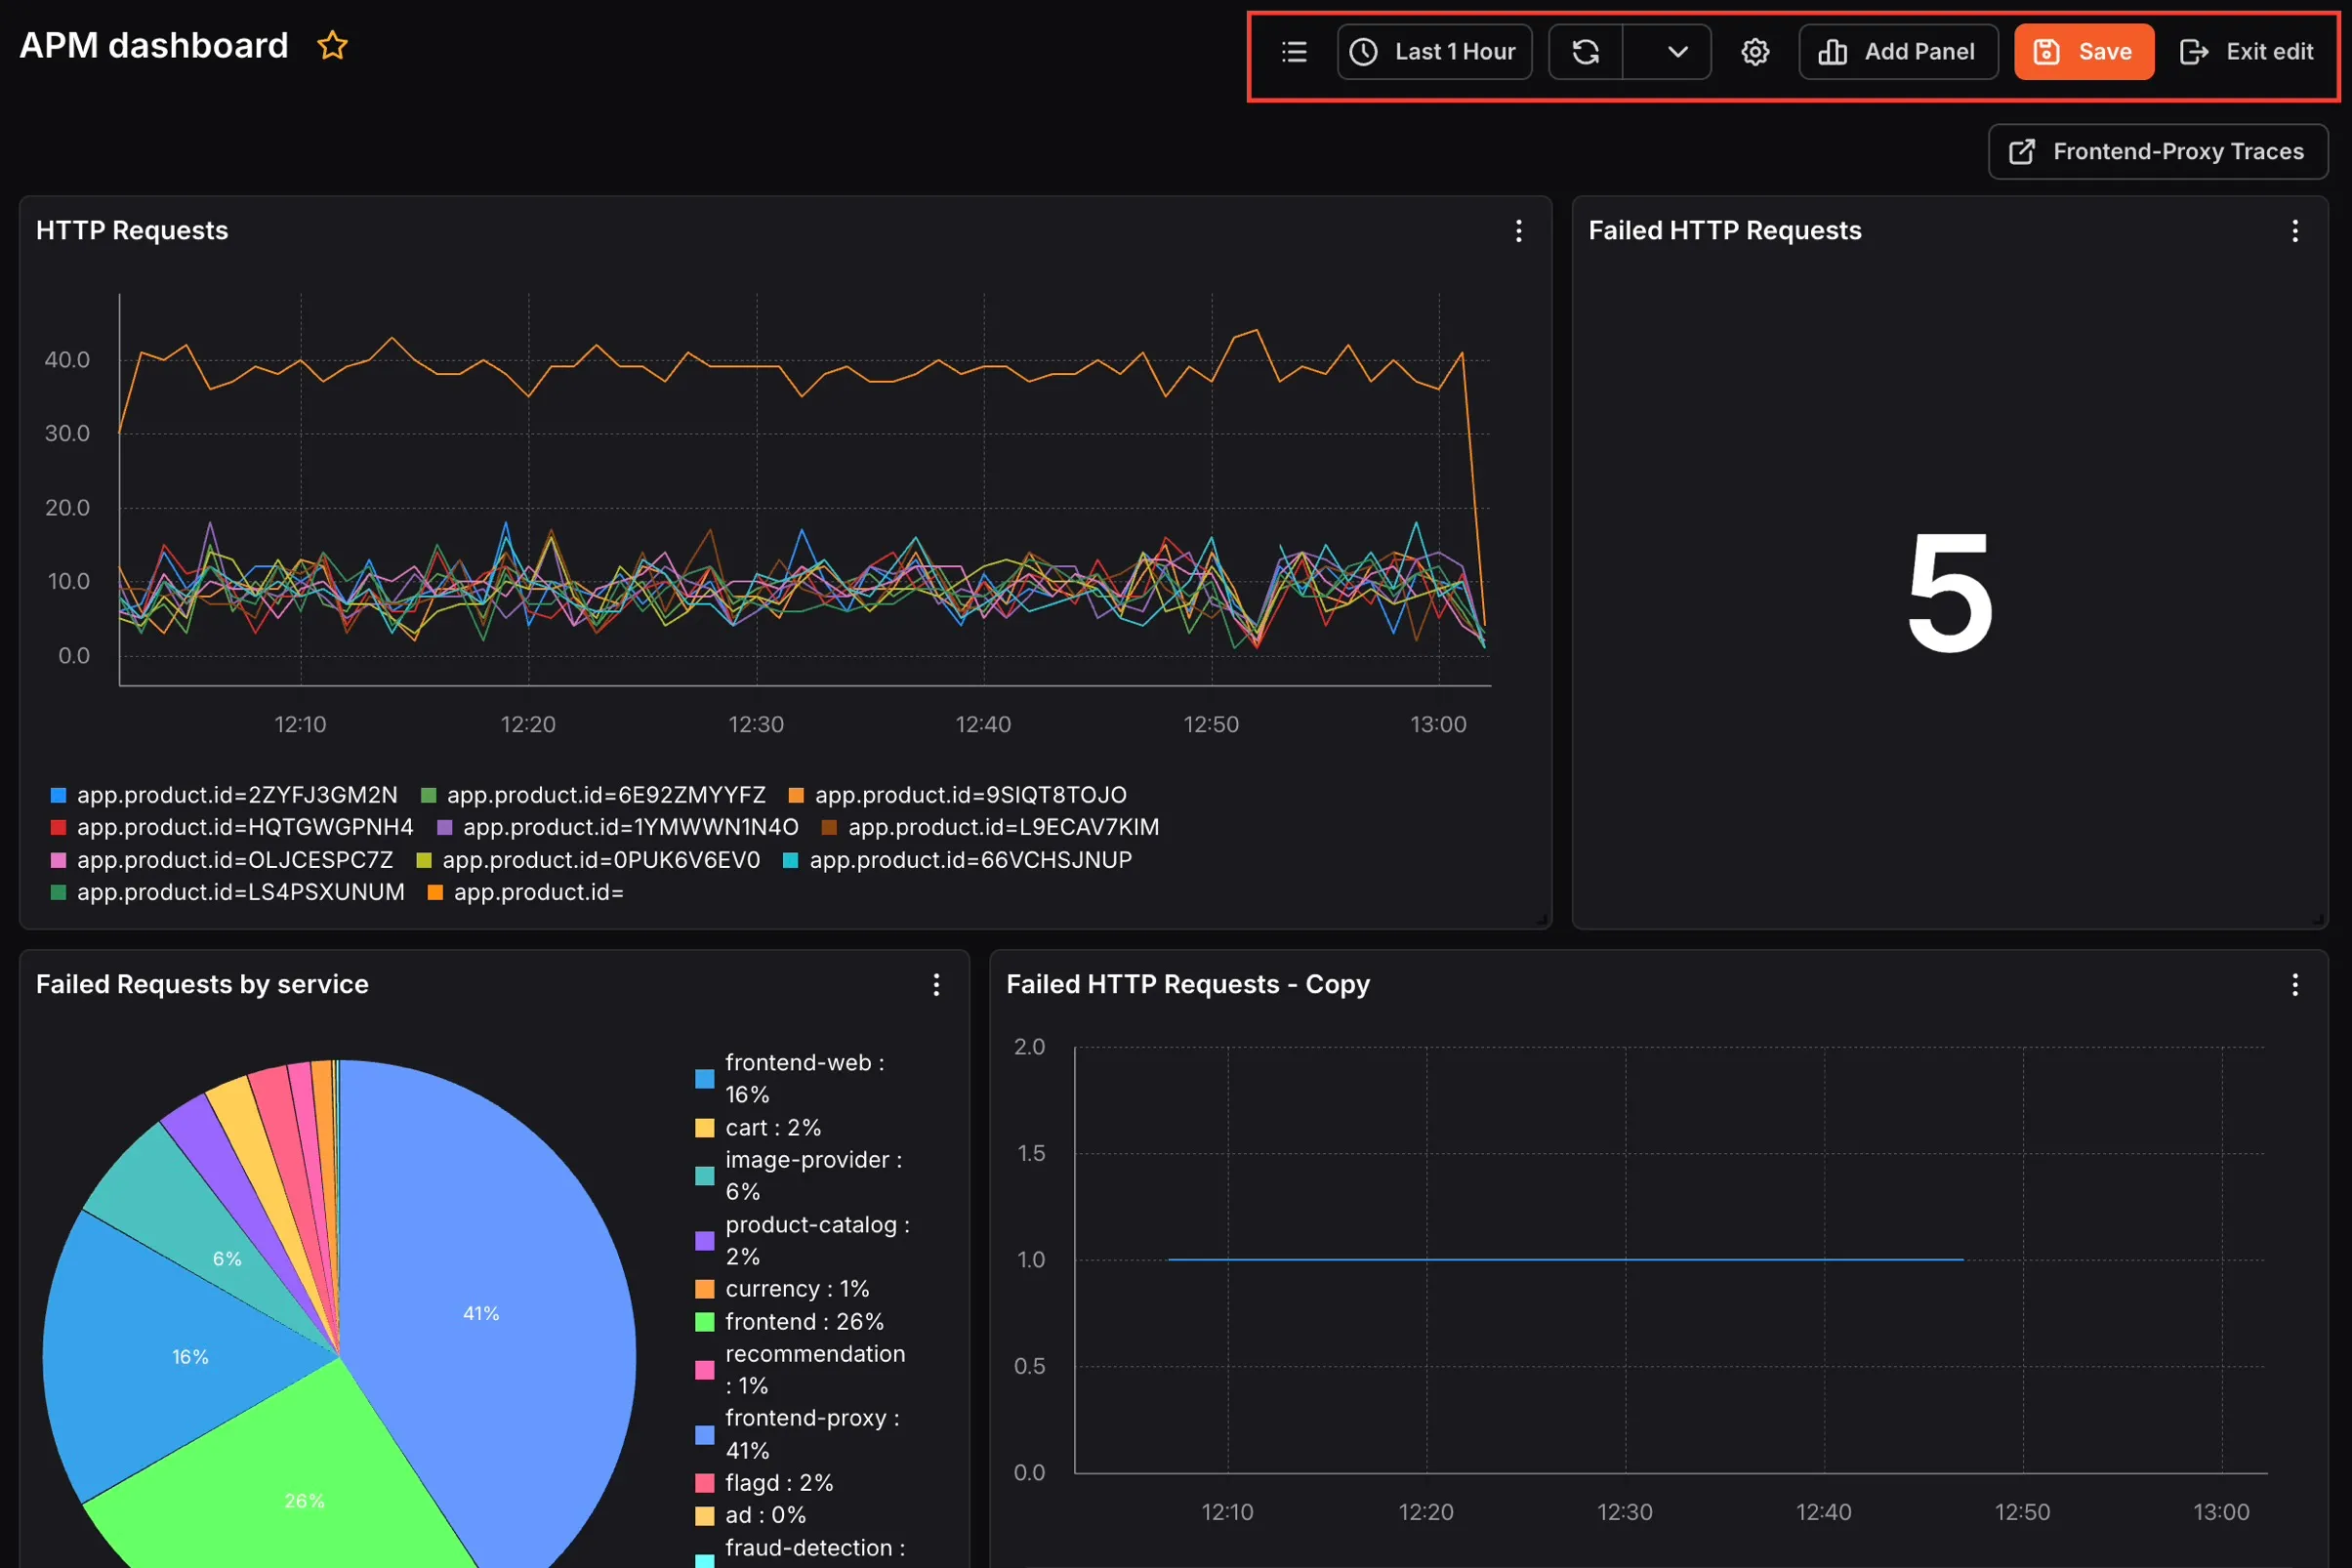
Click Exit edit to return to view mode without saving, or Save to save your changes.
Dashboard Settings
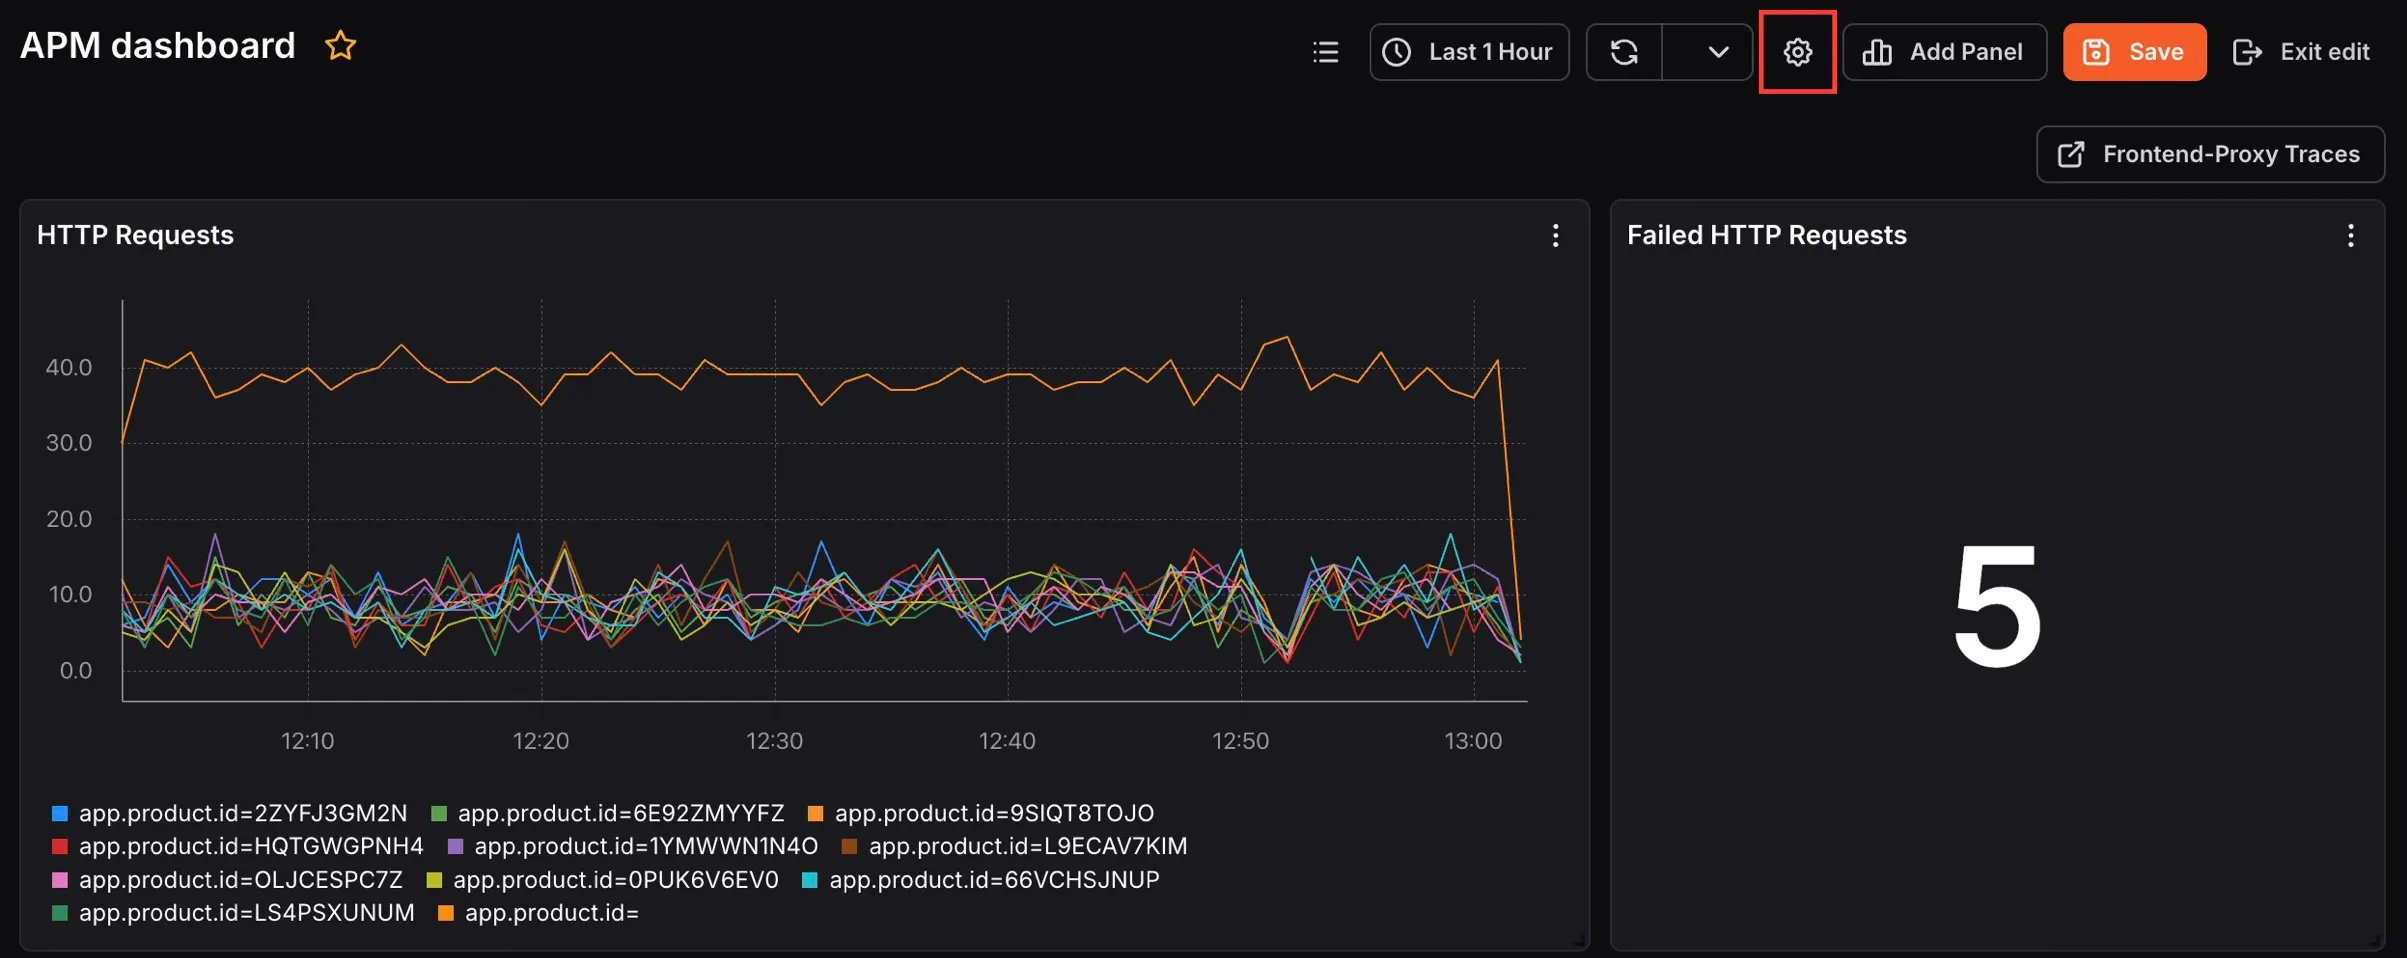
Section titled “Dashboard Settings”Click the Settings icon in the toolbar while in edit mode to open the Dashboard Settings panel. From here you can:
General tab
Section titled “General tab”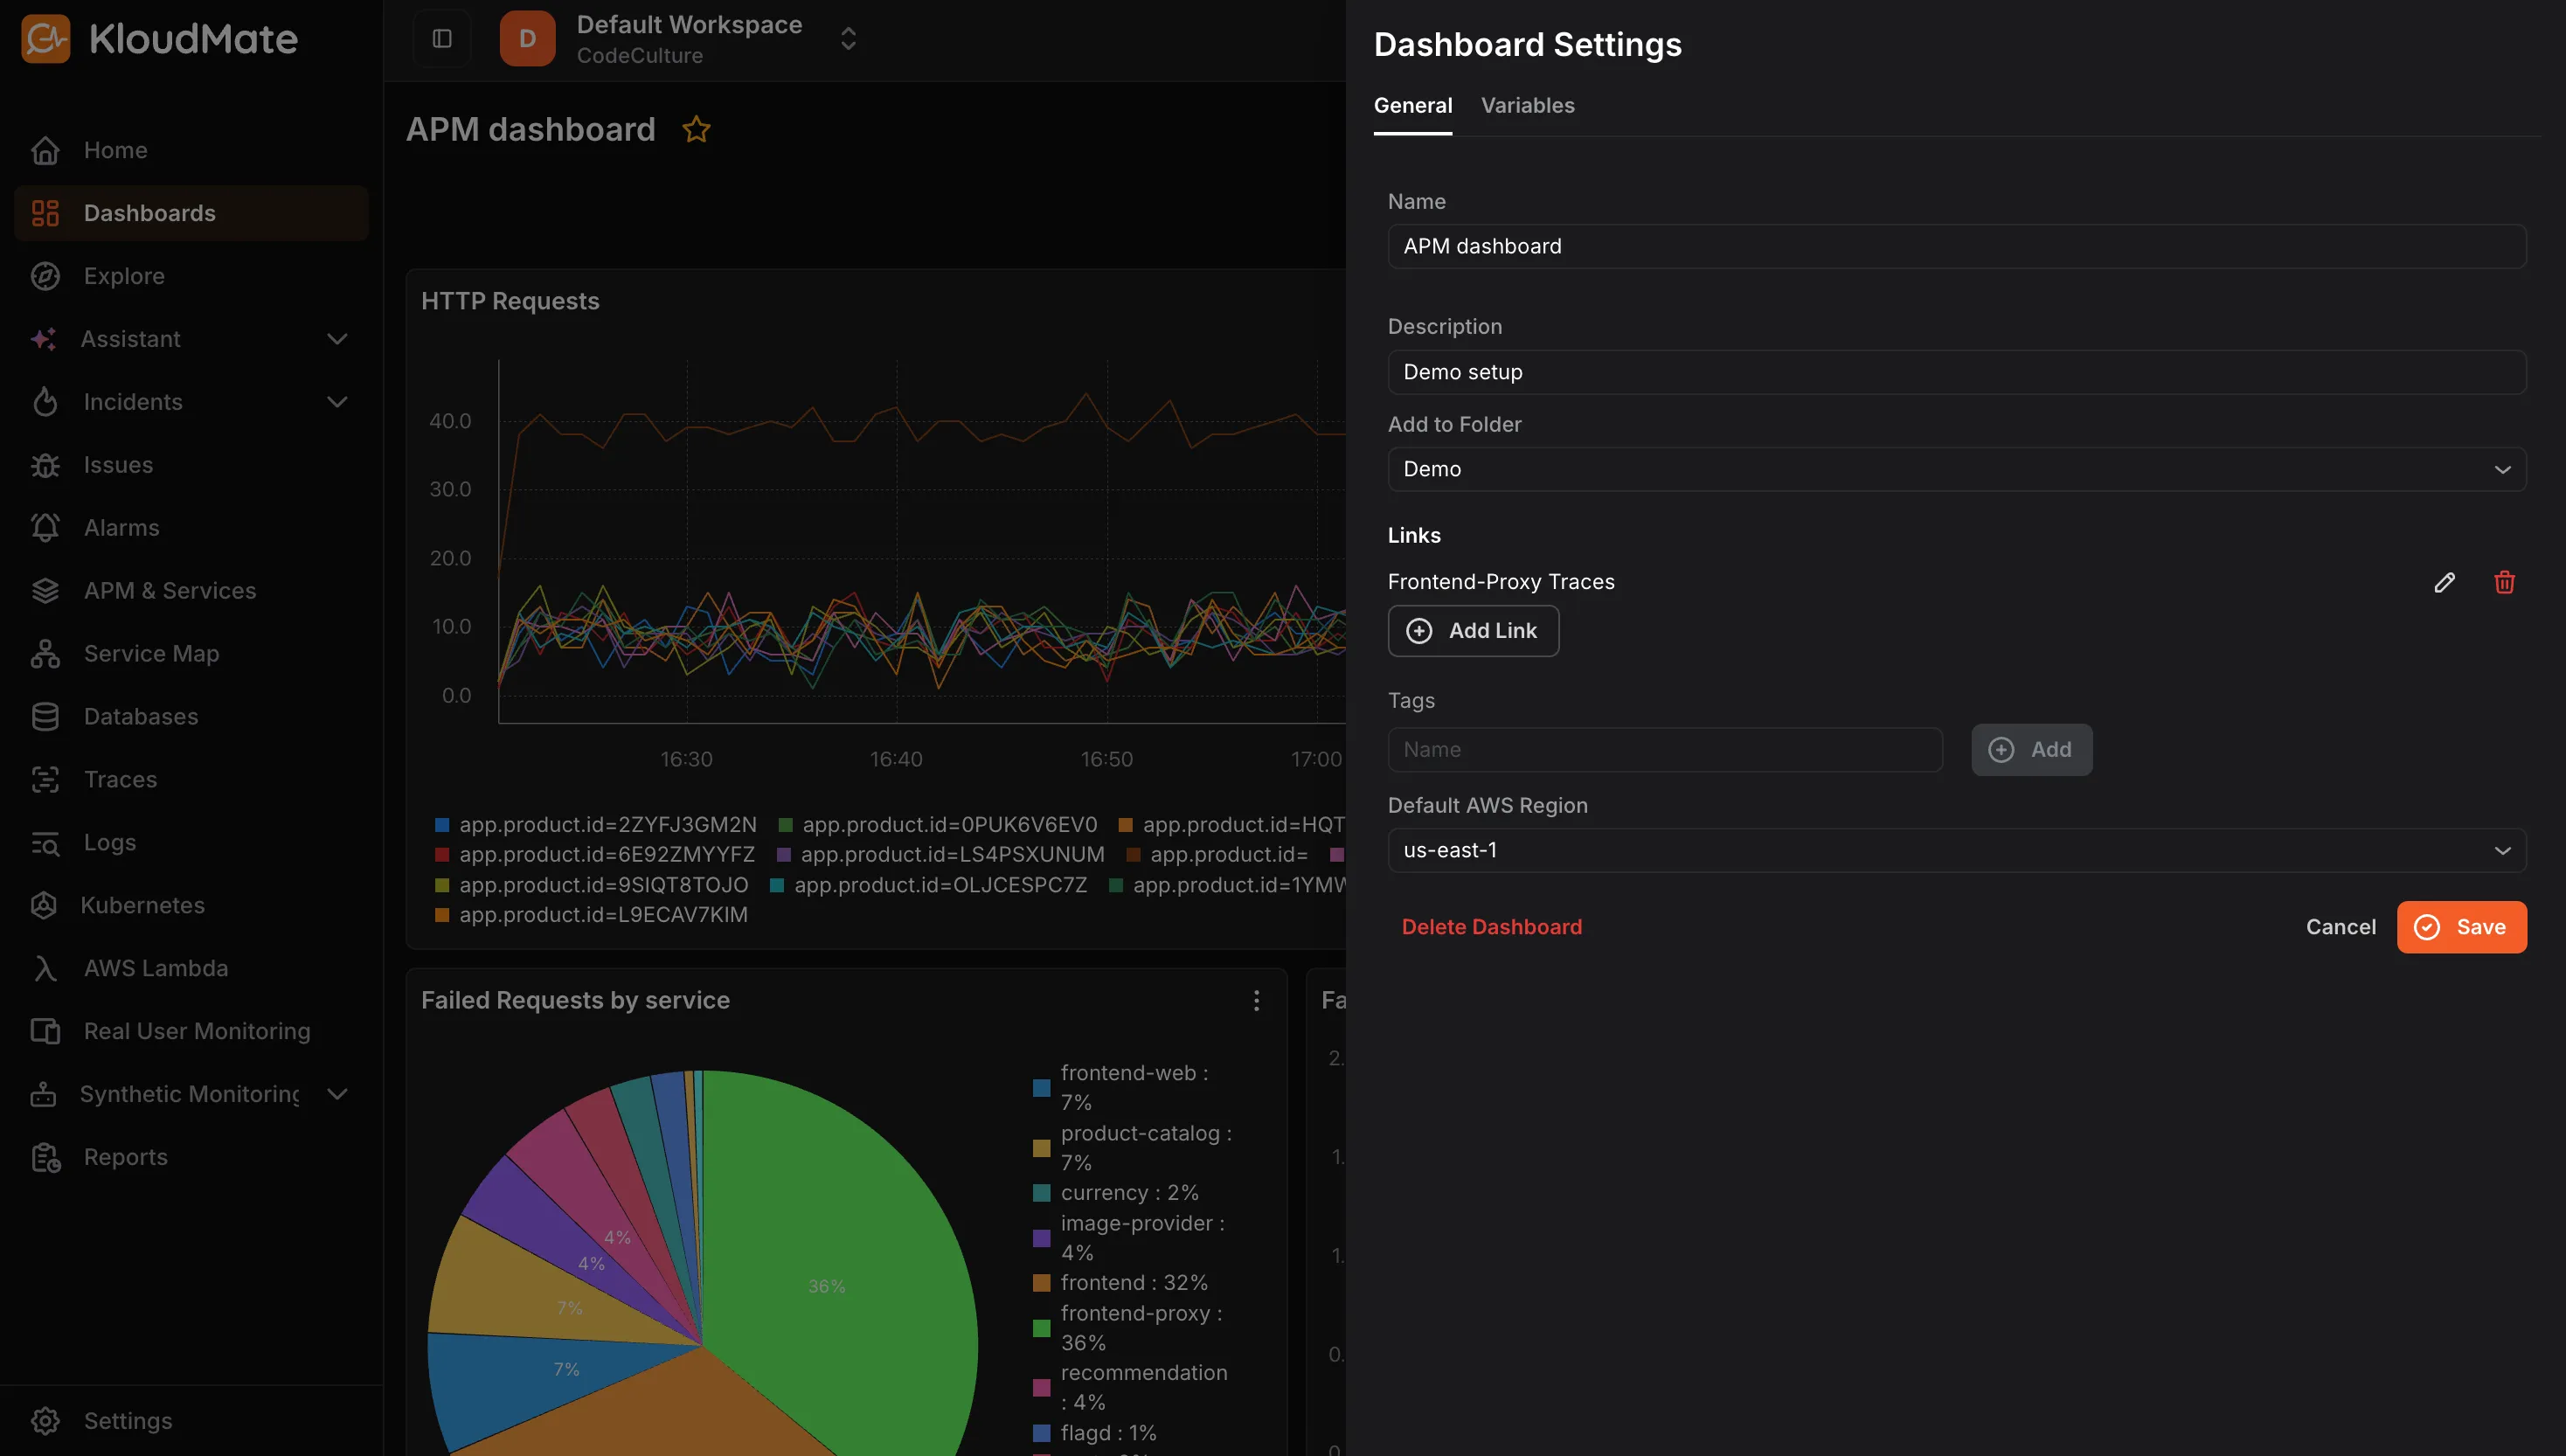
- Name: Update the dashboard name.
- Description: Add or edit a description.
- Add to Folder: Move the dashboard into a folder to keep it organized with related dashboards.
- Links: Add external links that appear as quick-access buttons on the dashboard (e.g., a link to a related service’s traces page). Click Add Link to add one.
- Tags: Add tags to make the dashboard easier to search and categorize.
- Default AWS Region: Set the default AWS region for the dashboard.
- Delete Dashboard: Permanently delete the dashboard.
Click Save to apply changes or Cancel to discard them.
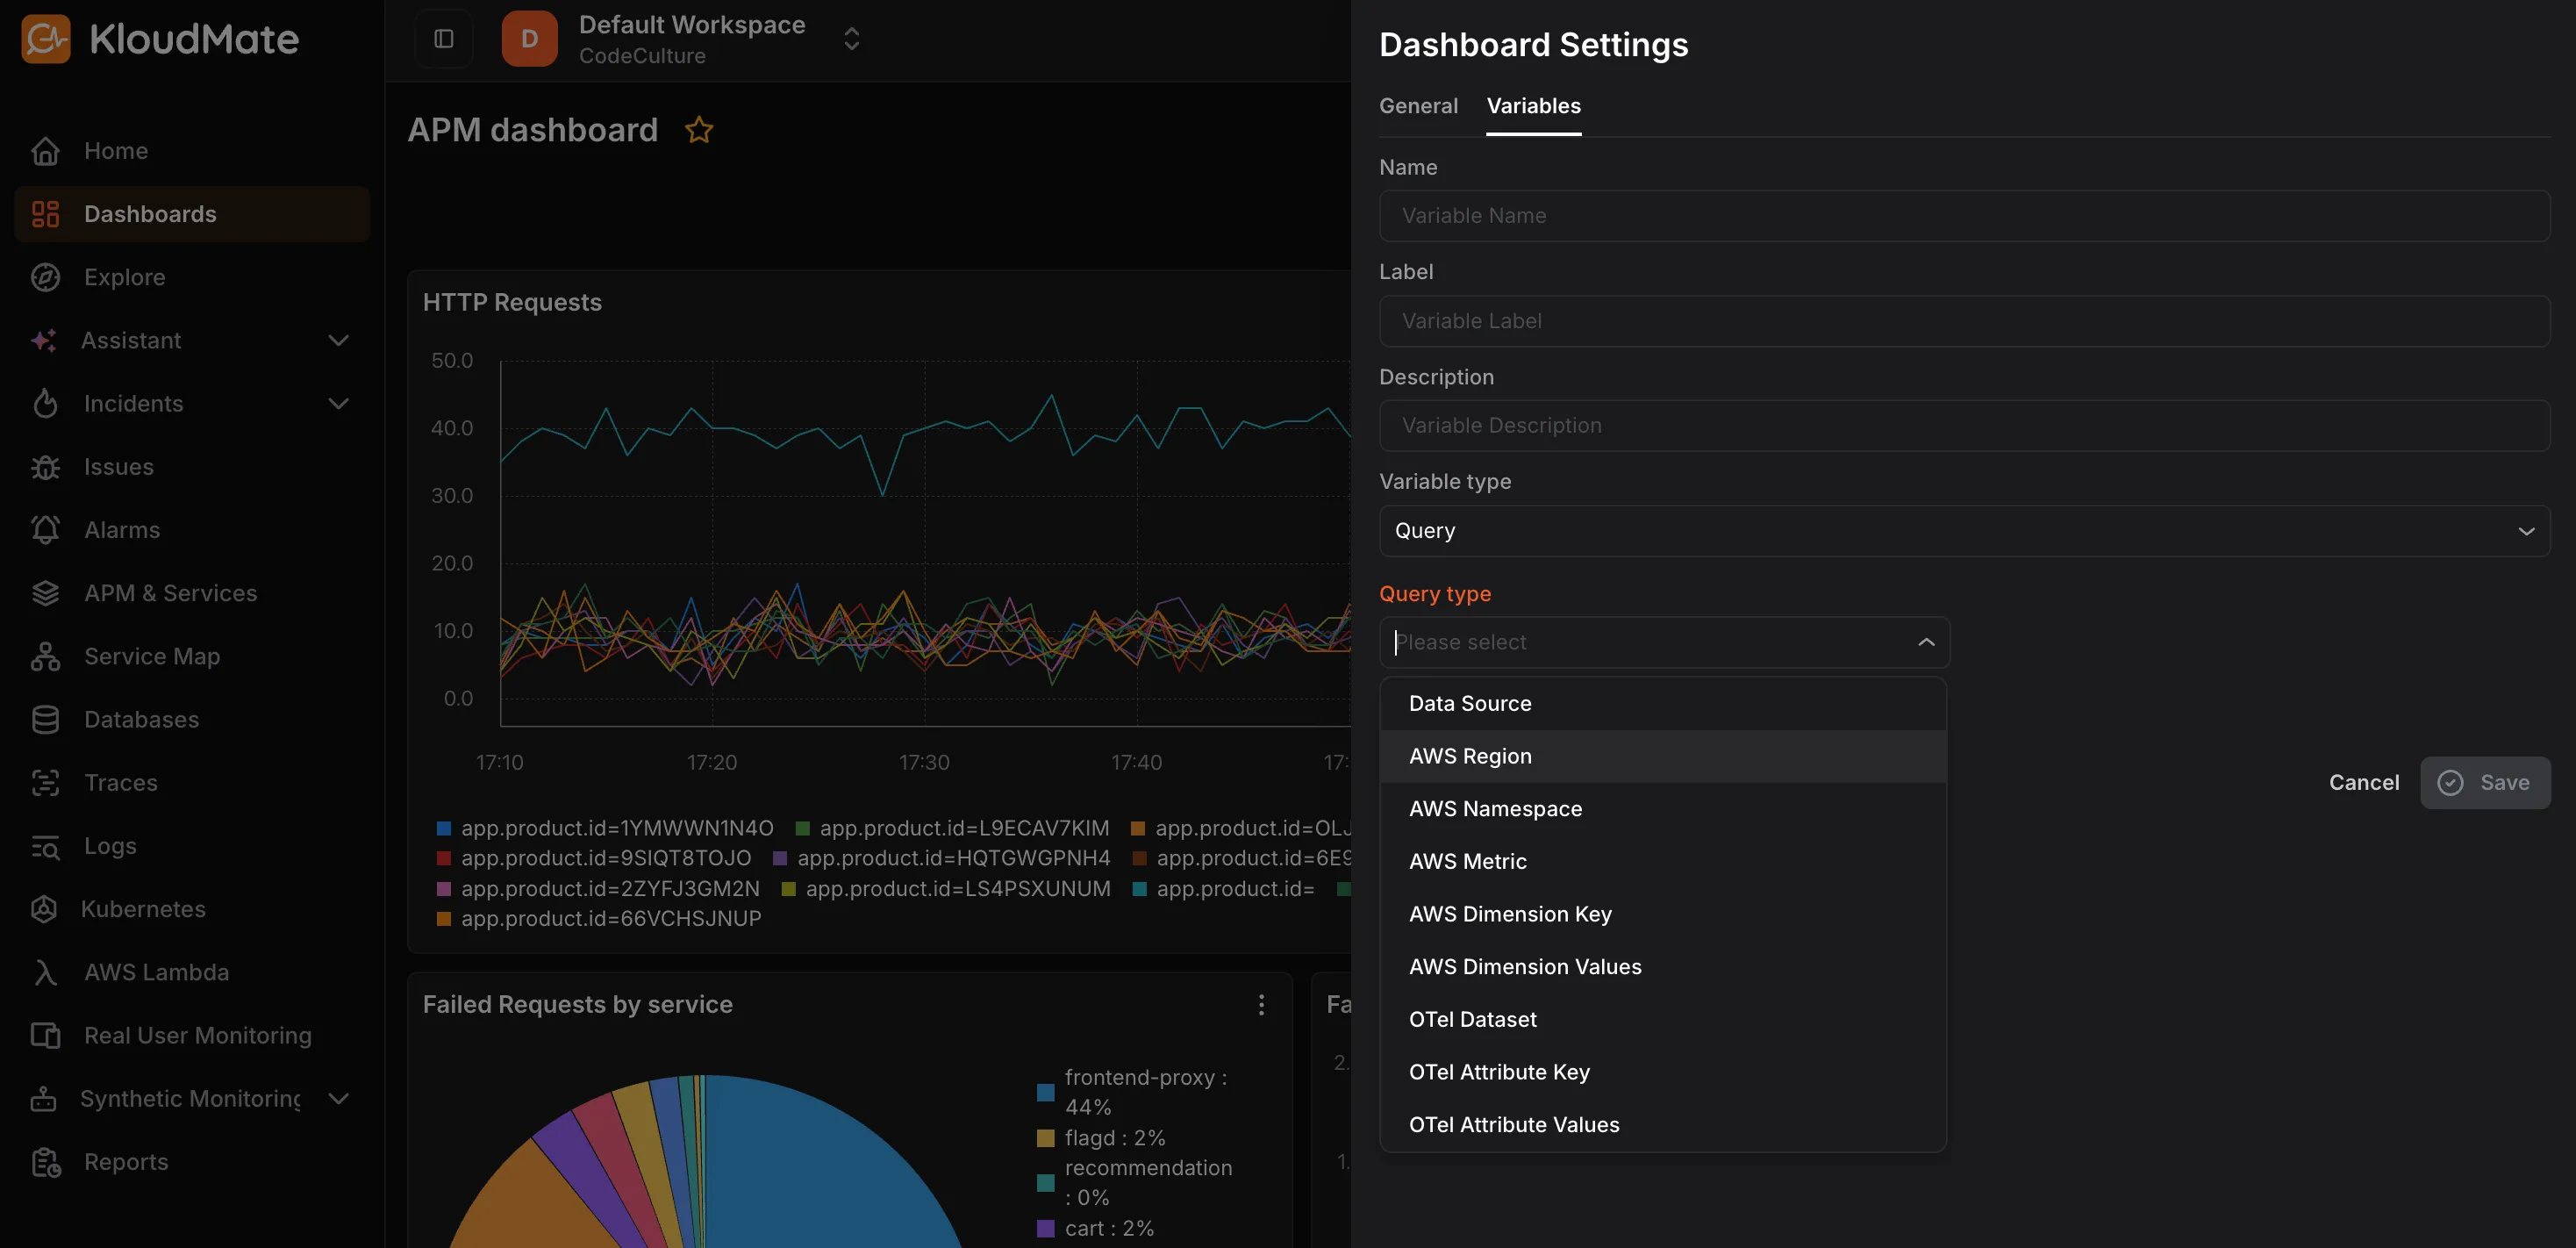
Variables tab
Section titled “Variables tab”You can add and manage variables in your dashboards. Variables are placeholders for values that help you create dynamic dashboards by avoiding hard-coded values within queries.
-
Click the Variables tab in Dashboard Settings.
-
Enter a Name , Label , and Description for the variable.
-
Select the Variable Type:
- Query: Dynamically populates values based on a query. When selected, an additional Query Type dropdown appears. Select the appropriate query type from the available options.
- Constant: Sets a fixed value that remains unchanged across the dashboard.
- Click Save.
Once the variable has been added, you can use it by selecting the created variable in the panel query box and saving the new query.