UDP Monitor
The UDP Monitor checks the availability of a specific UDP host and port by sending UDP packets and optionally reading responses, helping verify that the UDP service is reachable and responsive.
Creating a New UDP Monitor
Section titled “Creating a New UDP Monitor”- Navigate to Synthetic monitoring > Monitors.
- Click Add new.
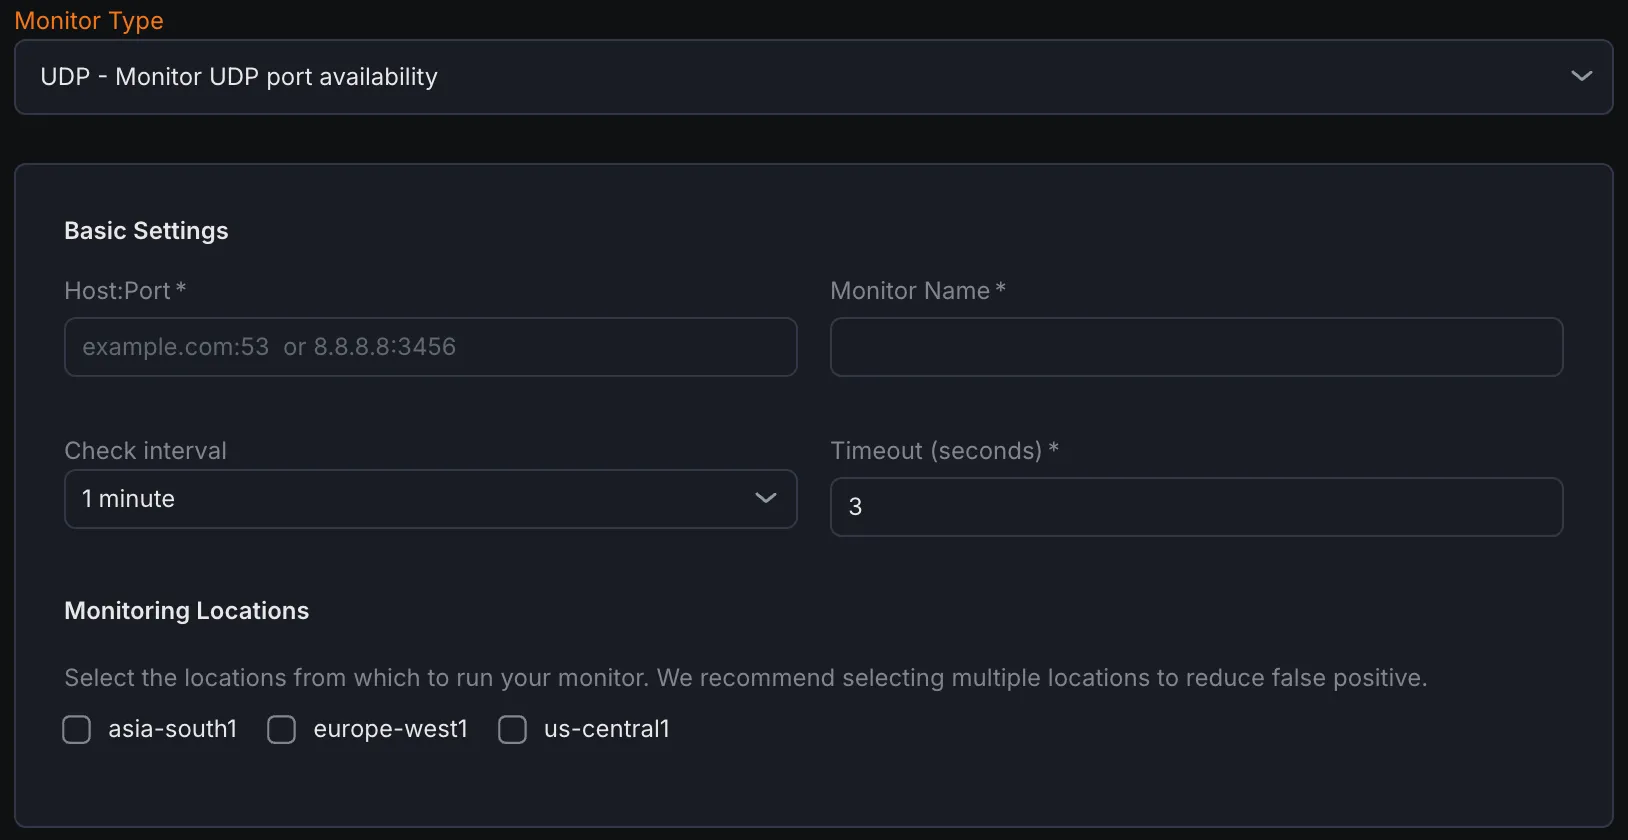
- Select UDP port availability from the monitor type dropdown.
Basic Settings
Section titled “Basic Settings”- Host:Port
Enter the target UDP host and port in the format
hostname:portthat needs to be monitored. - Monitor Name Provide a descriptive name for the UDP monitor.
- Check Interval Set the frequency at which the UDP port will be checked.
- Timeout Define the maximum time the monitor waits for a response before marking the check as failed.
- Monitoring Locations Select one or multiple locations from where the UDP checks will be performed.
Notification Settings
Section titled “Notification Settings”Choose notification channels where alerts will be sent if the UDP monitor detects downtime or failure.
UDP Configuration
Section titled “UDP Configuration”- Send Payload (optional) Specify the data (bytes or text) that will be sent to the UDP port as a probe.
- Read Size (Bytes) Define how many bytes the monitor should read from the UDP server in response after sending the payload.
- Read Timeout (ms) Set the maximum time (in milliseconds) the monitor will wait for a response from the target after sending the payload.
Assertions
Section titled “Assertions”Assertions define what aspects of UDP port availability and response are checked:
- Connect Time (ms) Measures the duration from sending the UDP packet to receiving a response or timeout.
- Time to First Byte (ms) Tracks the time from packet transmission until the first byte of response data arrives.
- Total Time (ms) Captures the complete duration from the initial UDP packet send through the full response exchange.
- Response Data Validates the actual data returned by the UDP server after sending the optional payload.
Metrics
Section titled “Metrics”Metrics available to be monitored in Dashboard section
| Metric Name | Type | Description | Labels |
|---|---|---|---|
| kloudmate_synthetic_check_network_write_time | Gauge | Time taken to write to the connection (for TCP and UDP) | check_id, check_name, check_type, target, workspace_id, location |
| _kloudmate_synthetic_chec_network_read_time | Gauge | Time taken to read from the connection (for TCP and UDP) | check_id, check_name, check_type, target, workspace_id, location |
| kloudmate_synthetic_check_connect_time | Gauge | Time taken to establish a connection. Applicable to HTTP, TCP, UDP, WebSocket, and SSL checks. | check_id, check_name, check_type, target, workspace_id, location |
|---|---|---|---|
| _kloudmate_synthetic_check_time_to_first_byte | Gauge | Time to the first byte. Applicable to HTTP, TCP, and UDP checks. | check_id, check_name, check_type, target, workspace_id, location |
| kloudmate_synthetic_check_response_size_bytes | Gauge | The size of the response in bytes. Applicable to HTTP, TCP, and UDP checks. | check_id, check_name, check_type, target, workspace_id, location |