

Creating Alarms
KloudMate lets users create and configure alarms for events that are critical to their application. By setting up alarms, users can monitor when certain metrics cross pre-defined thresholds and take necessary actions promptly.
Getting Started
Section titled “Getting Started”Navigate to the Alarms section from the left navigation menu.
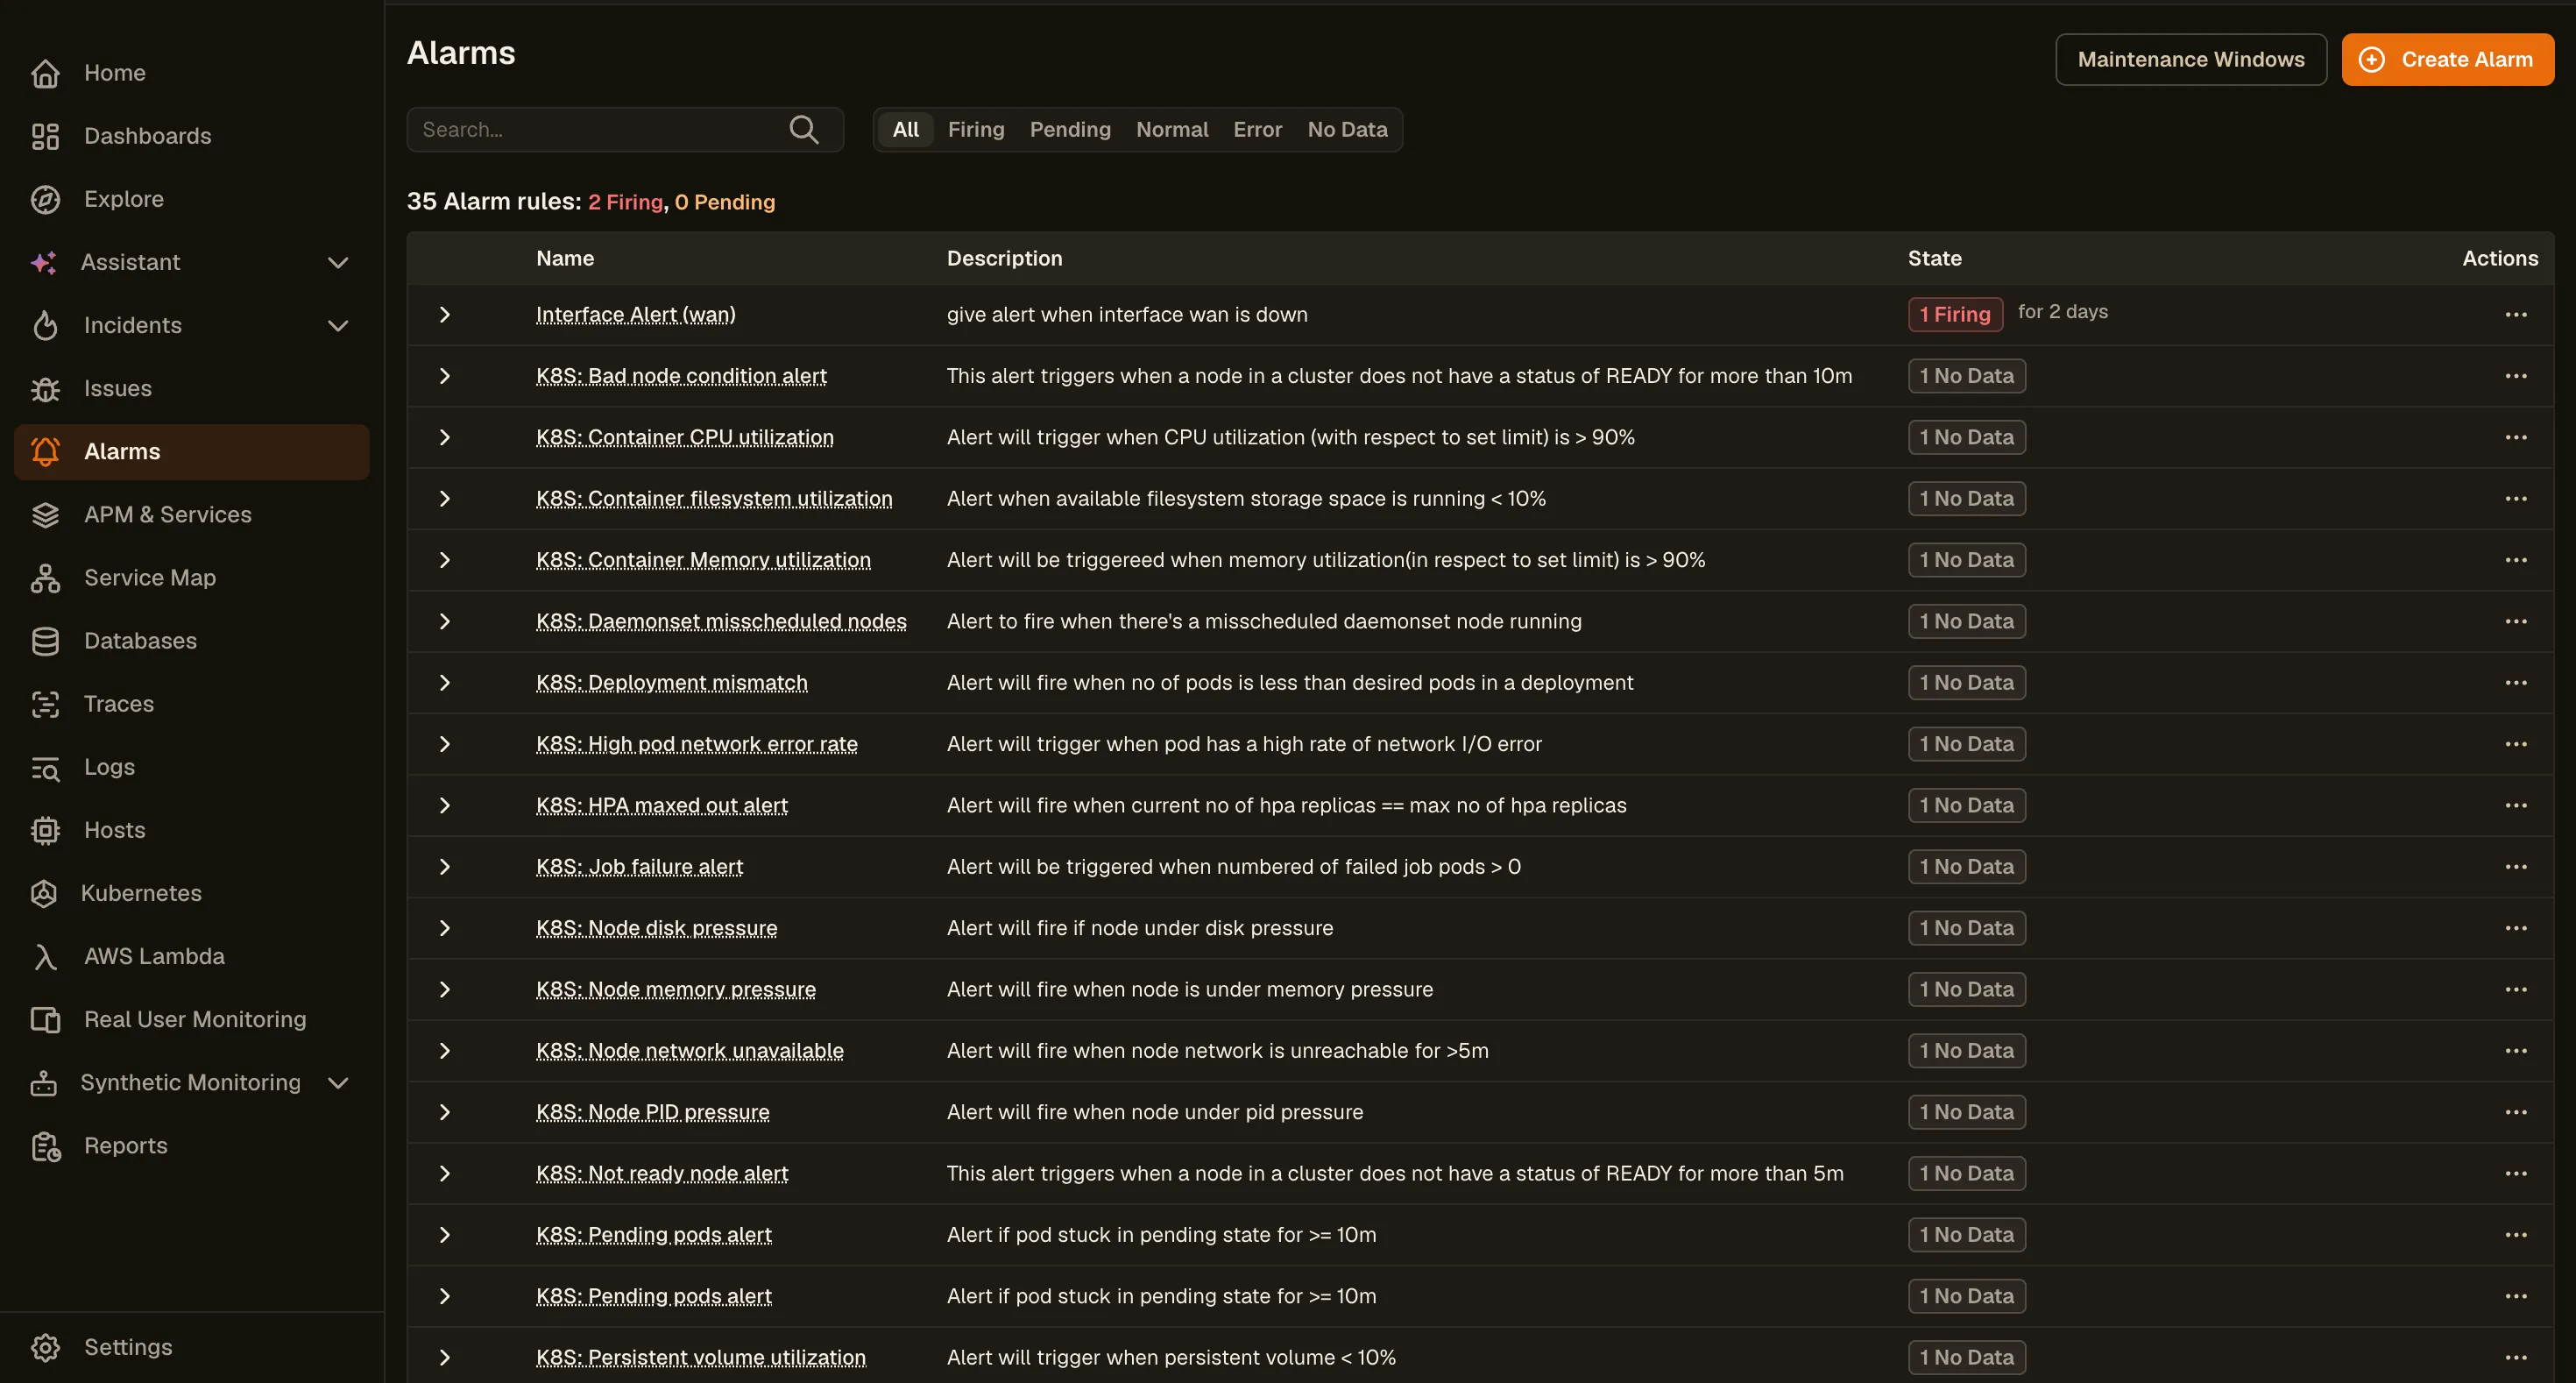
The Alarms screen displays a list of all existing alarms along with their current state, name, and description. The summary at the top shows the total number of alarm rules, including how many are currently Firing or Pending.
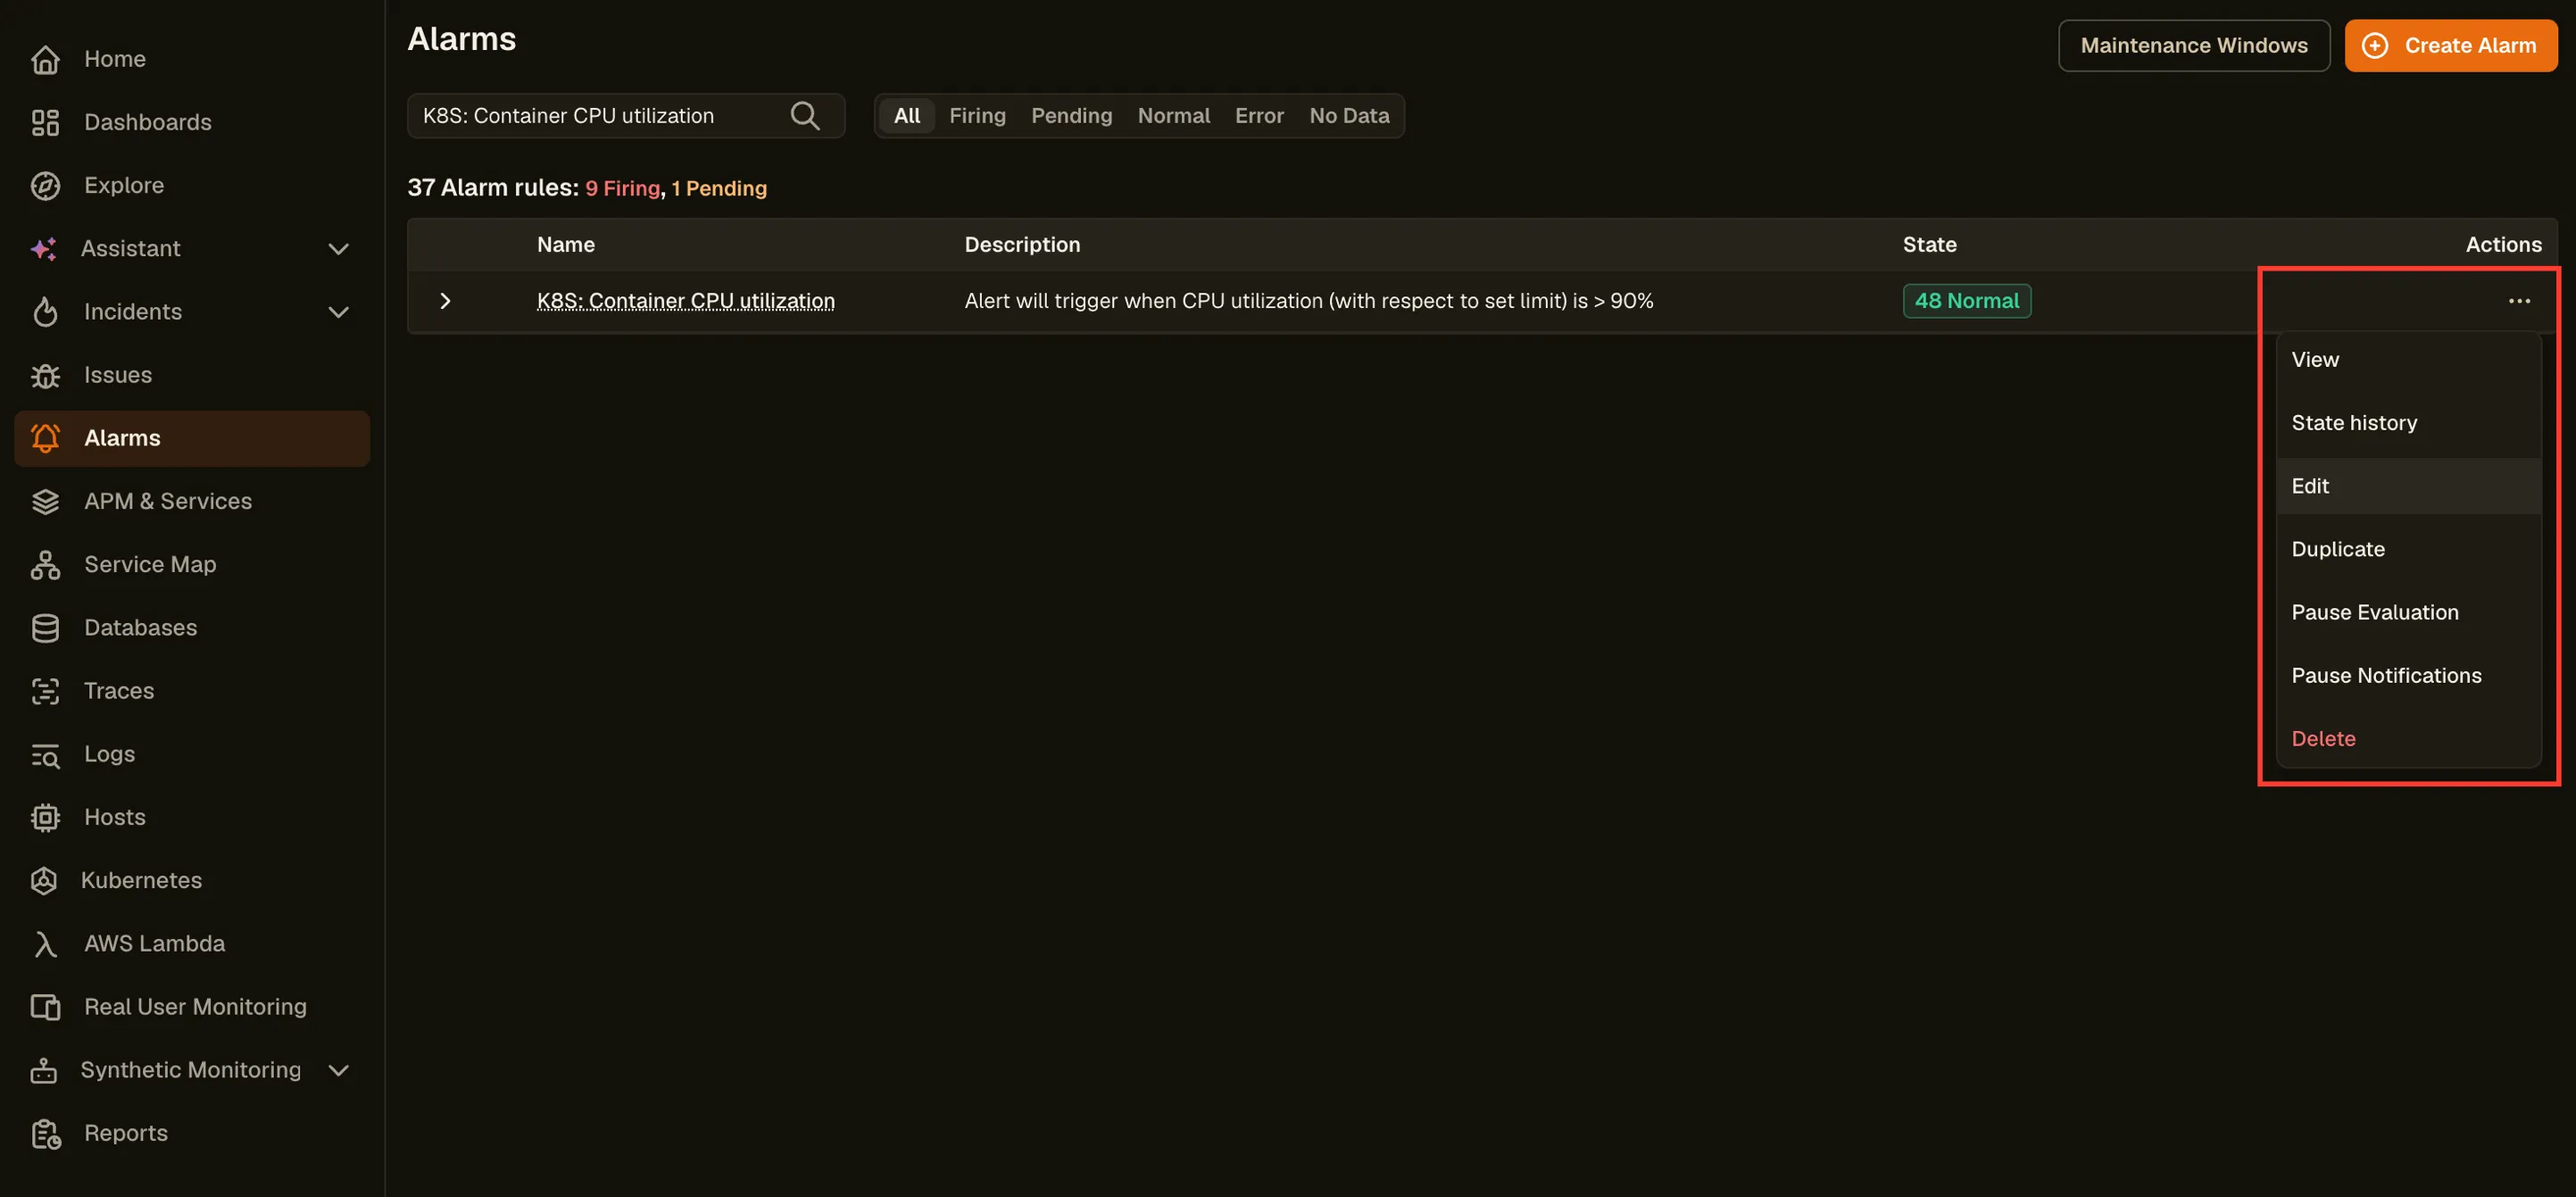
From the more options (⋯) icon on any alarm, you can:
- View the alarm details
- View State History for the alarm
- Edit the alarm configuration
- Duplicate the alarm
- Pause Evaluation or Pause Notifications
- Delete the alarm
To learn about the key concepts of KloudMate Alarms, see the Alarms Overview.
Creating a New Alarm
Section titled “Creating a New Alarm”Click the Create Alarm button at the top-right corner of the Alarms screen. A dialog appears with three ways to create an alarm:
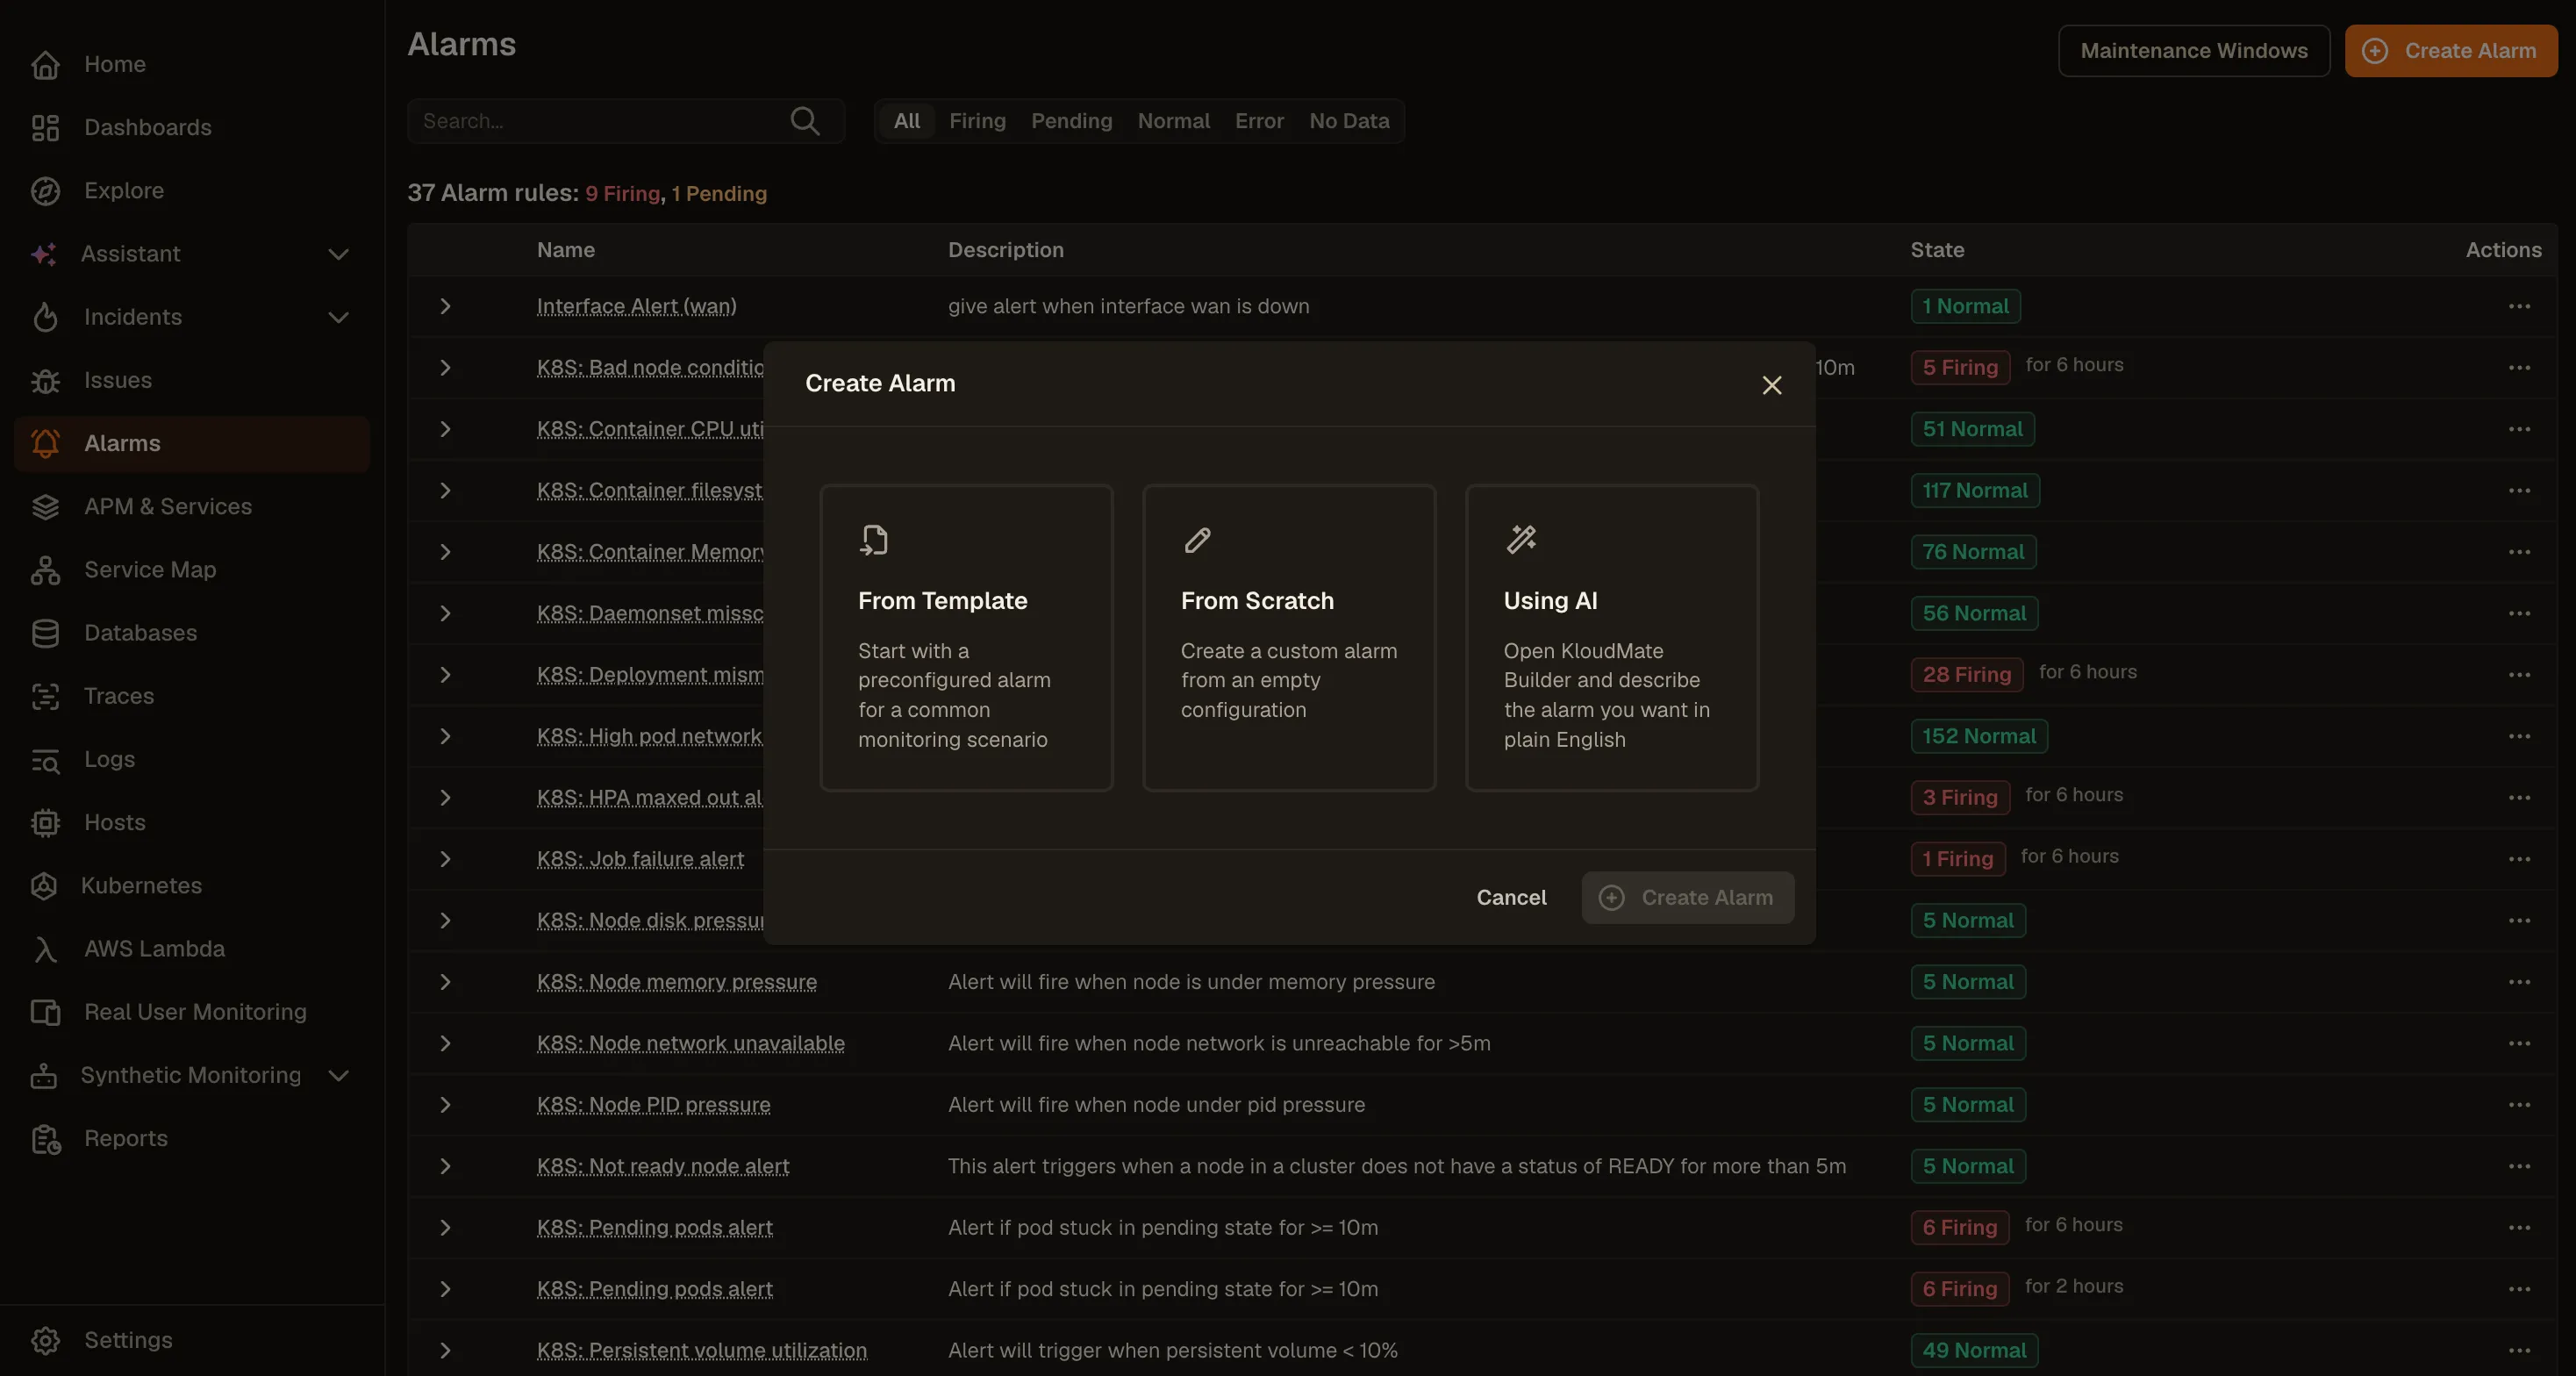
- From Template: Start with a pre-configured alarm for a common monitoring scenario.
- From Scratch: Create a custom alarm from an empty configuration.
- Using AI: Describe the alarm you want in plain English and let KloudMate build it for you.
From Template
Section titled “From Template”Instead of building an alarm from scratch, you can start from a pre-configured template that covers common monitoring scenarios and best practices.
-
In the Create Alarm dialog, select From Template.
-
Click the Select a template dropdown and choose a template that matches your monitoring needs.
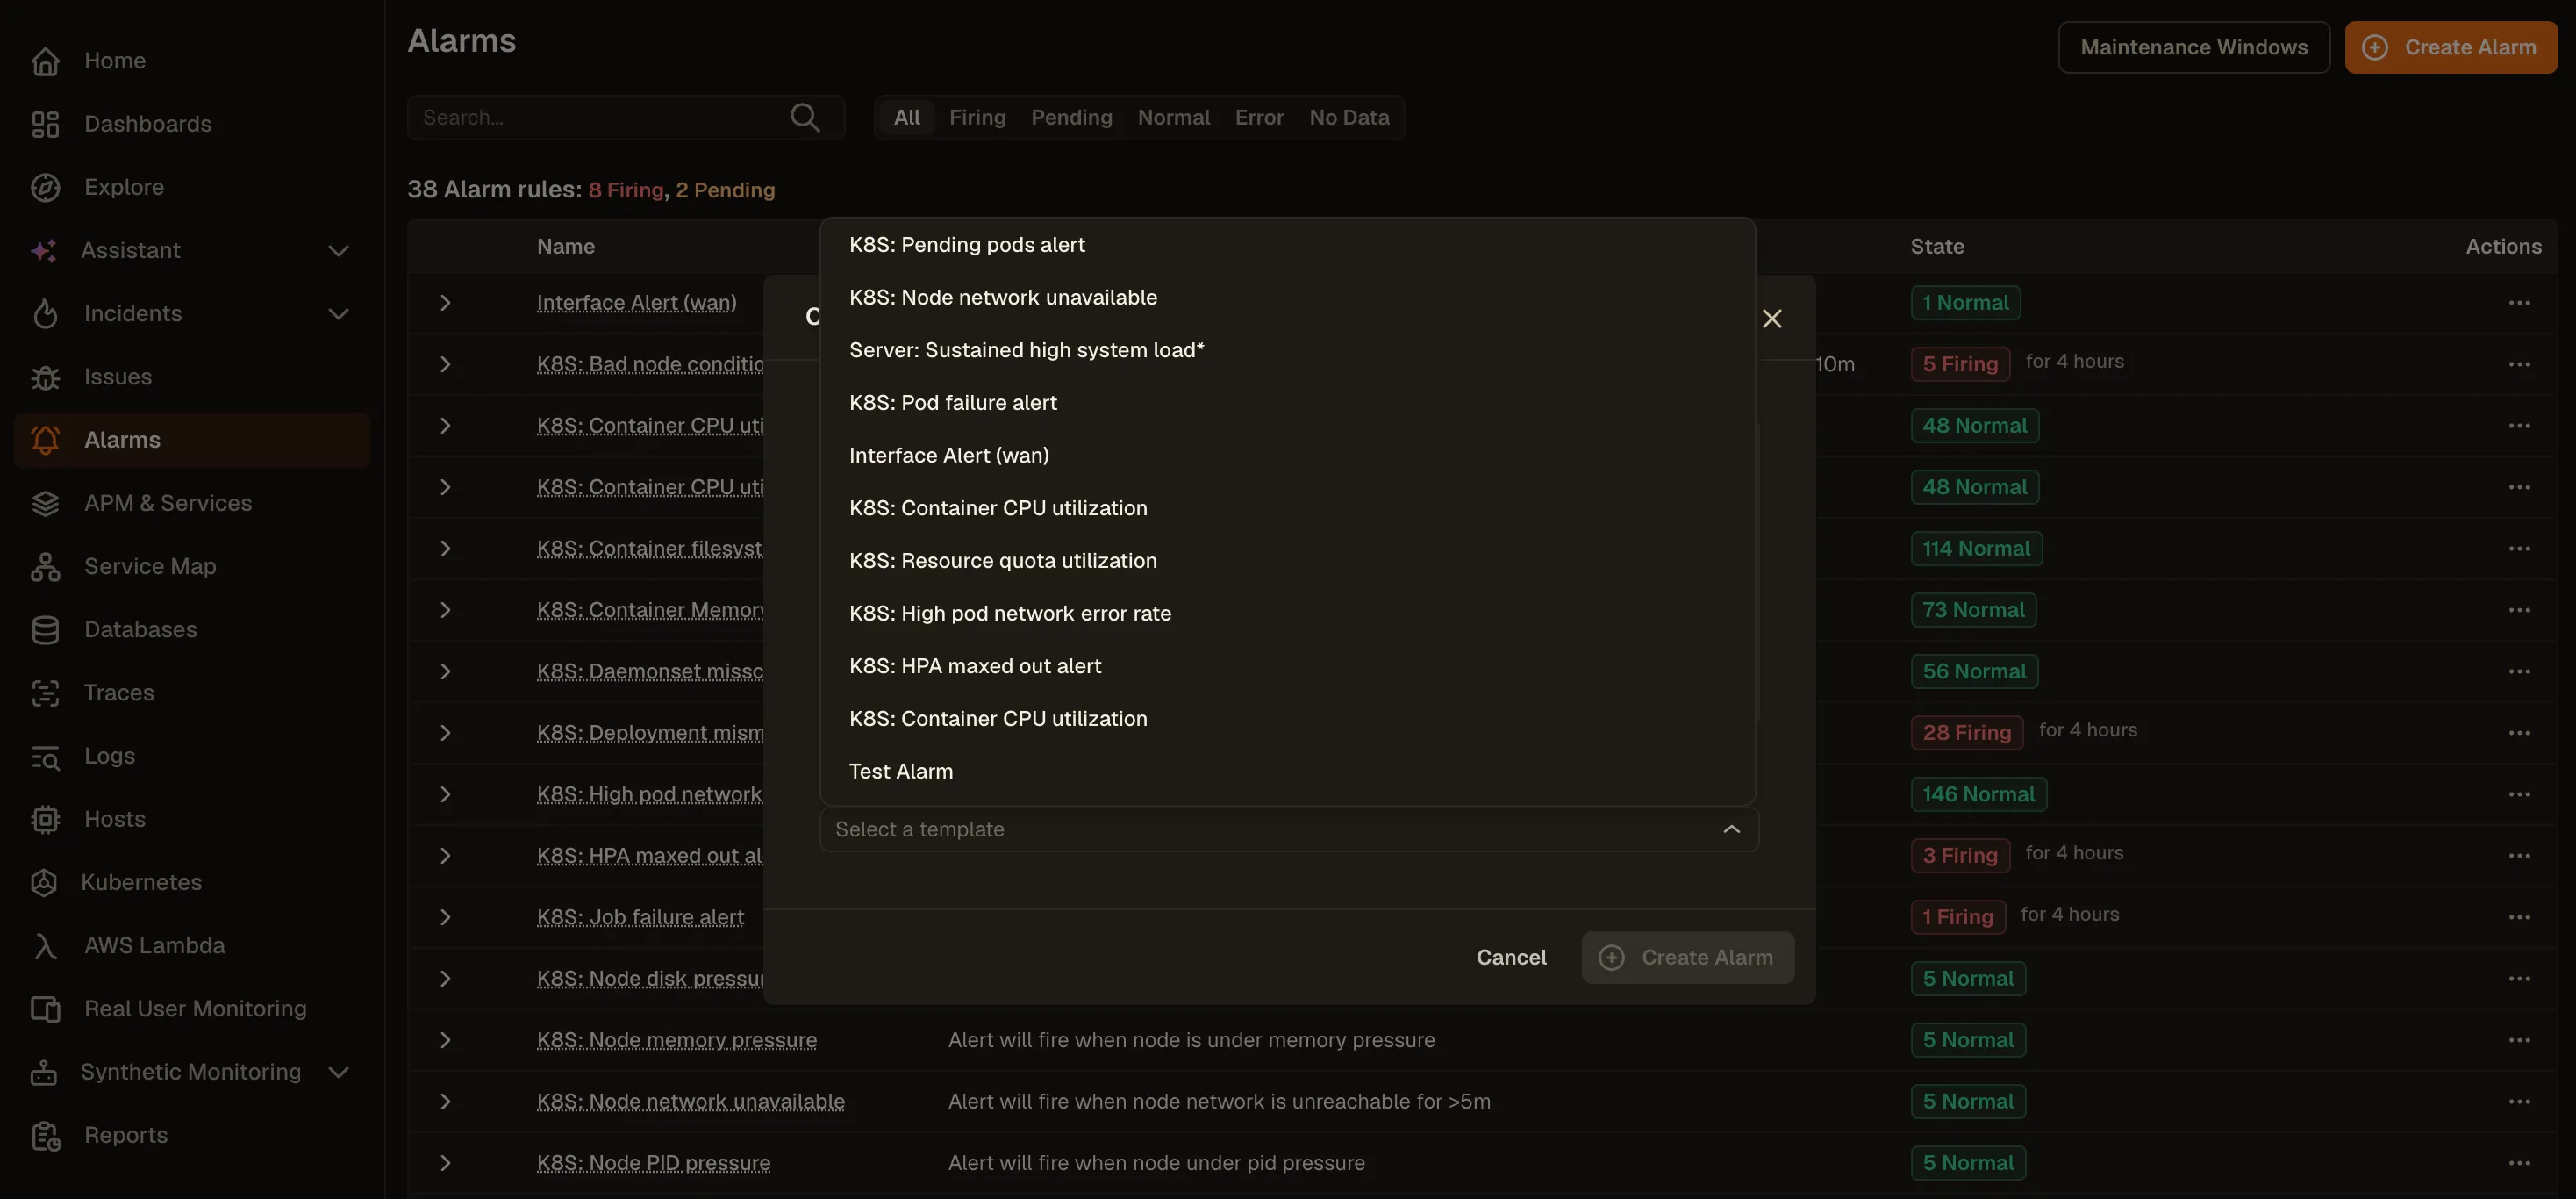
- Click Create Alarm. The alarm is created and appears in the Alarms list.
- To open and configure it, click the menu next to the alarm and select Edit.
- The alarm opens pre-configured with the query, aggregation, and threshold settings from the template. Review and adjust any filters to match your environment.
- Click Save or Save & Close when done.
Using AI
Section titled “Using AI”KloudMate’s assistant can automatically generate alarm queries and thresholds based on your natural language prompt.
-
In the Create Alarm dialog, select Using AI.
-
A text box appears. Describe the alarm you want to create.
-
Click Create Alarm. KloudMate generates the alarm configuration based on your description.
-
To review or adjust the settings, click the menu next to the alarm and select Edit.
From Scratch
Section titled “From Scratch”To build a fully custom alarm, select From Scratch in the Create Alarm dialog and click Create Alarm.
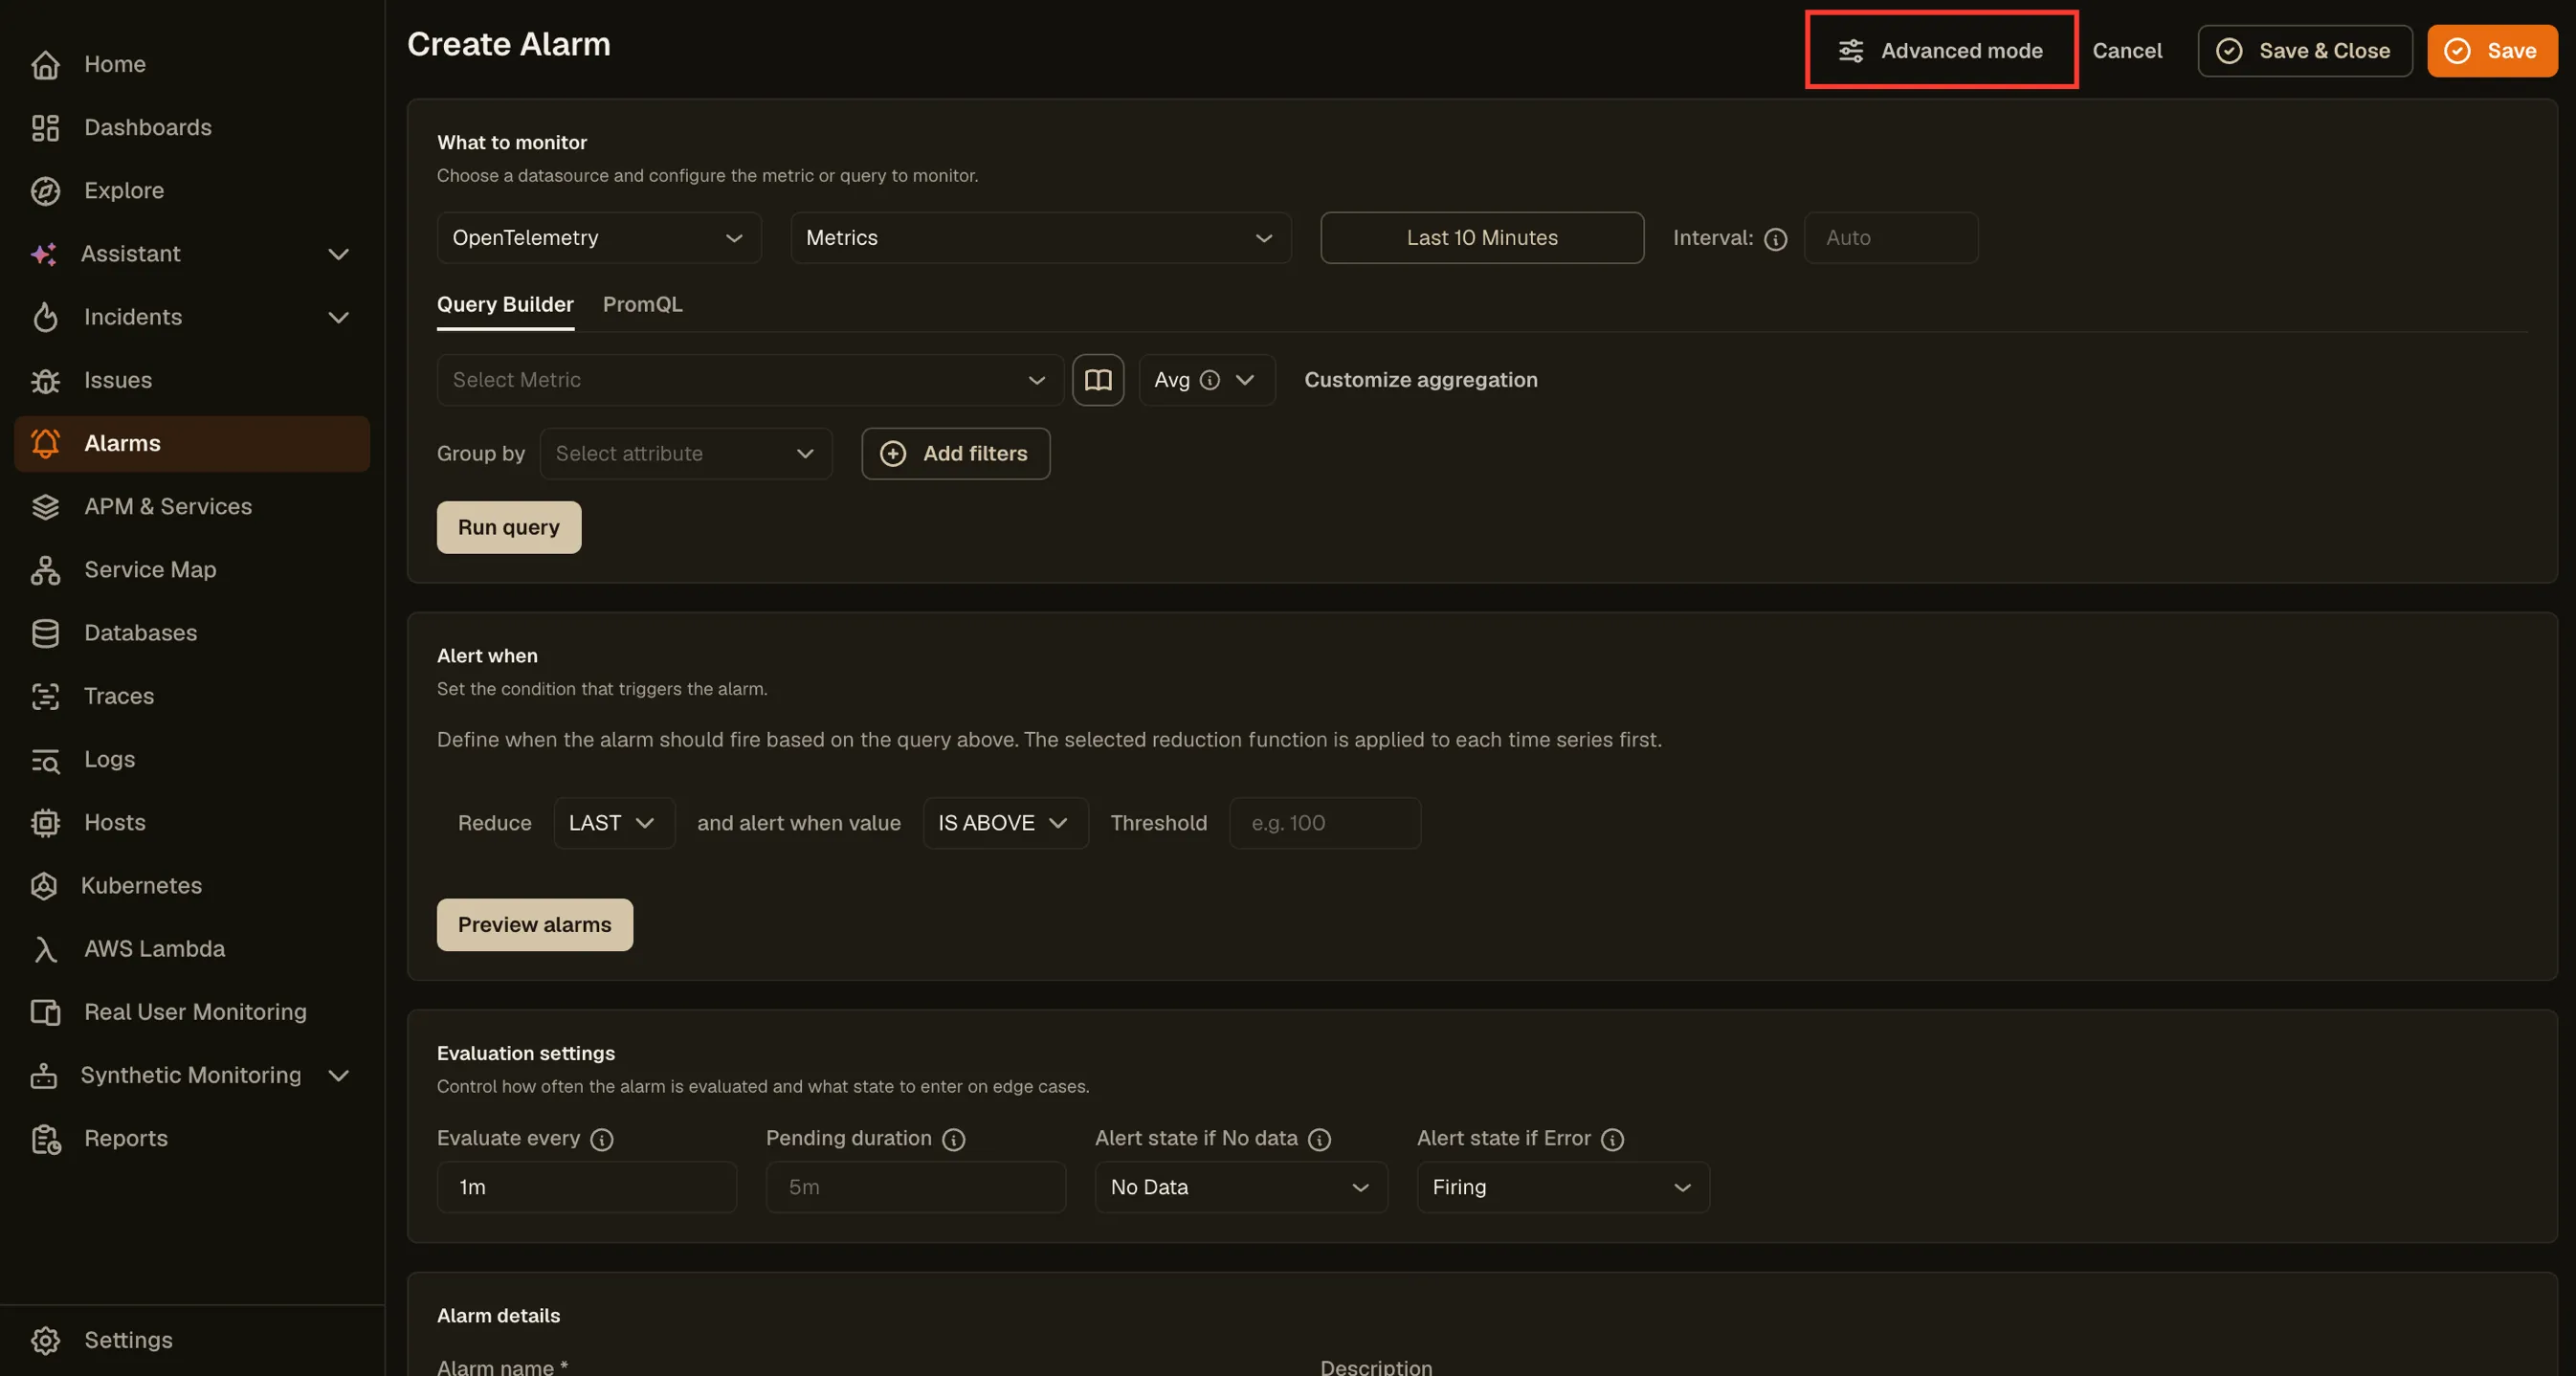
This opens the alarm creation form where you can choose a data source, configure the metric or query to monitor, and define the alert condition on a single page.
You can create multiple queries and expressions using the Add Query and Add Expression buttons. Each query or expression is assigned a unique alphabetical notation such as A, B, or C. You can duplicate any query or expression using the copy icon at the top-right corner of each block.
To access advanced query and expression options such as Math expressions, Reduce, and Condition expressions, click Advanced mode at the top of the form.
1. Setup Query Conditions and Expressions
Section titled “1. Setup Query Conditions and Expressions”Setting Up Query Conditions for OpenTelemetry / KloudMate
Section titled “Setting Up Query Conditions for OpenTelemetry / KloudMate”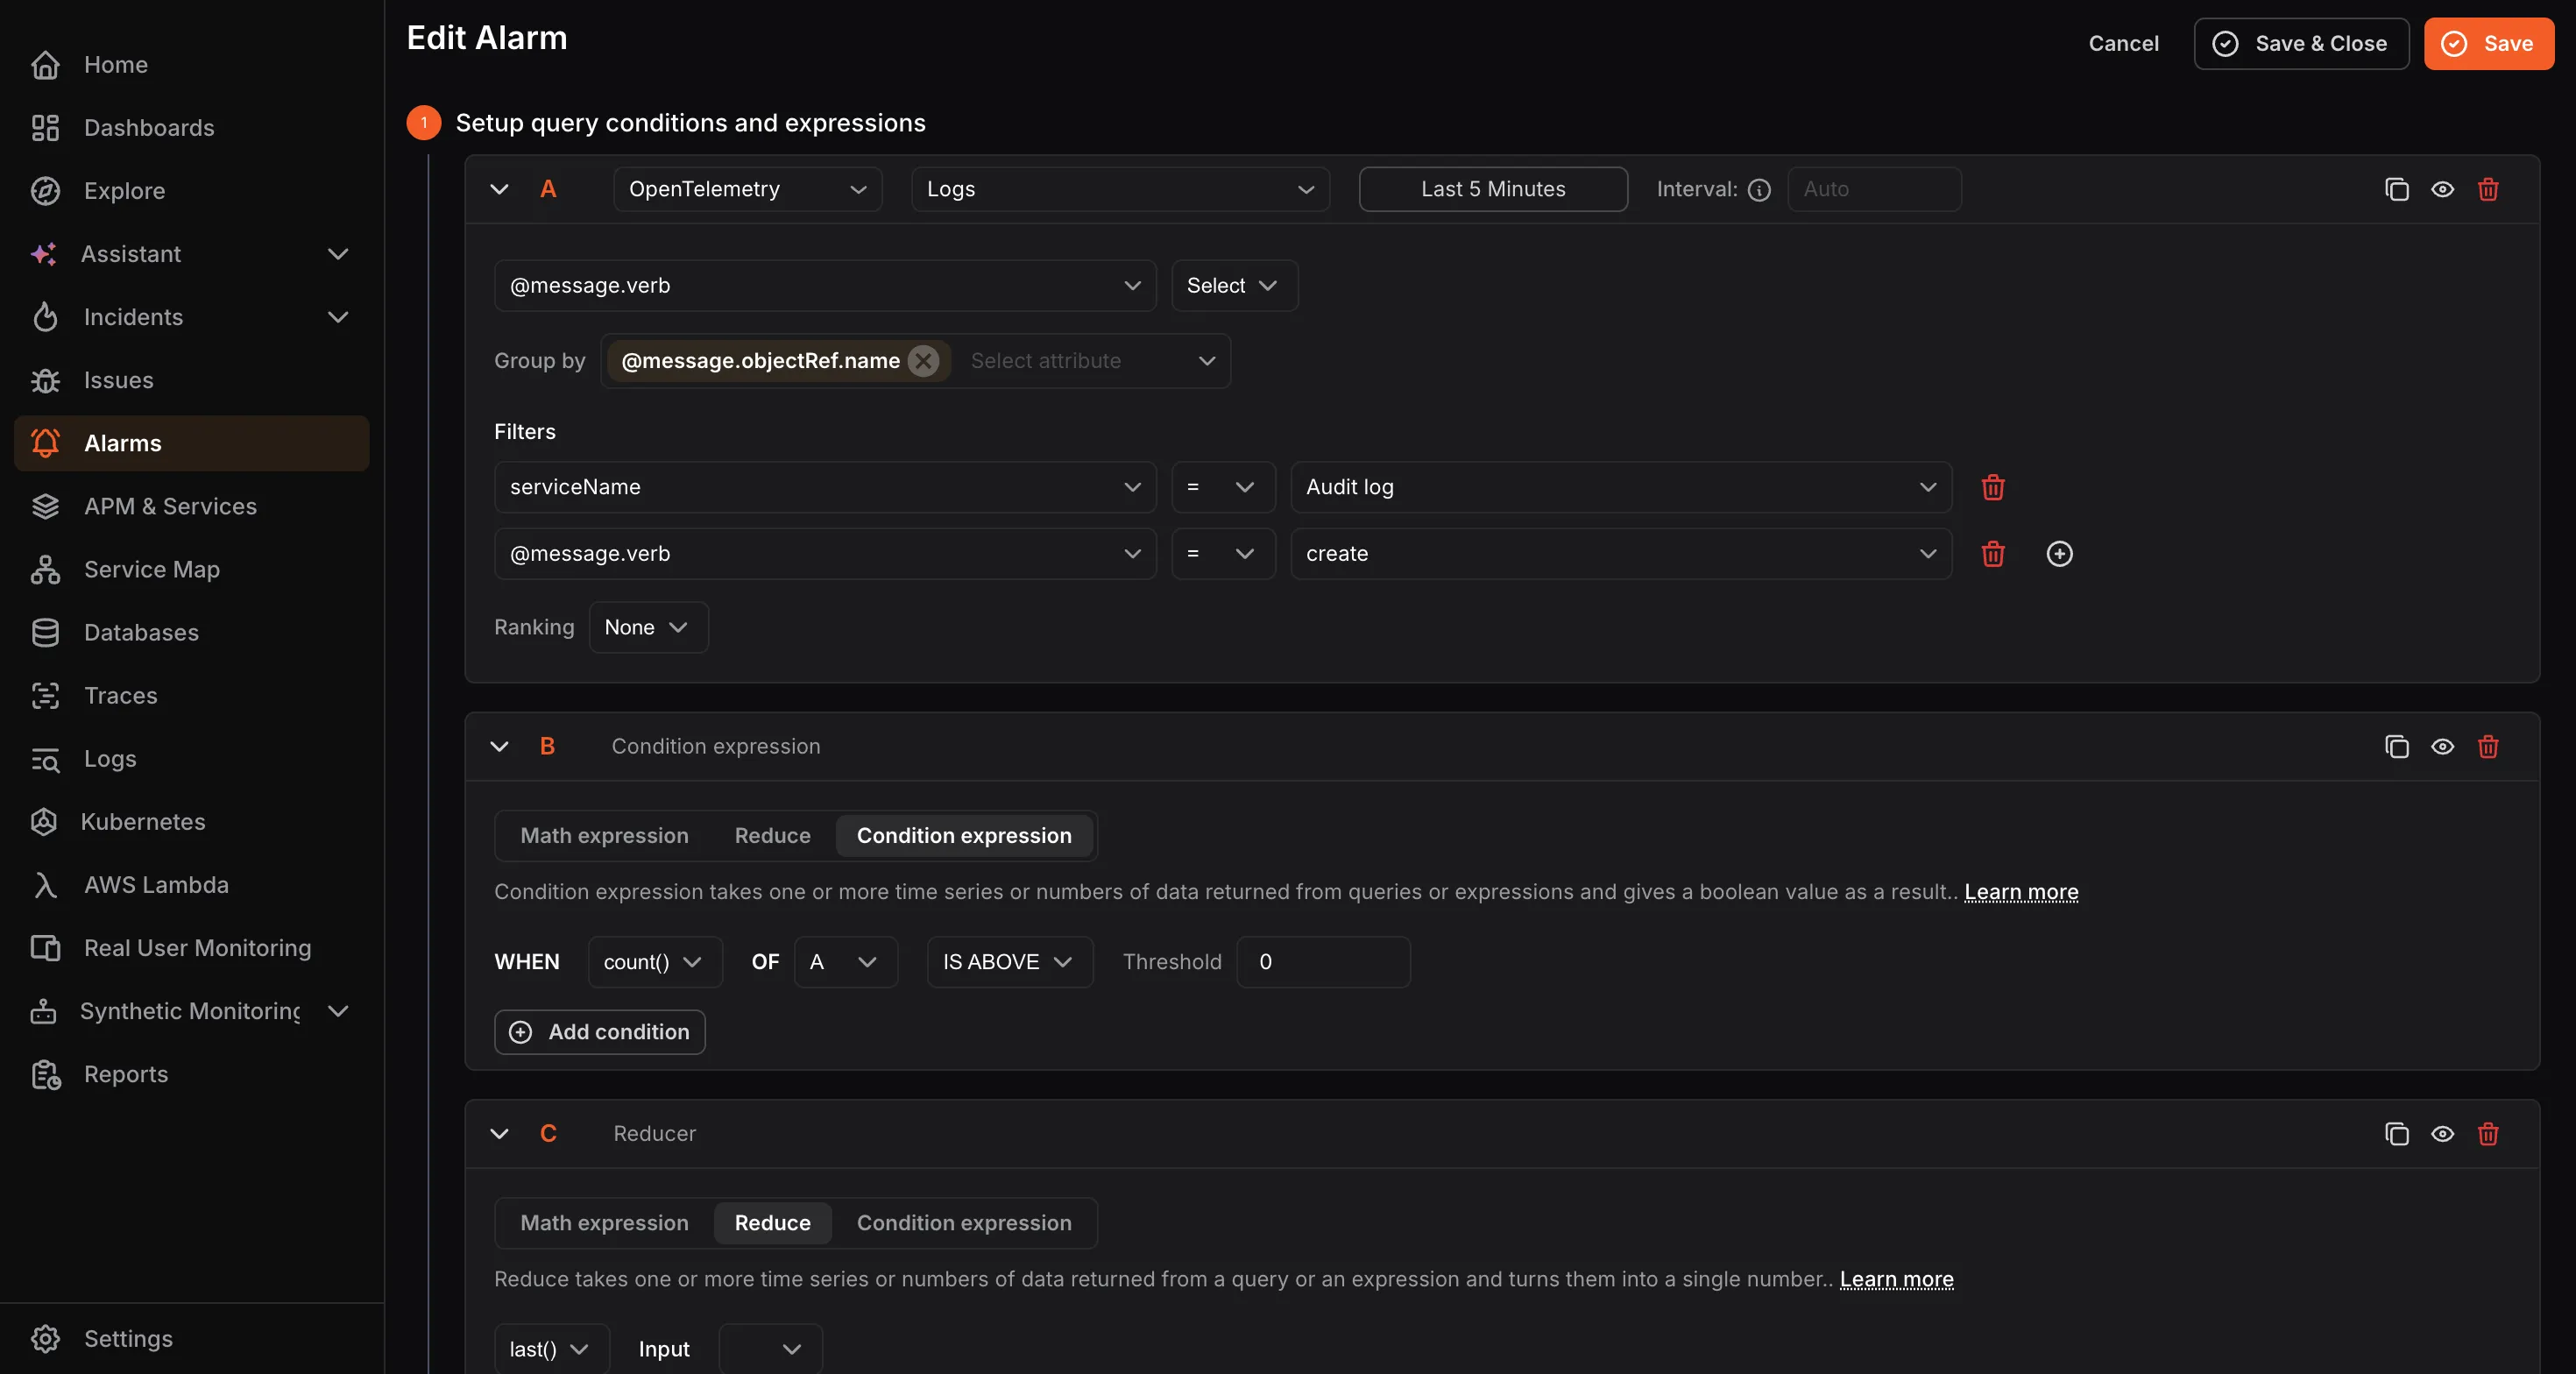
- Data Set: Select the dataset you want to retrieve from your data source.
- Metric to Aggregate: Select the metric associated with the selected dataset that you want to monitor.
- Group By: Enter the attributes used to group the data points.
- Filters: Add filters to narrow down the retrieved data points.
OpenTelemetry users can also use Prometheus query language to retrieve data and configure alarms.
Setting Up Query Conditions for AWS (CloudWatch)
Section titled “Setting Up Query Conditions for AWS (CloudWatch)”
- Time Range: Set the duration for which data should be fetched using the dropdown, or enter a custom value in seconds.
- Region: Select the AWS region of the service you want to monitor.
- Namespace: Select the AWS service namespace you want to create an alarm for.
- Metric: Select the metric associated with the selected namespace.
- Statistic: Select the statistical function to use when calculating data points.
- Dimensions: Optionally configure the alarm for grouped resources within the selected namespace. For example, for EC2, you can filter by autoscaling group name, image ID, instance type, and more.
Click Run Query to fetch data.
Time Range Expressions for Custom Time
Section titled “Time Range Expressions for Custom Time”Alarm query time ranges support the following:
- Operators:
-for subtracting time - Supported values: The same units and keywords used in dashboards
- Examples:
now,now-5m
Setting Up Evaluation Expressions
Section titled “Setting Up Evaluation Expressions”Expressions let you apply logic to query results. Reference any configured query or expression using its alphabetical notation, such as A, B, or C. An expression can be passed as a parameter only when multiple expressions are configured.
Choose from the following expression types:
- Math Expression: Enter a mathematical expression to apply to the value of a query or expression. Examples:
$A+1,$A<$B,$A && $C. For more information, see Alarm Expressions. - Reduce: Select a function to aggregate the values of a query or expression into a single number, then select the target query or expression from the Input dropdown. Available functions include
mean(),max(),min(),sum(),last(), andcount(). - Condition Expression: Select a function and a query or expression, then choose a condition and provide a threshold value to evaluate against. You can add multiple conditions and combine them using AND or OR logical operators.
Click Run Queries to execute all configured queries and expressions.
To avoid the NoData issue when using multiple queries in a single alarm, use the ifNull operator to assign a default value. Read more in Alarm Expressions.
2. Configure Evaluation Settings
Section titled “2. Configure Evaluation Settings”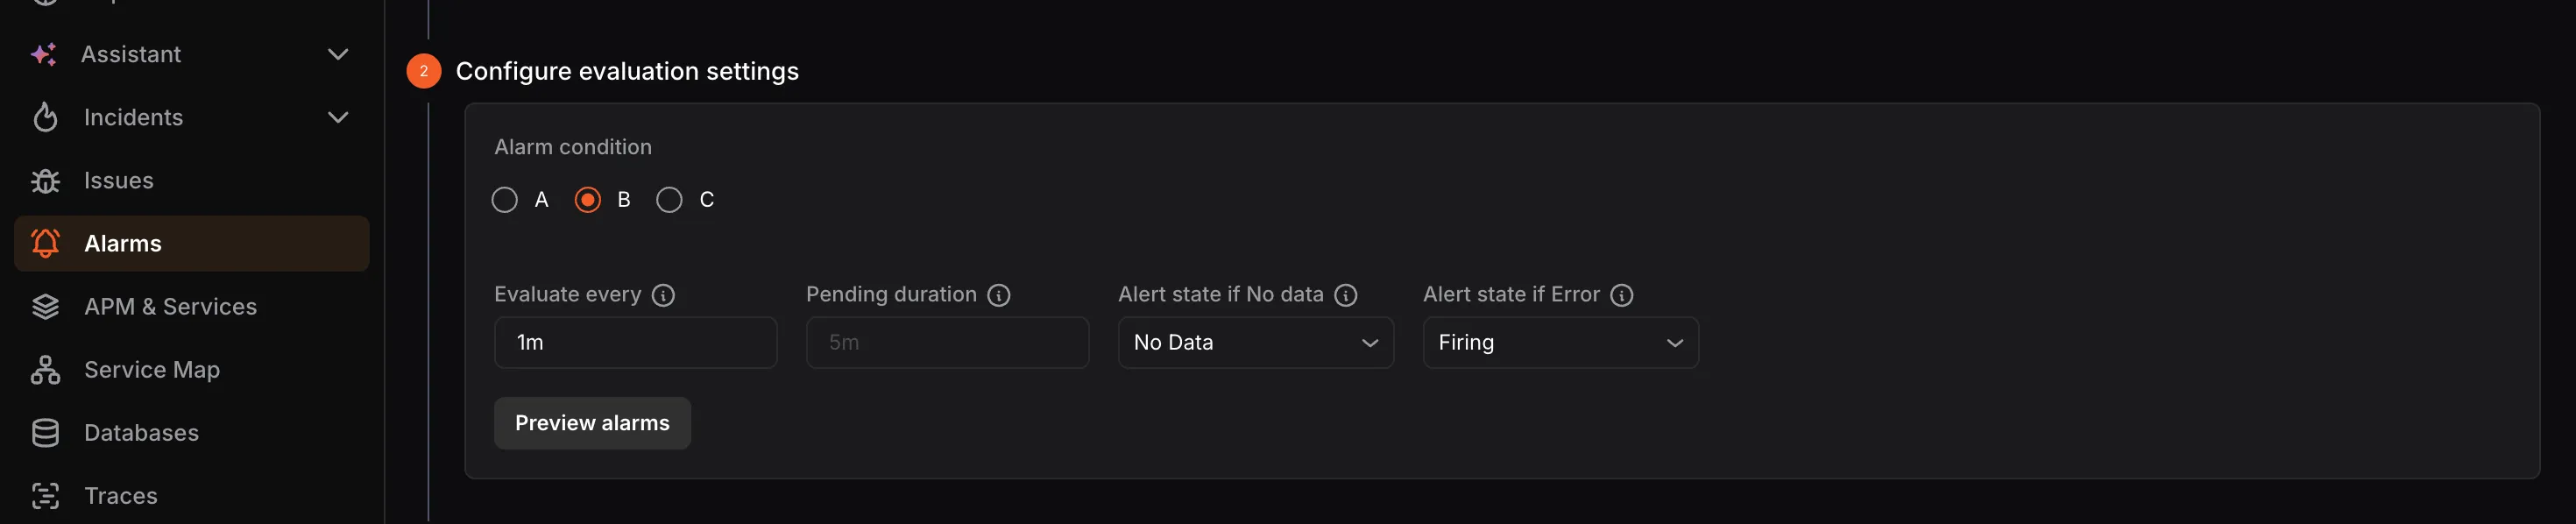
- Alarm Condition: Select the query or expression that should trigger the alarm, such as A, B, or C.
- Evaluate Every: Define how frequently the alarm condition should be evaluated, for example
1m. - Pending Duration: Define how long the alarm condition must remain true before the alarm is triggered, for example
5m. - Alert State if No Data: Select the alarm behavior when the query returns no data.
- Alert State if Error: Select the alarm behavior when the query returns an error.
Click Preview Alarms to run the query immediately and check the result.
3. Add Alarm Details
Section titled “3. Add Alarm Details”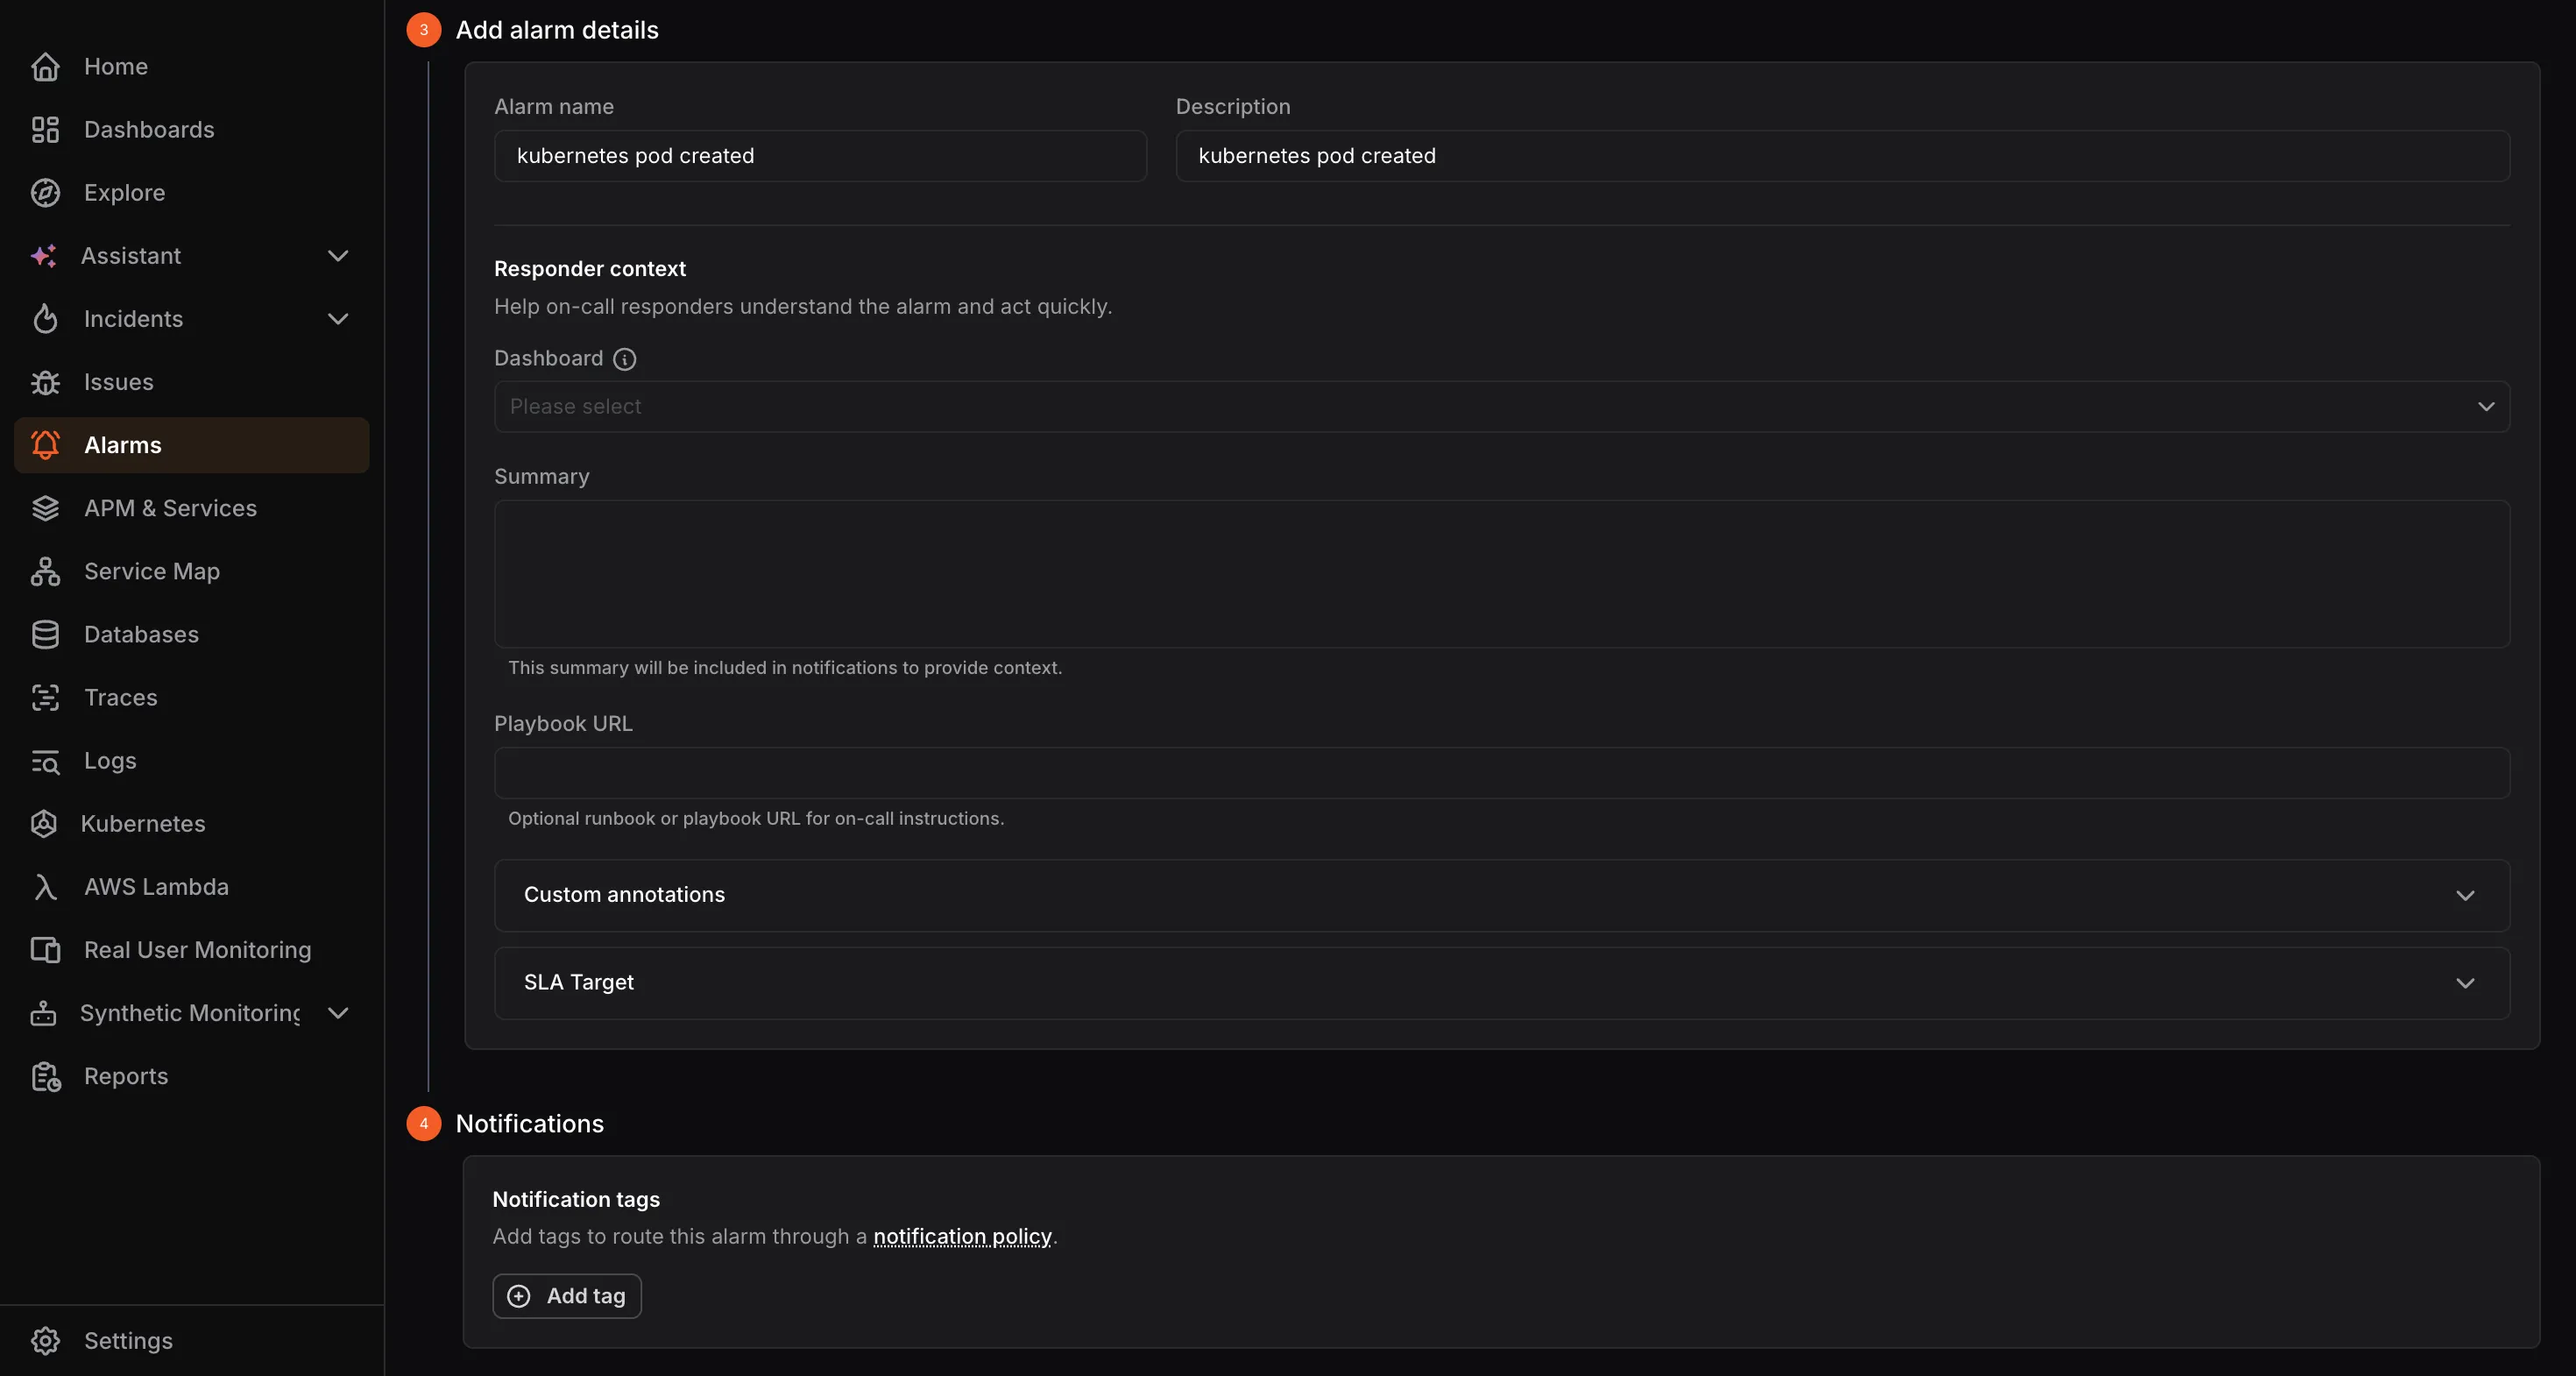
- Alarm Name: Enter a name for the alarm.
- Description: Add a description to help identify the alarm’s purpose.
- Responder Context: Optionally add context to help on-call responders understand the alarm and act quickly.
- Severity: Add a free-form severity label such as
sev1,critical, orp1. You can also use templates such as{{ labels.* }},{{ state.value }}, and{{ state.values.A }}. - Dashboard: Link a relevant dashboard for quick reference.
- Summary: Add a summary that will be included in notifications to provide context. It supports the same template variables as Severity.
- Playbook URL: Add an optional runbook or playbook URL with on-call instructions.
- Custom Annotations: Add custom key-value annotations.
- SLA Target: Set an SLA target for this alarm.
4. Add Notification Tags
Section titled “4. Add Notification Tags”Add tags to the alarm to route notifications through a matching notification policy. Each tag is a Name/Value pair. Click Add tag to add more tags. When the alarm is triggered, notifications are sent to the channels configured in the matching notification policy.
5. Save the Alarm
Section titled “5. Save the Alarm”Click Save to save the alarm, or Save & Close to save and return to the Alarms screen. A confirmation message appears when the alarm is created successfully.
Viewing an Alarm
Section titled “Viewing an Alarm”To open an alarm, click the menu next to it and select View. This opens the alarm detail page with four tabs:
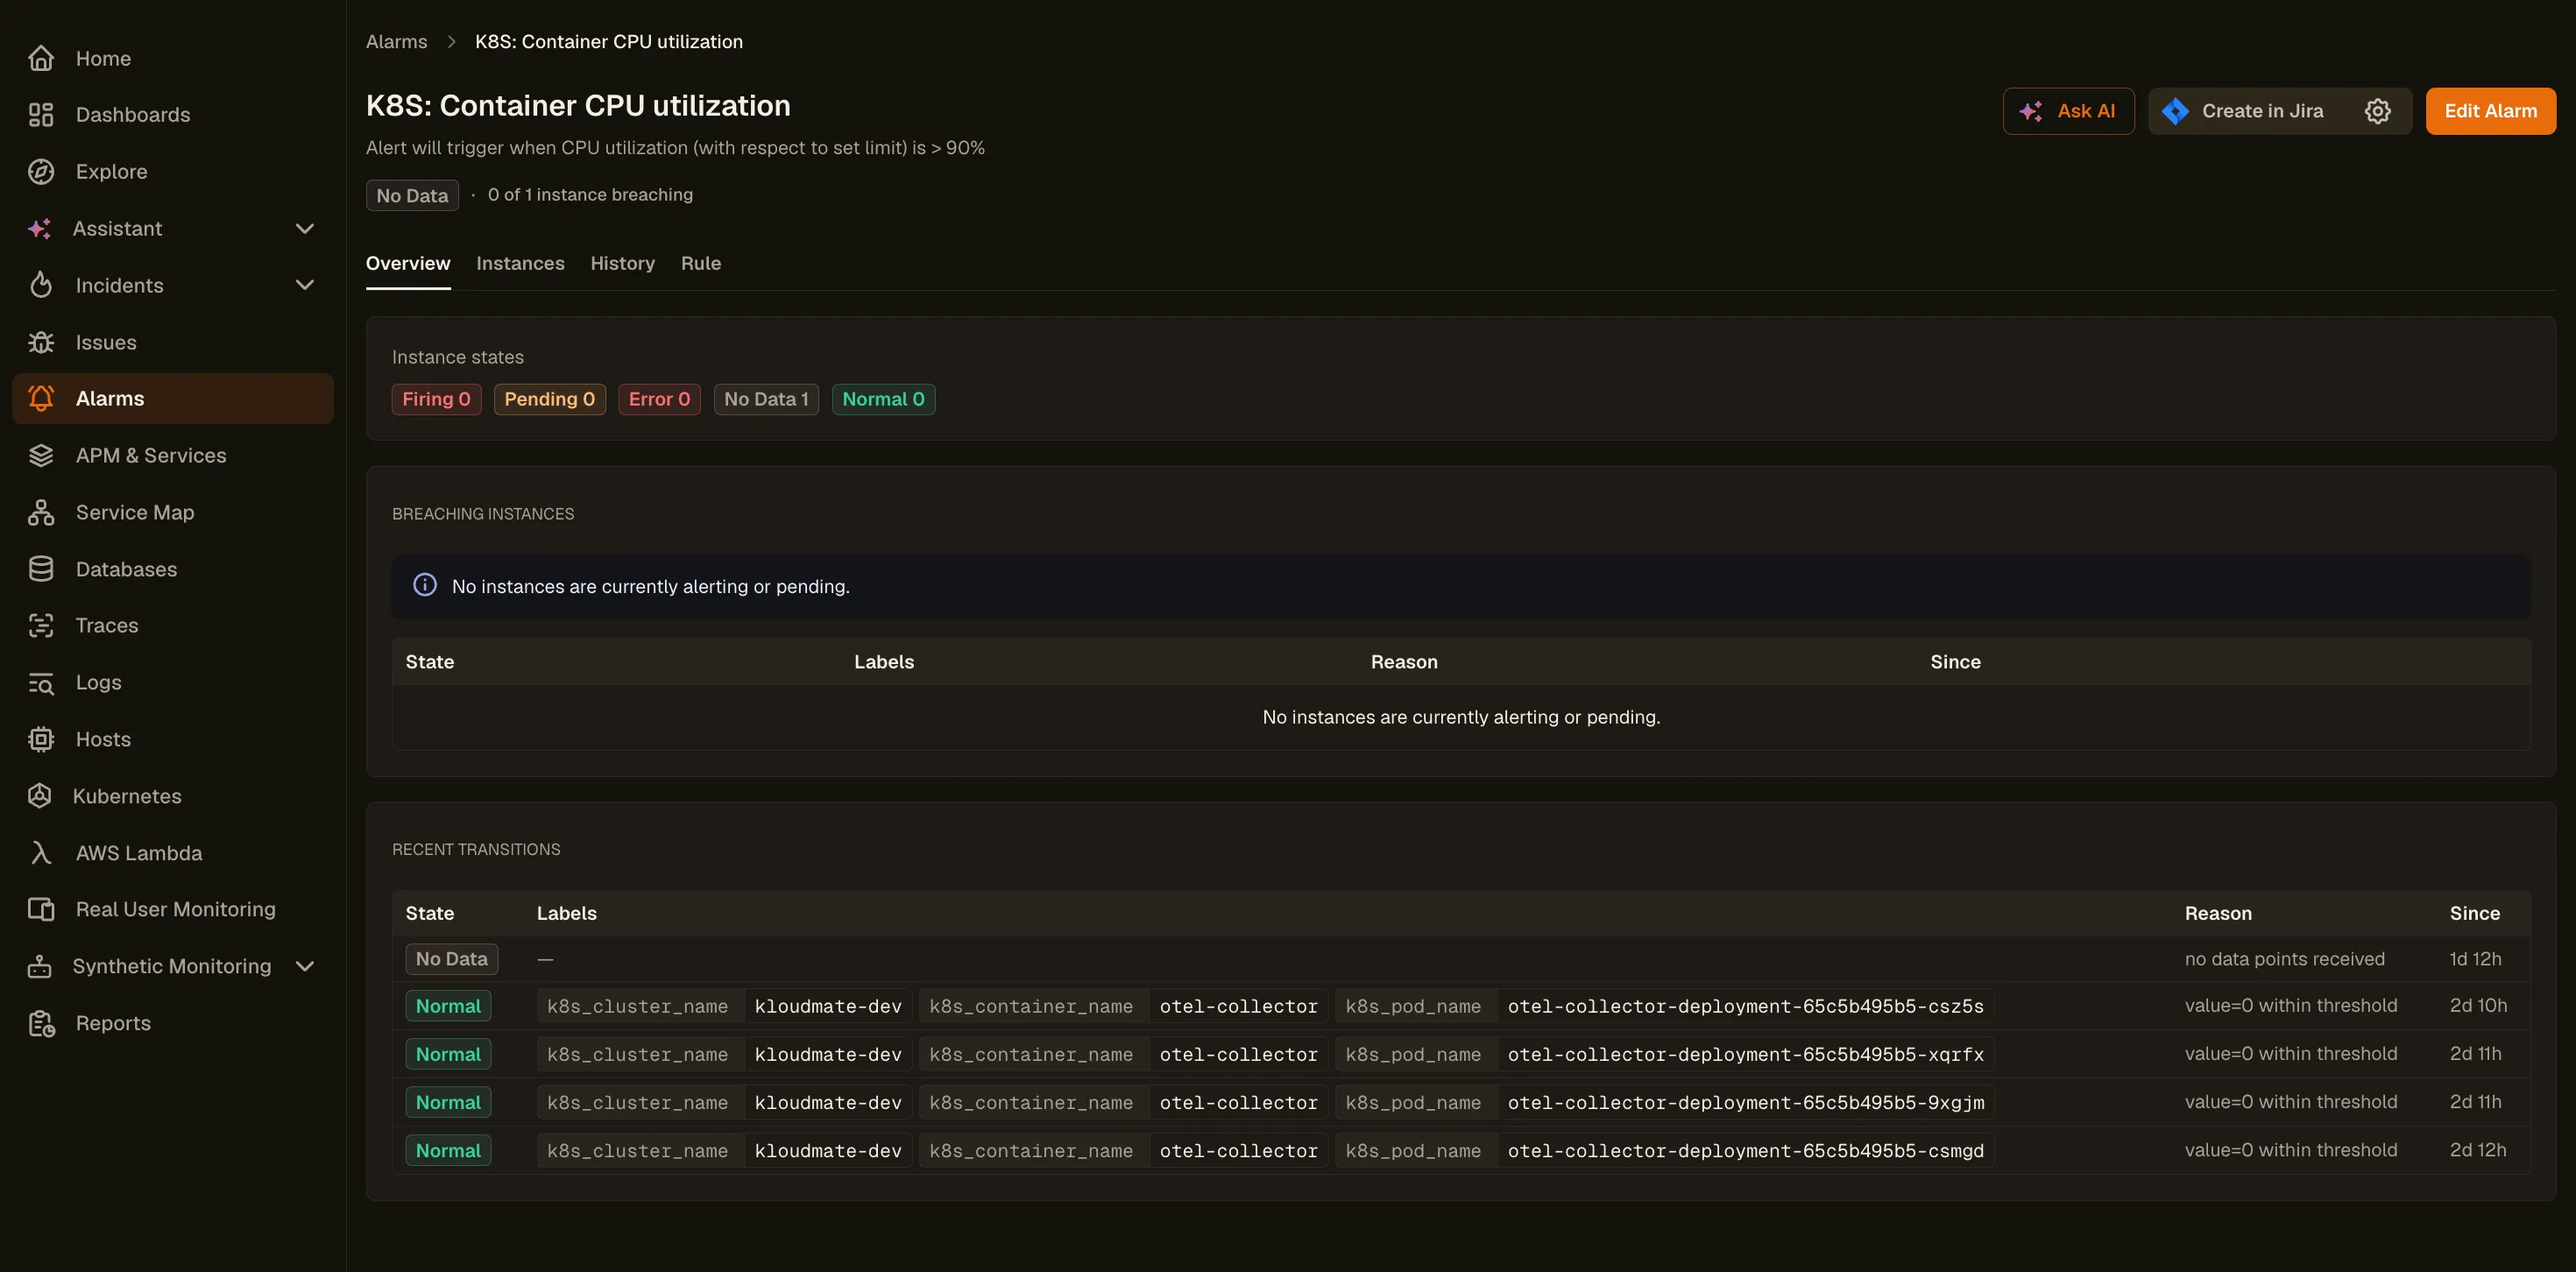
- Overview: Shows instance states, breaching instances with labels, reason, and duration, along with recent state transitions.
- Instances: Shows the full list of alarm instances and their current states.
- History: Shows the state change history over time.
- Rule: Shows the alarm configuration and query definition.