Trace Explorer
Click Traces in the left navigation menu to open the section. It opens on the Trace Summary view by default.
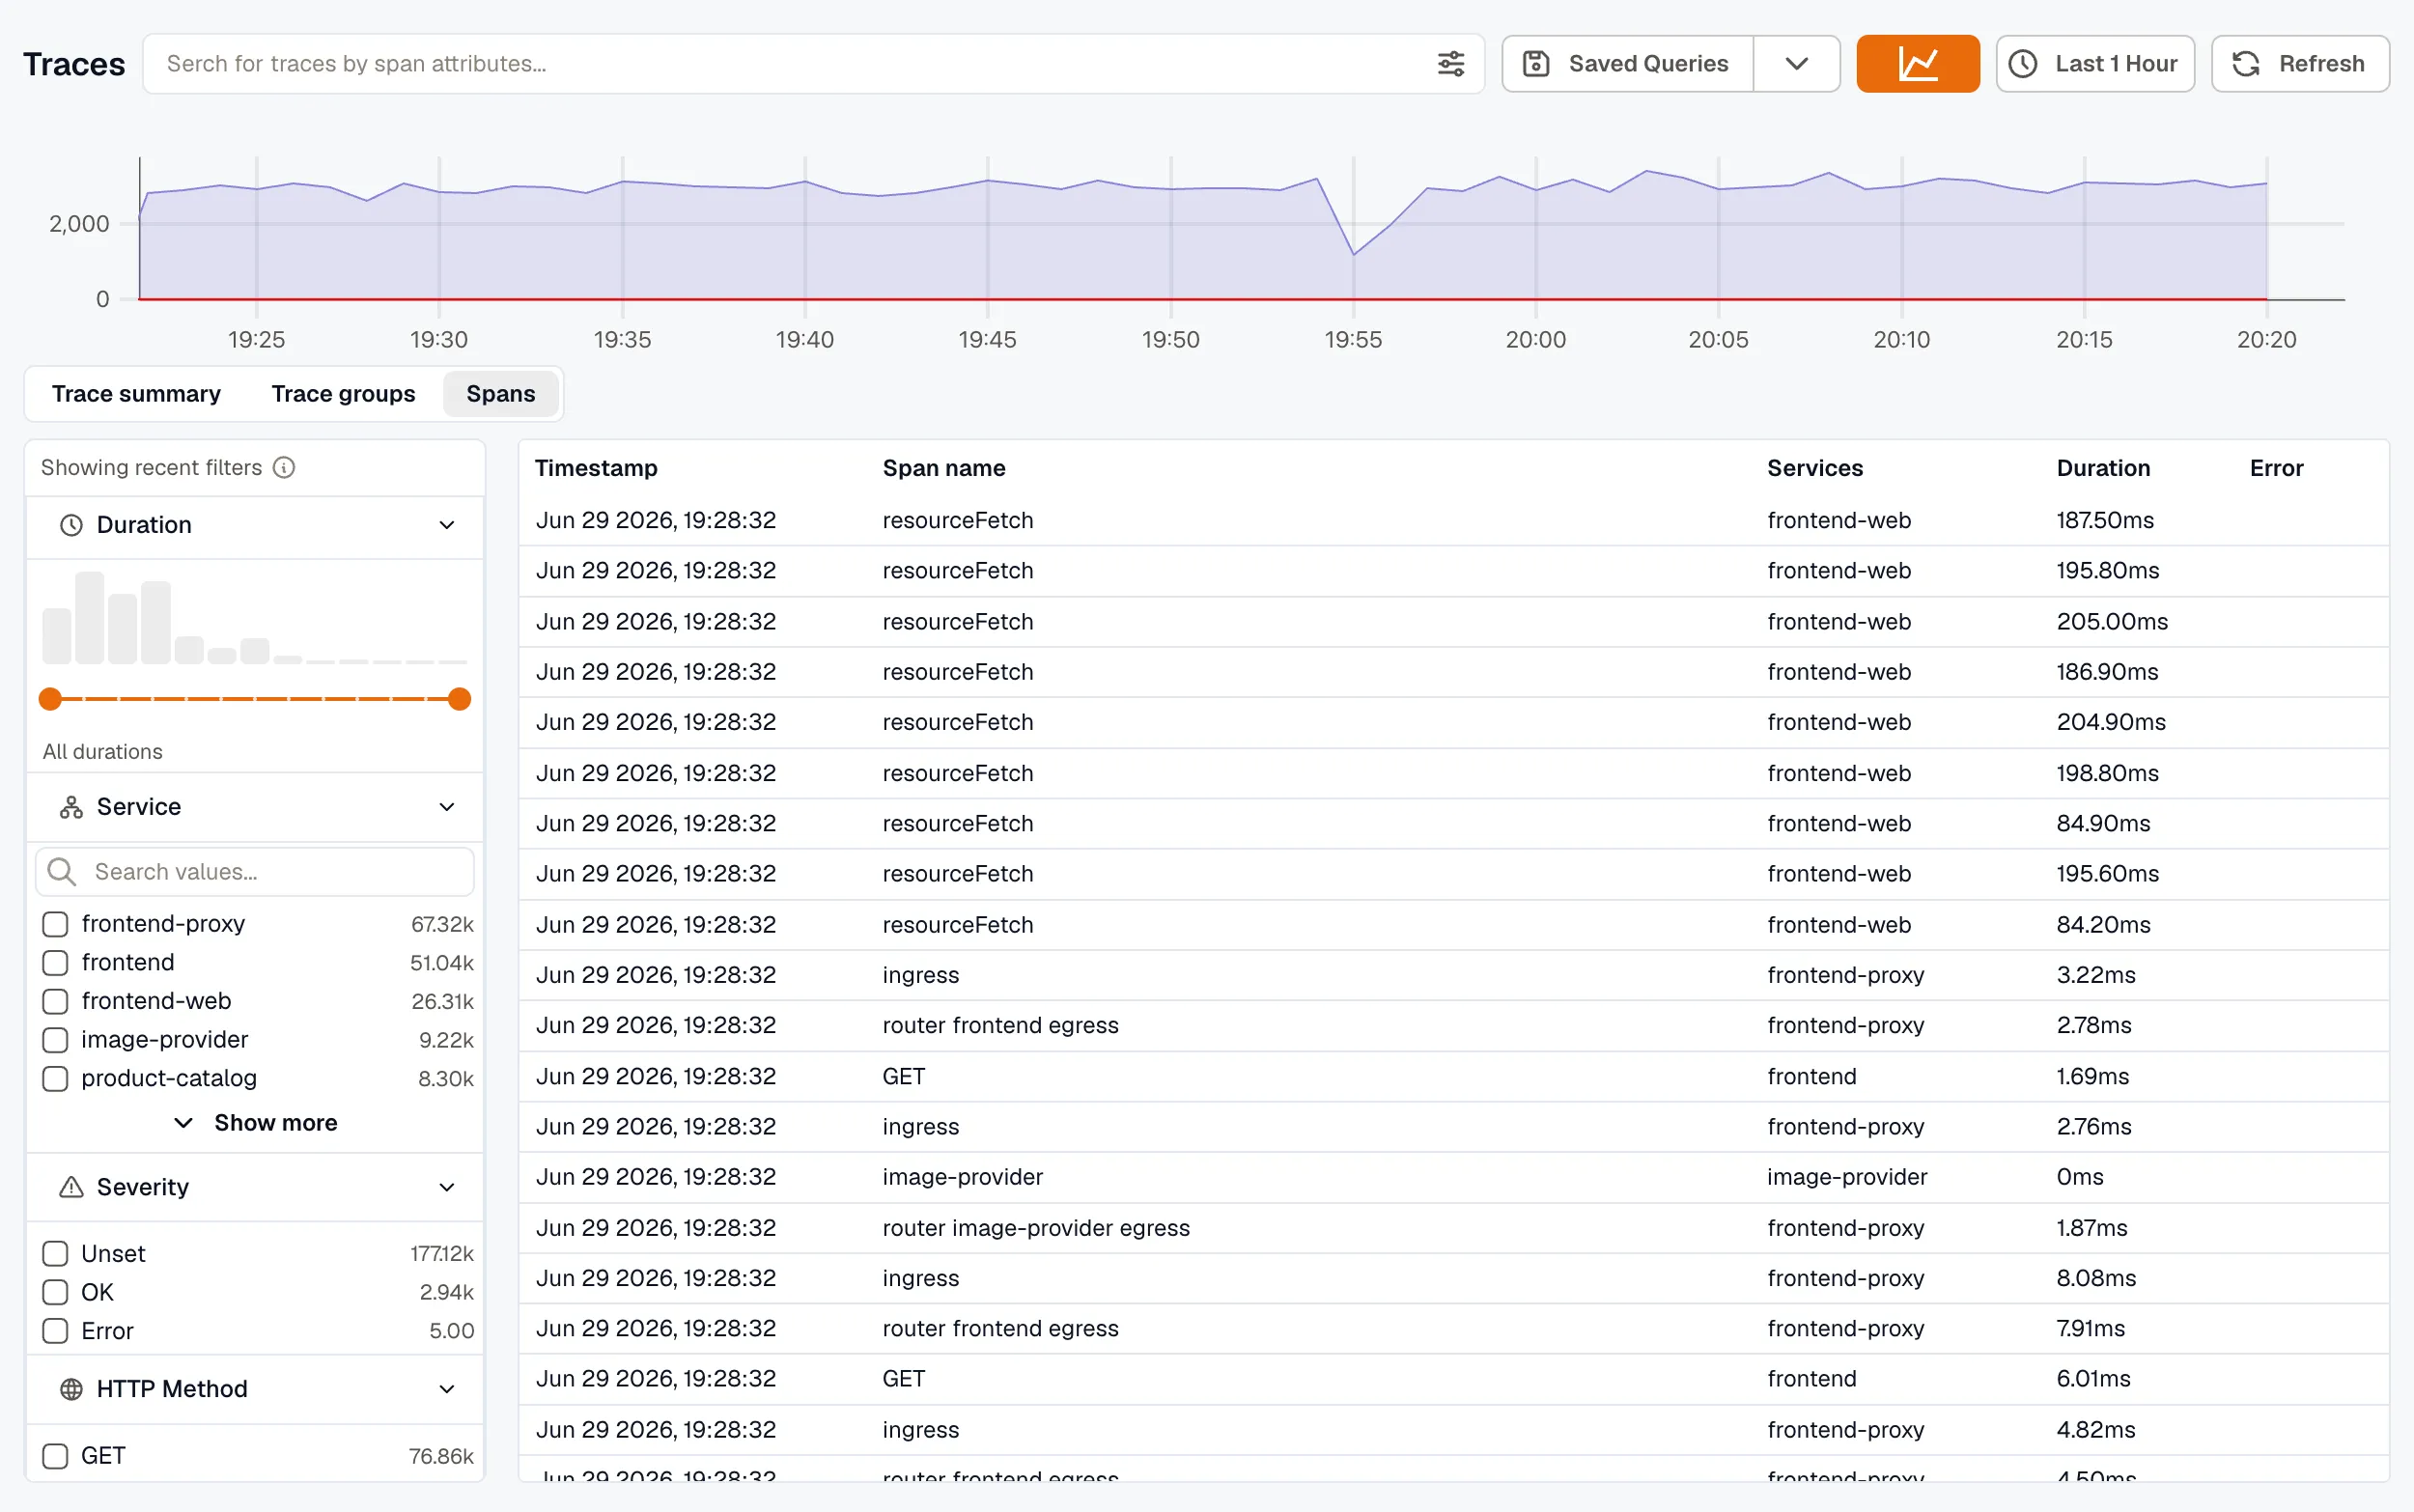
At the top of the page, the span volume graph visualizes trace activity over the selected time range. This gives you a quick pulse check on traffic patterns before you inspect individual traces.
Searching and Filtering
Section titled “Searching and Filtering”Search Bar
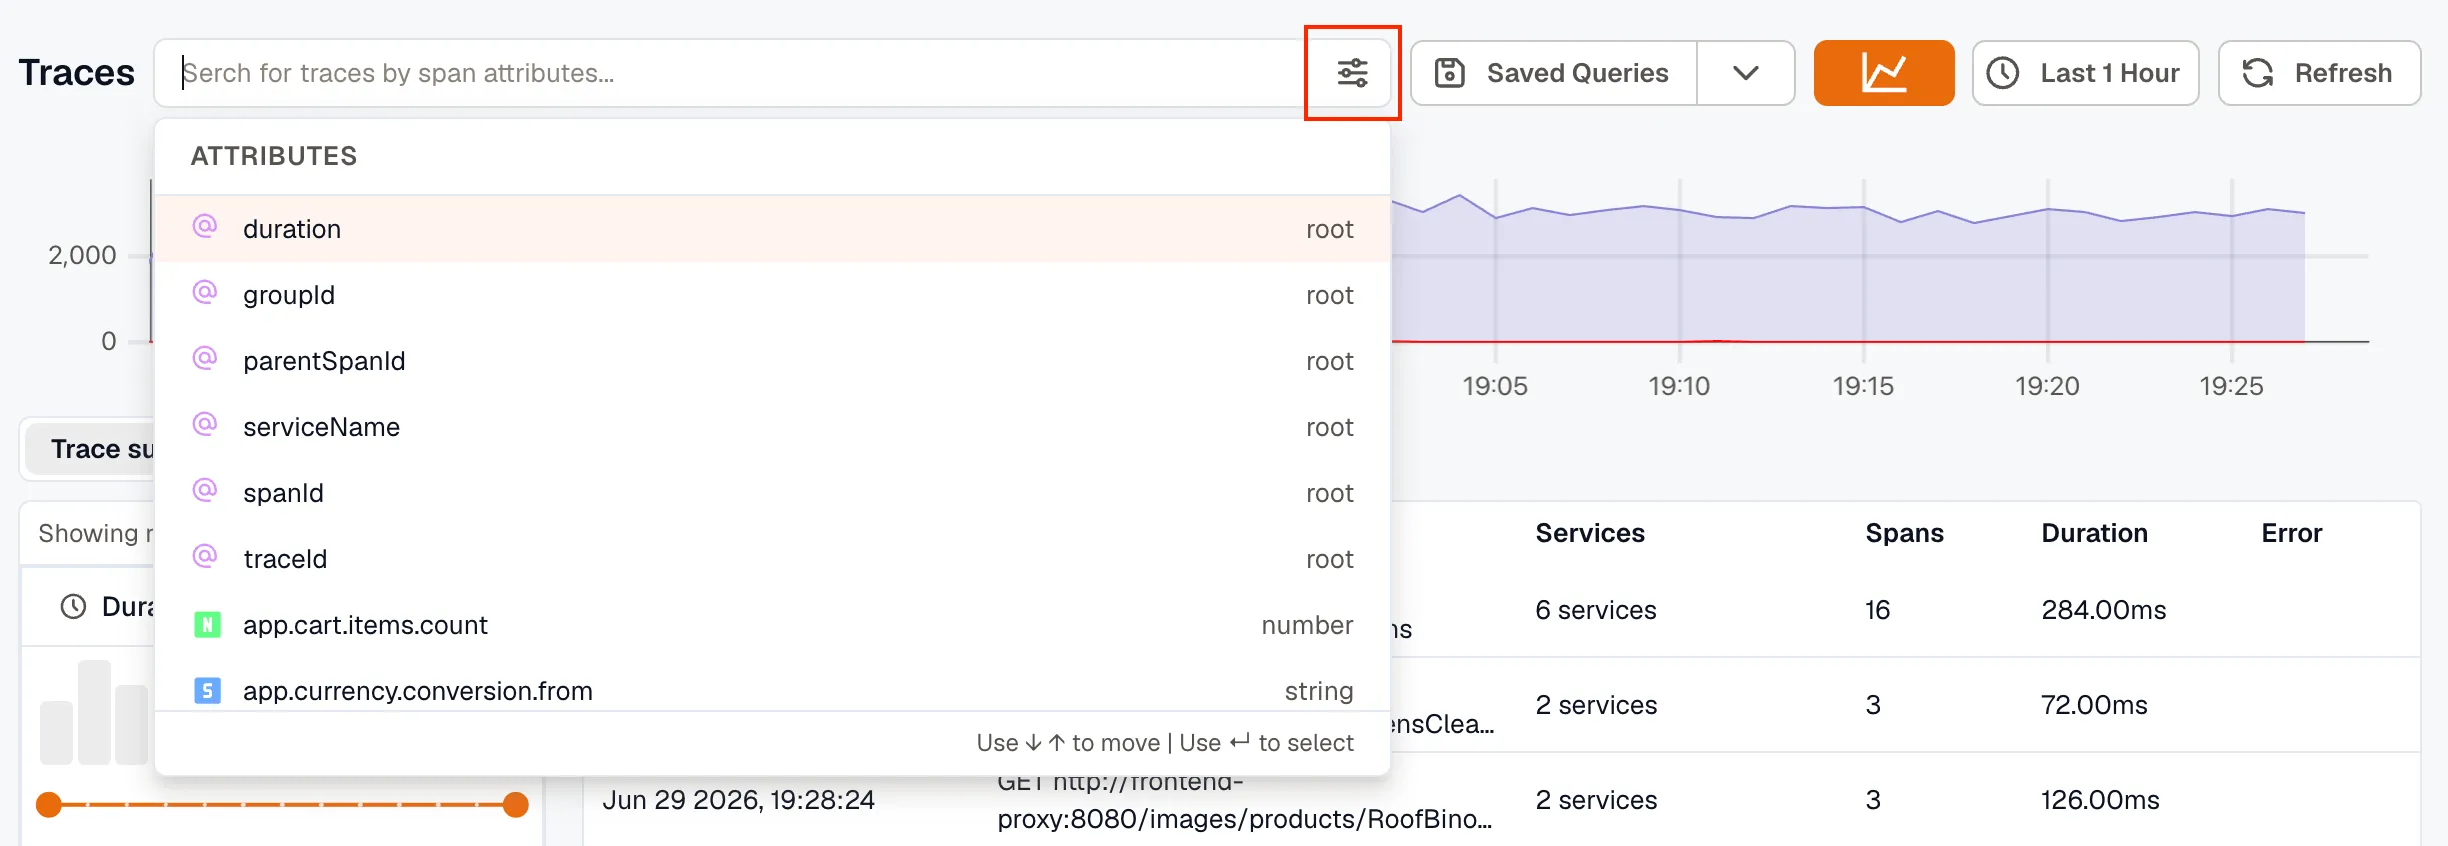
Section titled “Search Bar”Search across traces using span attributes. Click the search bar to see the list of available attributes.

Click the filter icon on the right to open the full attribute picker. Active filters appear as tags in the search bar and can be removed individually.
Sidebar Filters
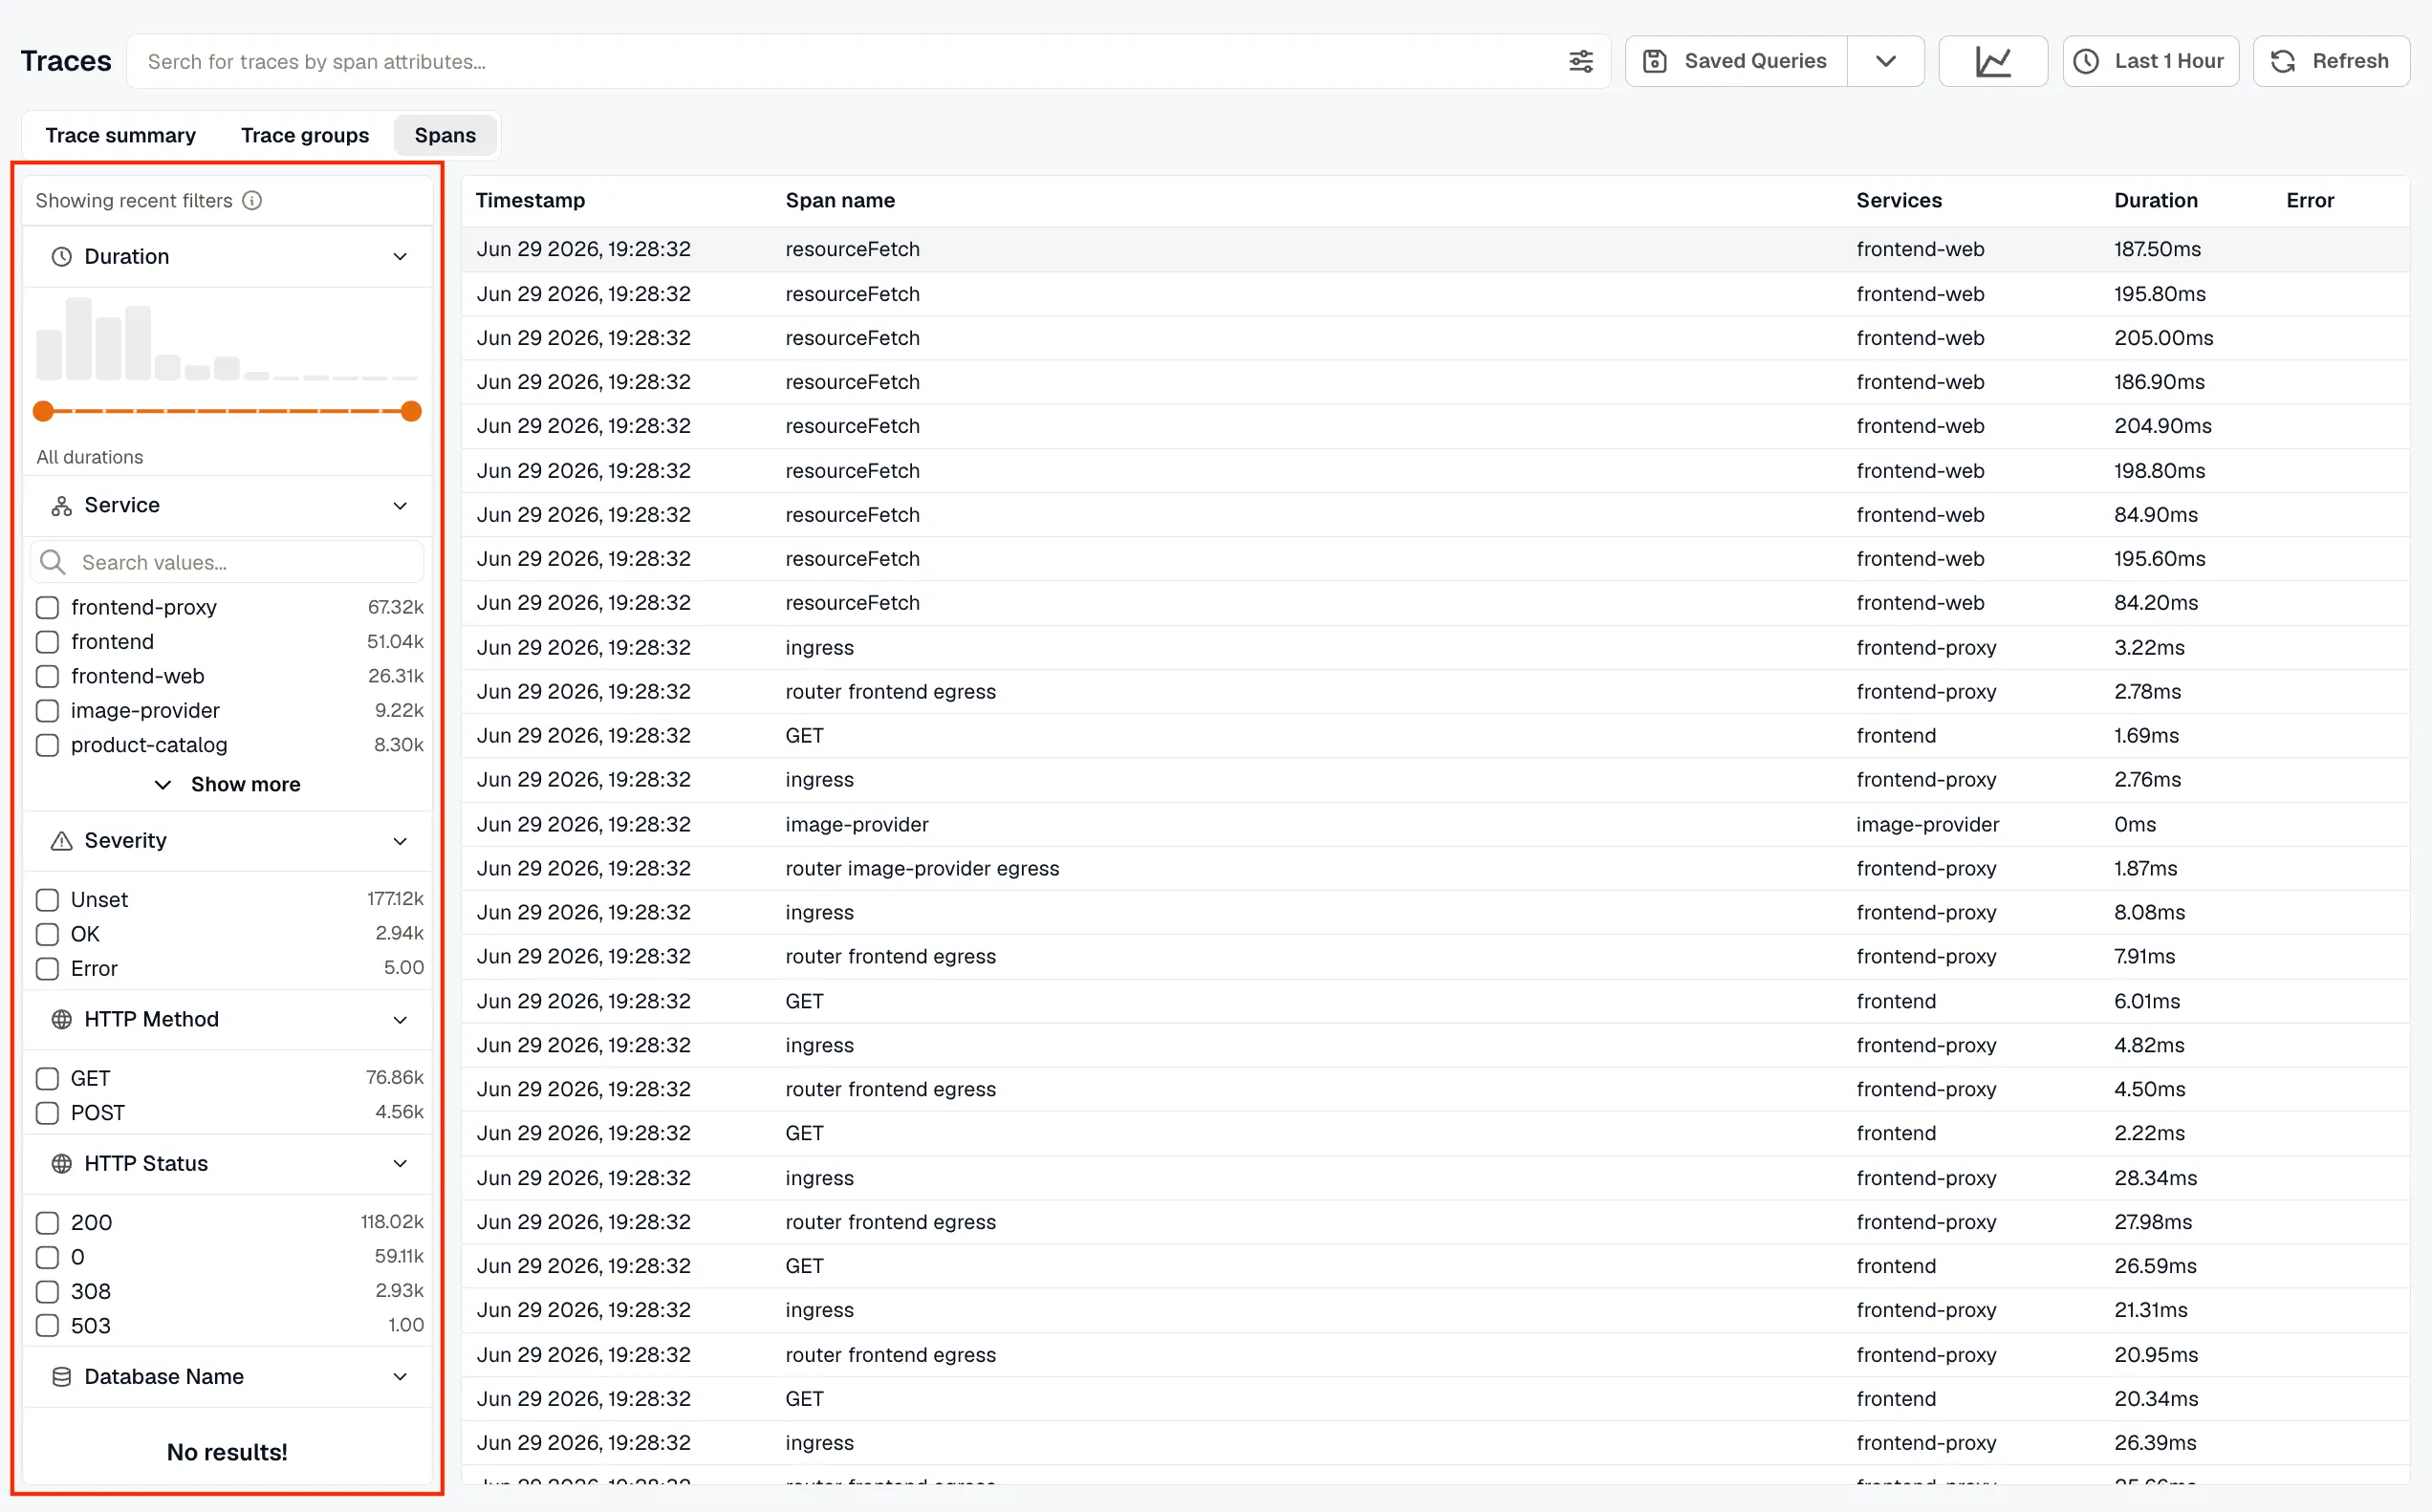
Section titled “Sidebar Filters”Use the left sidebar to filter results by:
- Service
- Severity
- HTTP Method
- HTTP Status
- Database Name
- Duration (a latency histogram with a range slider)
Each filter section includes a search box for quick lookup. When filters are active, a recent-filters notice appears at the top of the sidebar.
Saved Queries
Section titled “Saved Queries”Click Saved Queries to view and apply previously saved searches. To save a new query, click the dropdown arrow next to Saved Queries and select Add New.

Traces Result Views
Section titled “Traces Result Views”Switch between views using the toggle above the results. They all read the same trace data, subject to the active time range and filters — each gives you a different level of detail.
Trace Summary
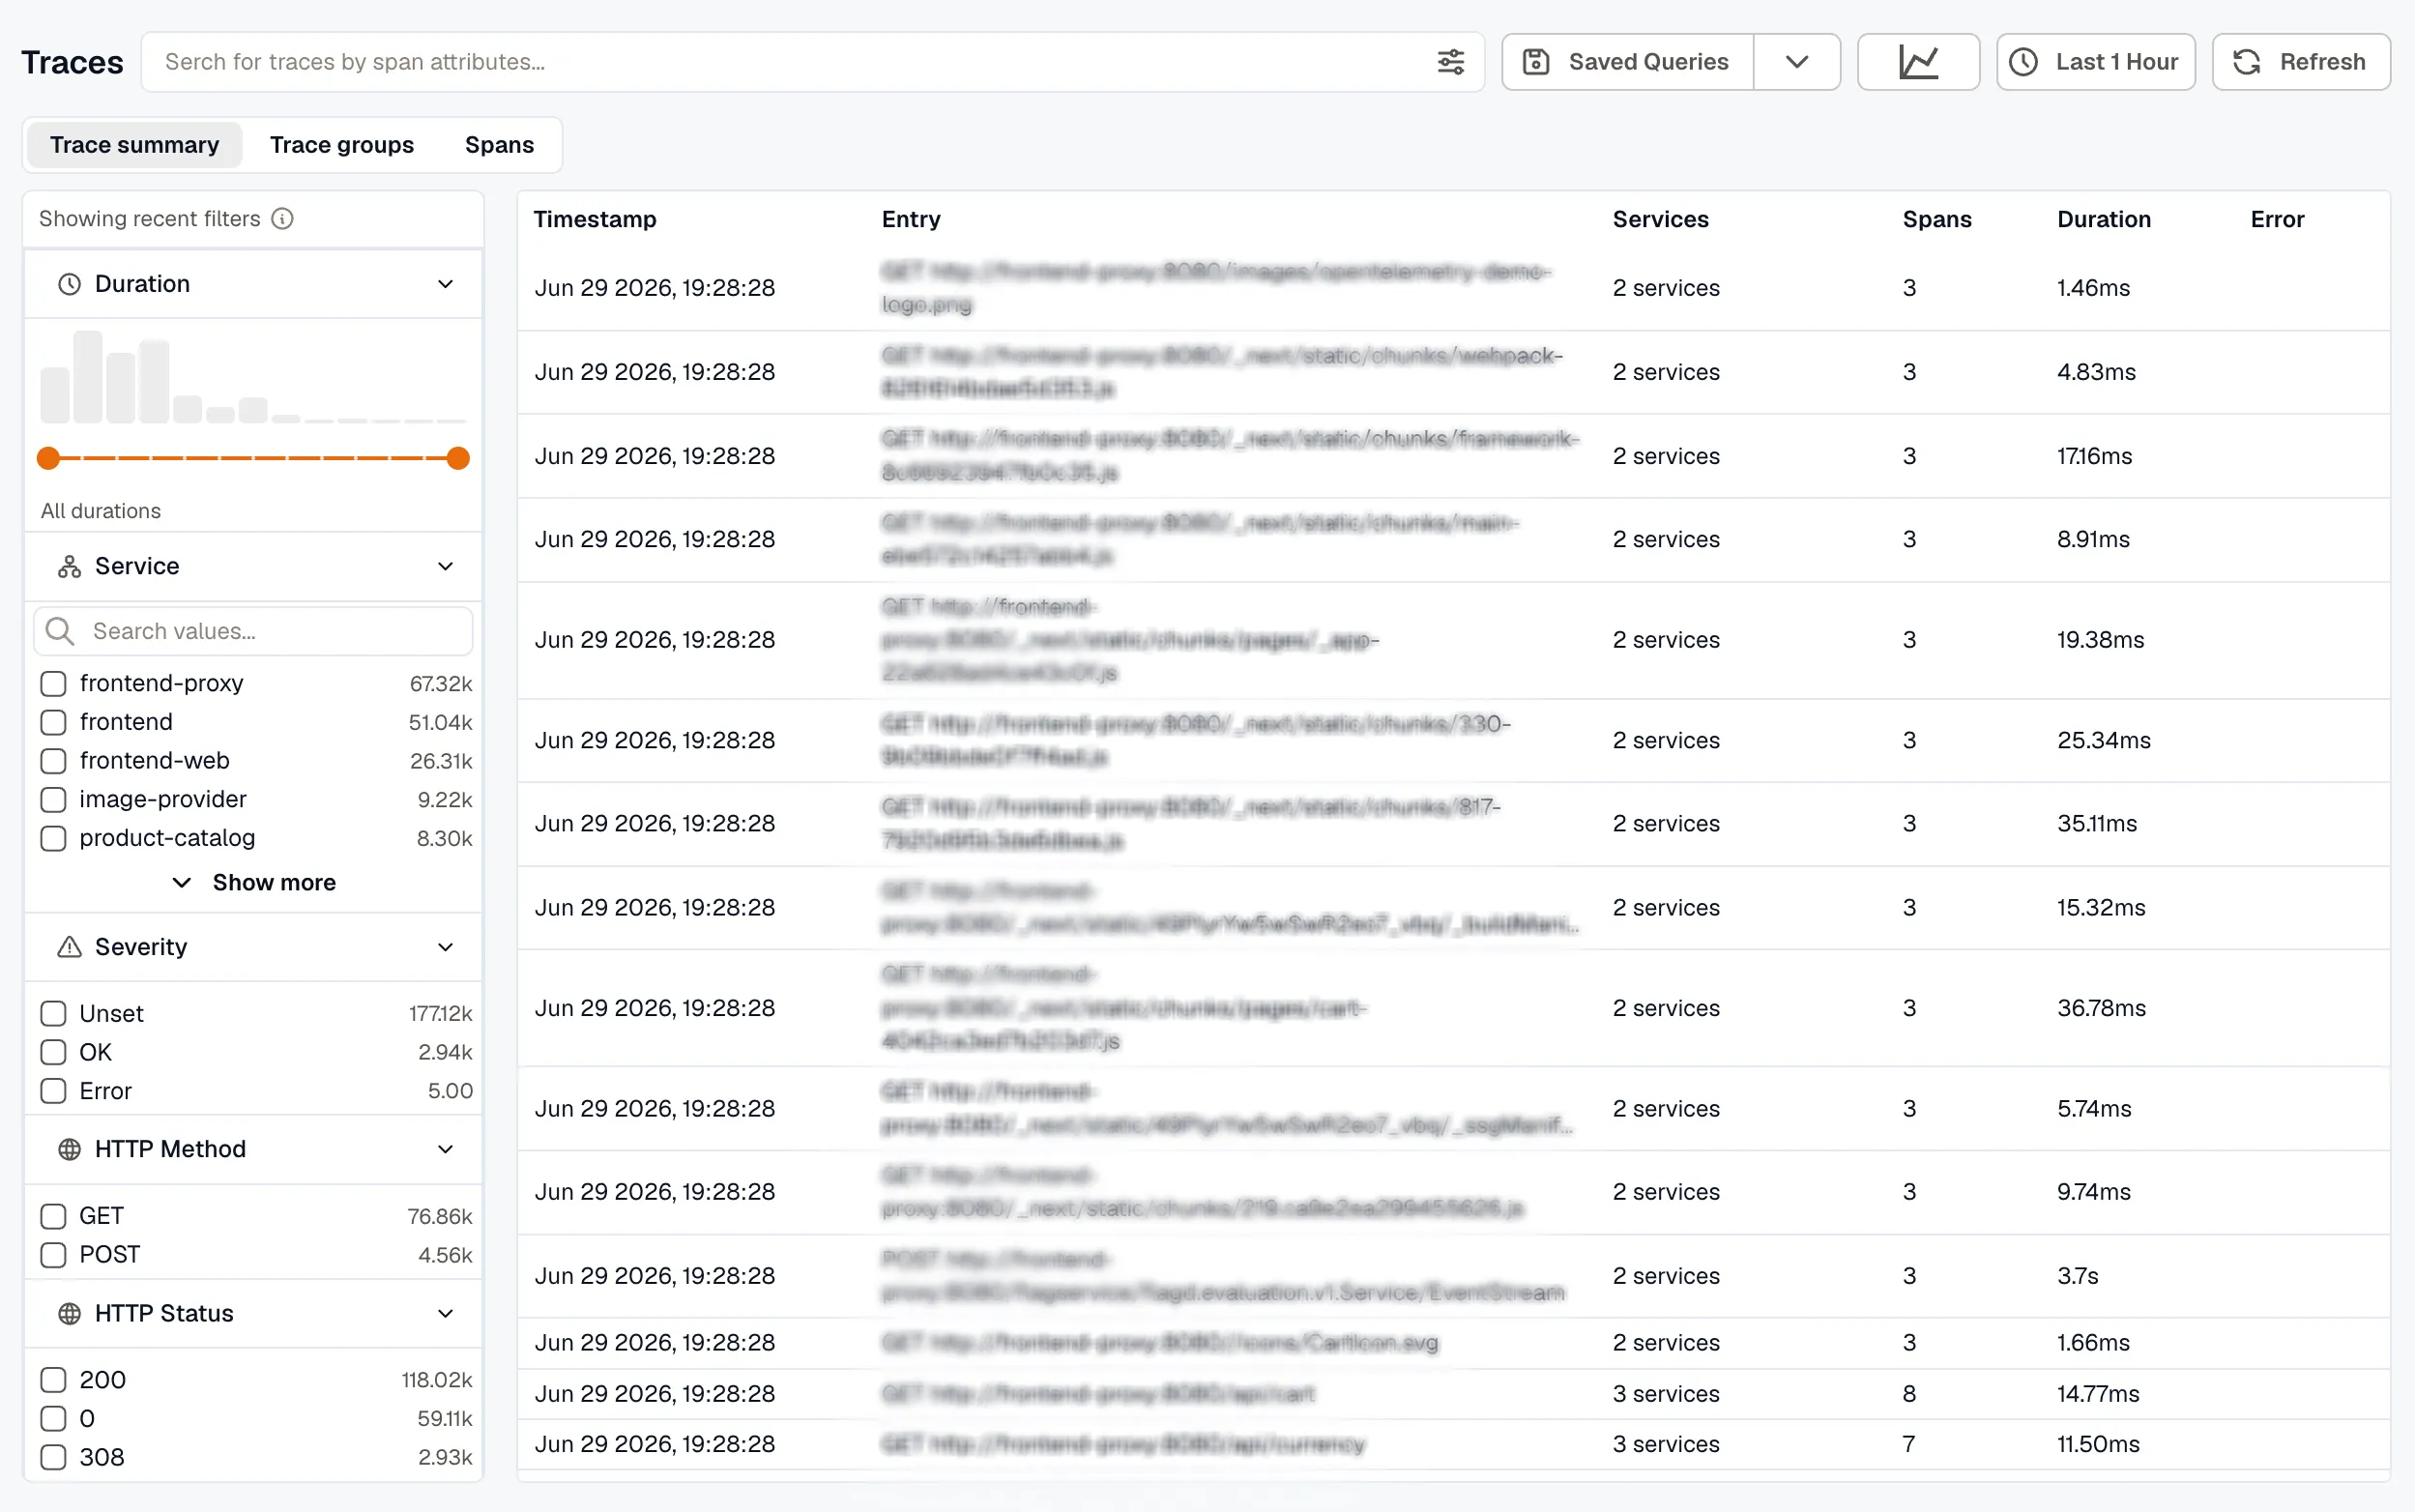
Section titled “Trace Summary”Trace Summary is the default view. It groups spans into complete traces, giving you a higher-level view of end-to-end request journeys. Each row represents a single trace, showing its entry point, number of services, spans involved, total duration, and any errors.
Trace Groups
Section titled “Trace Groups”Trace Groups rolls traces up by entry point — one row per (service, root operation) — so you can see which endpoints drive your traffic, latency, and errors at a glance. Each row shows:
- Entry point — the root service and operation
- Traces — number of traces for that entry point
- Spans (avg) — average spans per trace
- Entities (avg) — average number of services involved per trace (hover for the per-service breakdown)
- p95 — 95th-percentile trace duration
- Errors — number of traces with errors
- Trend — a sparkline of trace volume over the window (hover for per-bucket counts)
Filter the groups from the left panel by entry operation, service, and duration.
Drilling into a group
Section titled “Drilling into a group”Click a group row to open its drill-down drawer. The drawer shows the group’s metrics across the top, then the list of traces that belong to it. From here you can:
- Filter the group’s traces by span attributes using the drawer’s search bar.
- Scroll the list — it pages automatically as you reach the bottom.
- Open any trace — click a row to open its full Trace Detail stacked on top of the drawer. Closing it returns you to the group; closing the group returns you to the list.
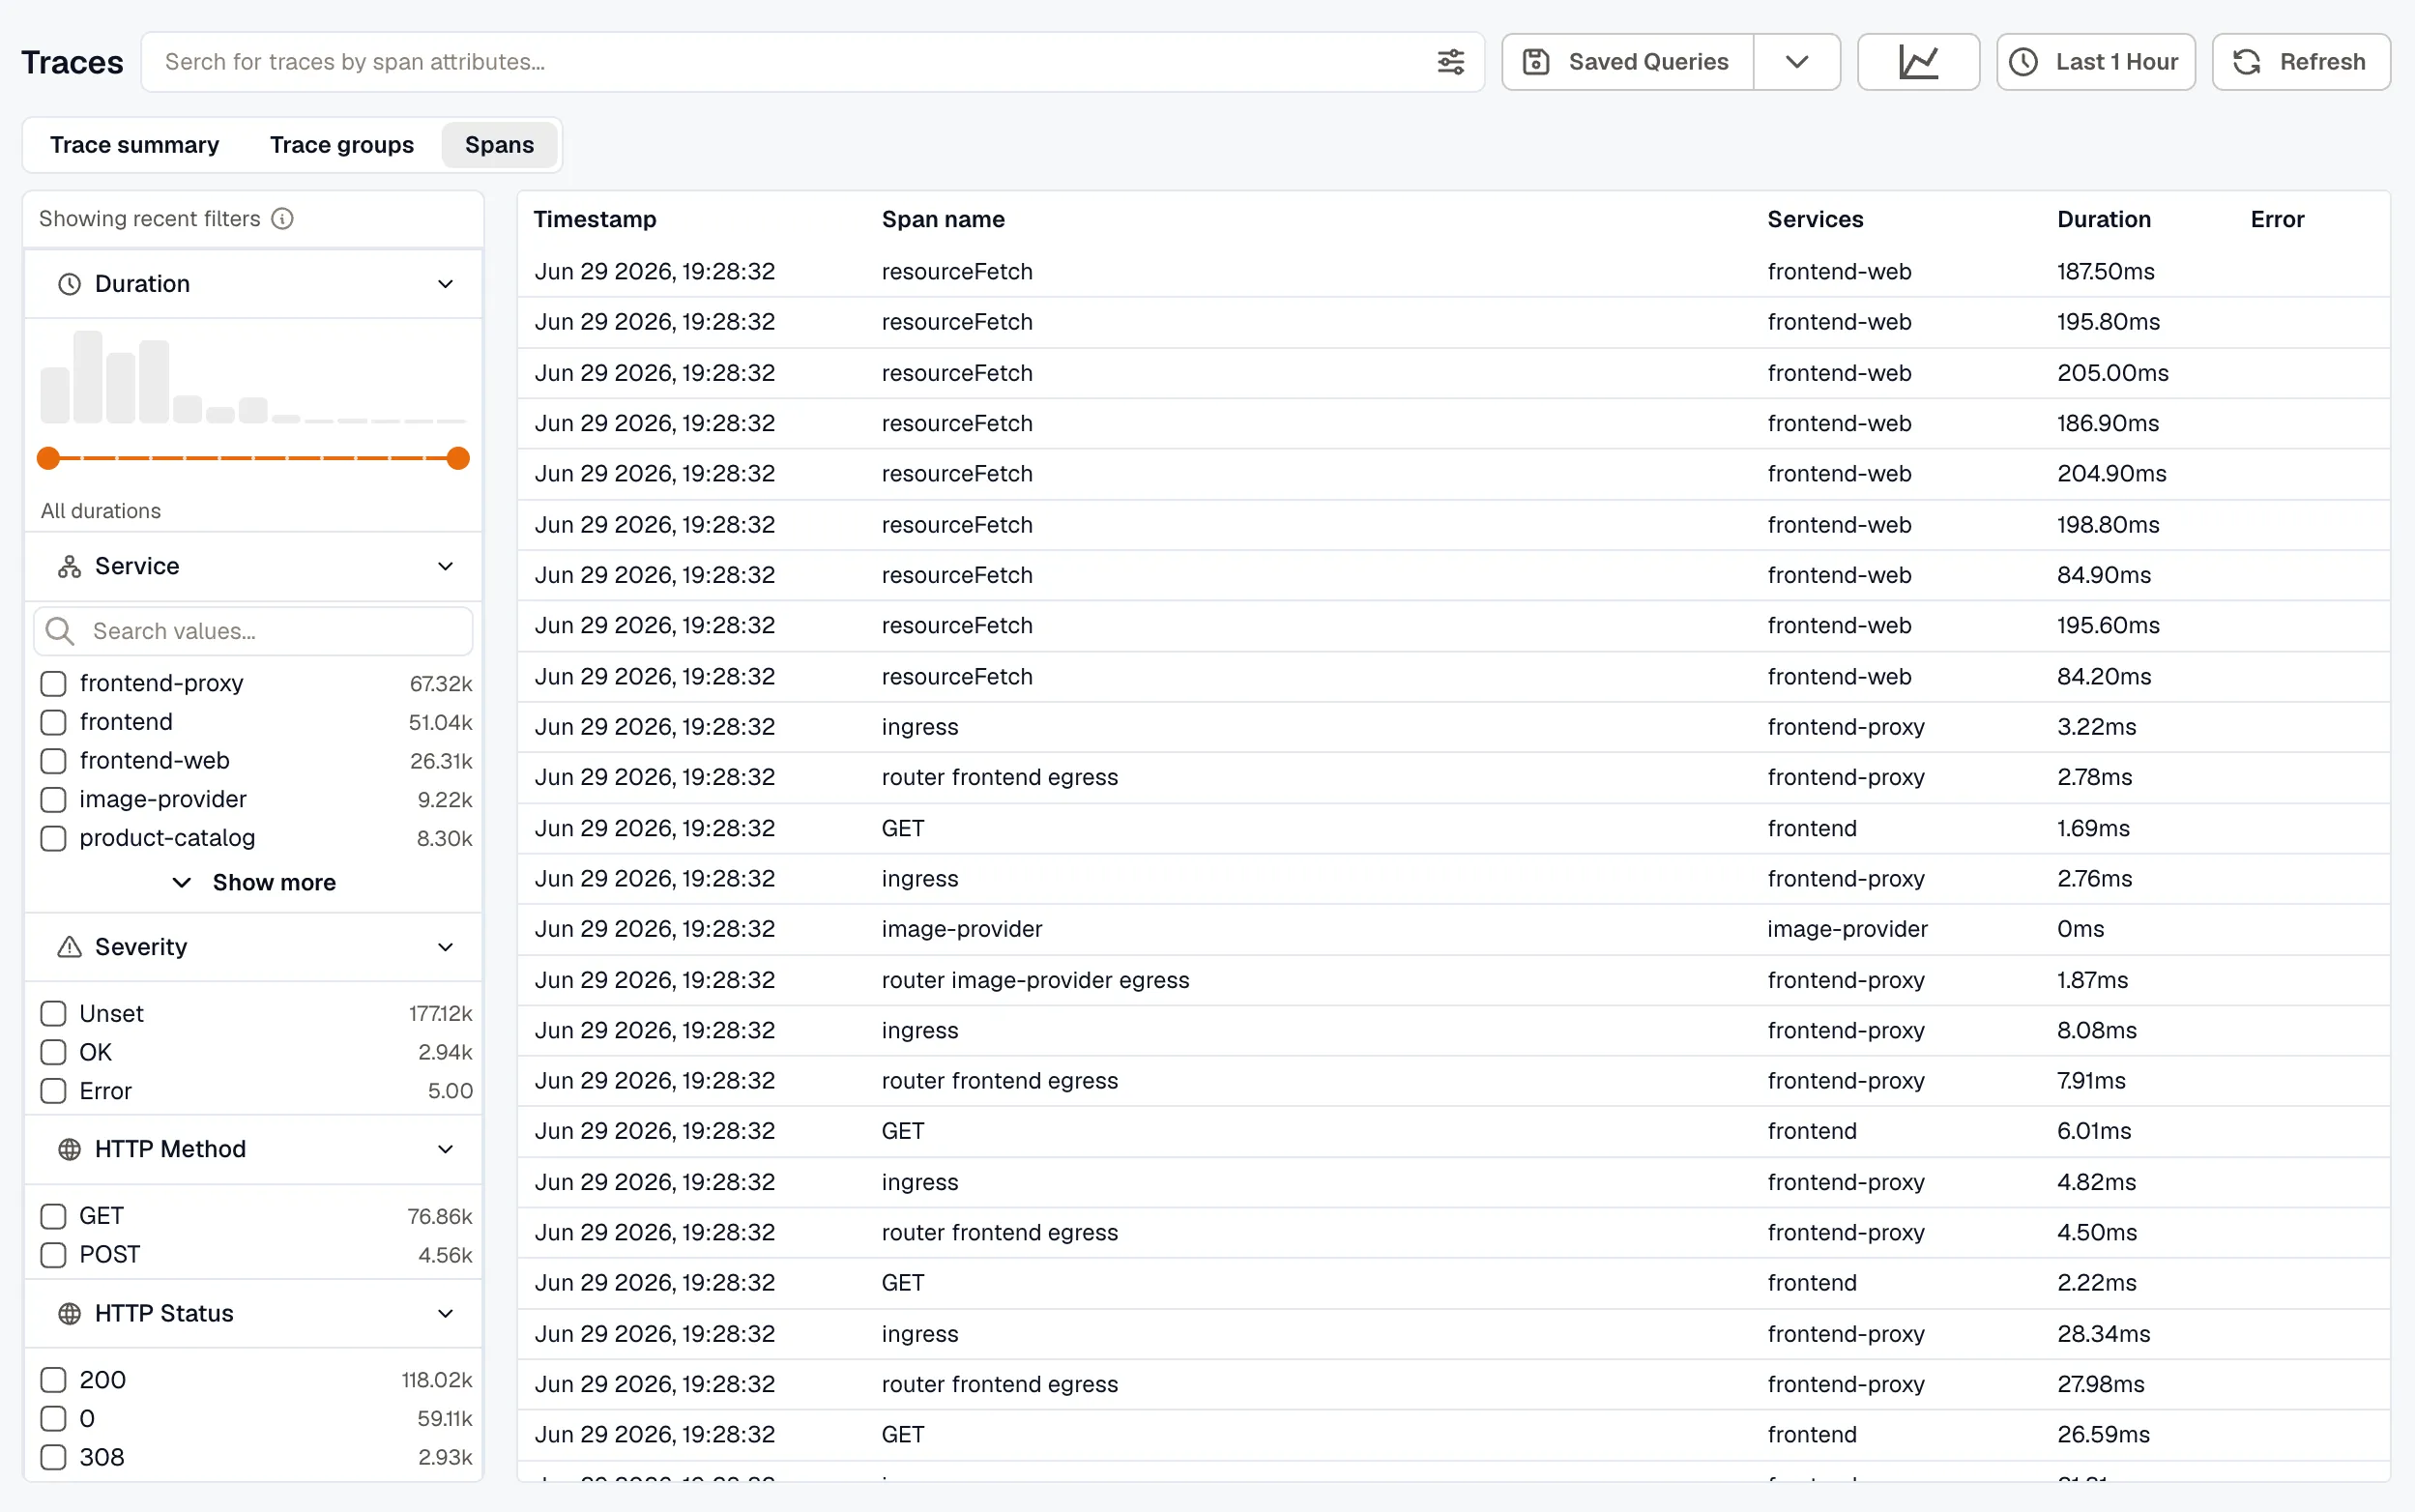
The Spans view lists every individual span captured within the selected time range and active filters. Each row displays Timestamp, Span Name, Services, Duration, and Error.
This view is best when you need the most granular look at tracing activity. To isolate errors, add a Severity → Error filter from the sidebar.
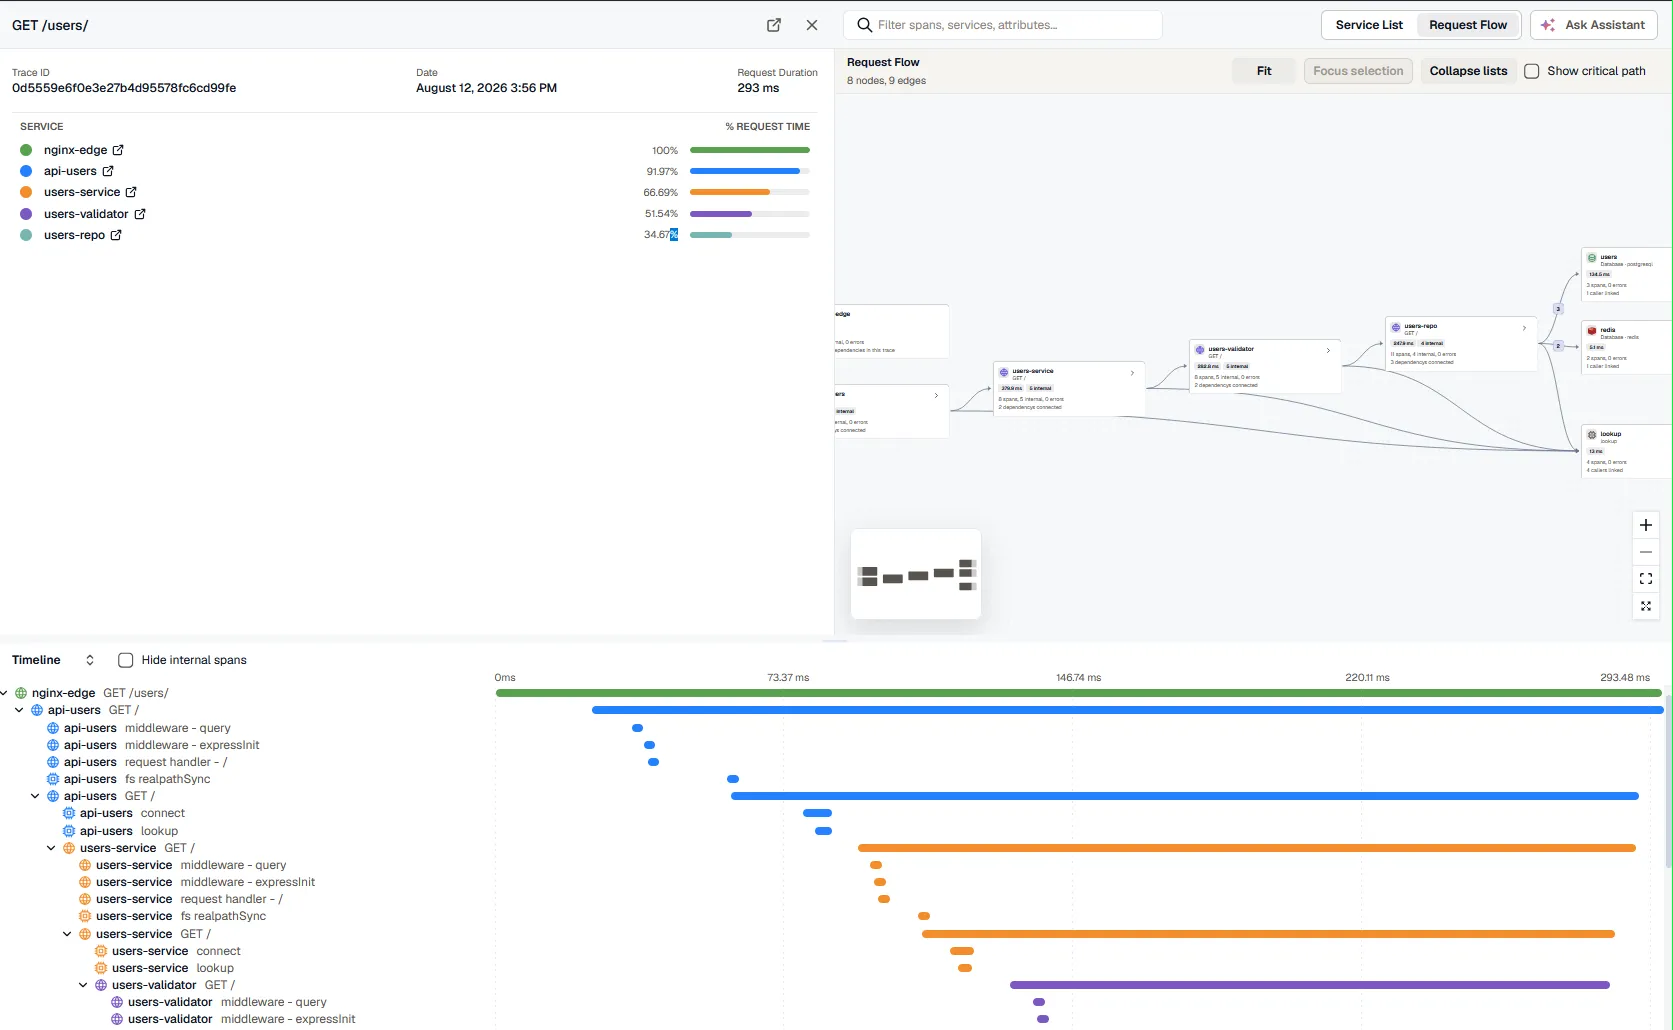
Open a Trace
Section titled “Open a Trace”Select a trace or span from any result view to open it in Trace Detail, where you inspect the timeline waterfall, per-span attributes, and the Service List, Request Flow, and AI Flow views.