

Difference View
Difference View compares two time windows of the same service and profile type — the view to reach for right after a deploy, a config change, or a traffic shift, when the question is “did that make things better or worse?” instead of “what does this look like right now?”
Set up the comparison
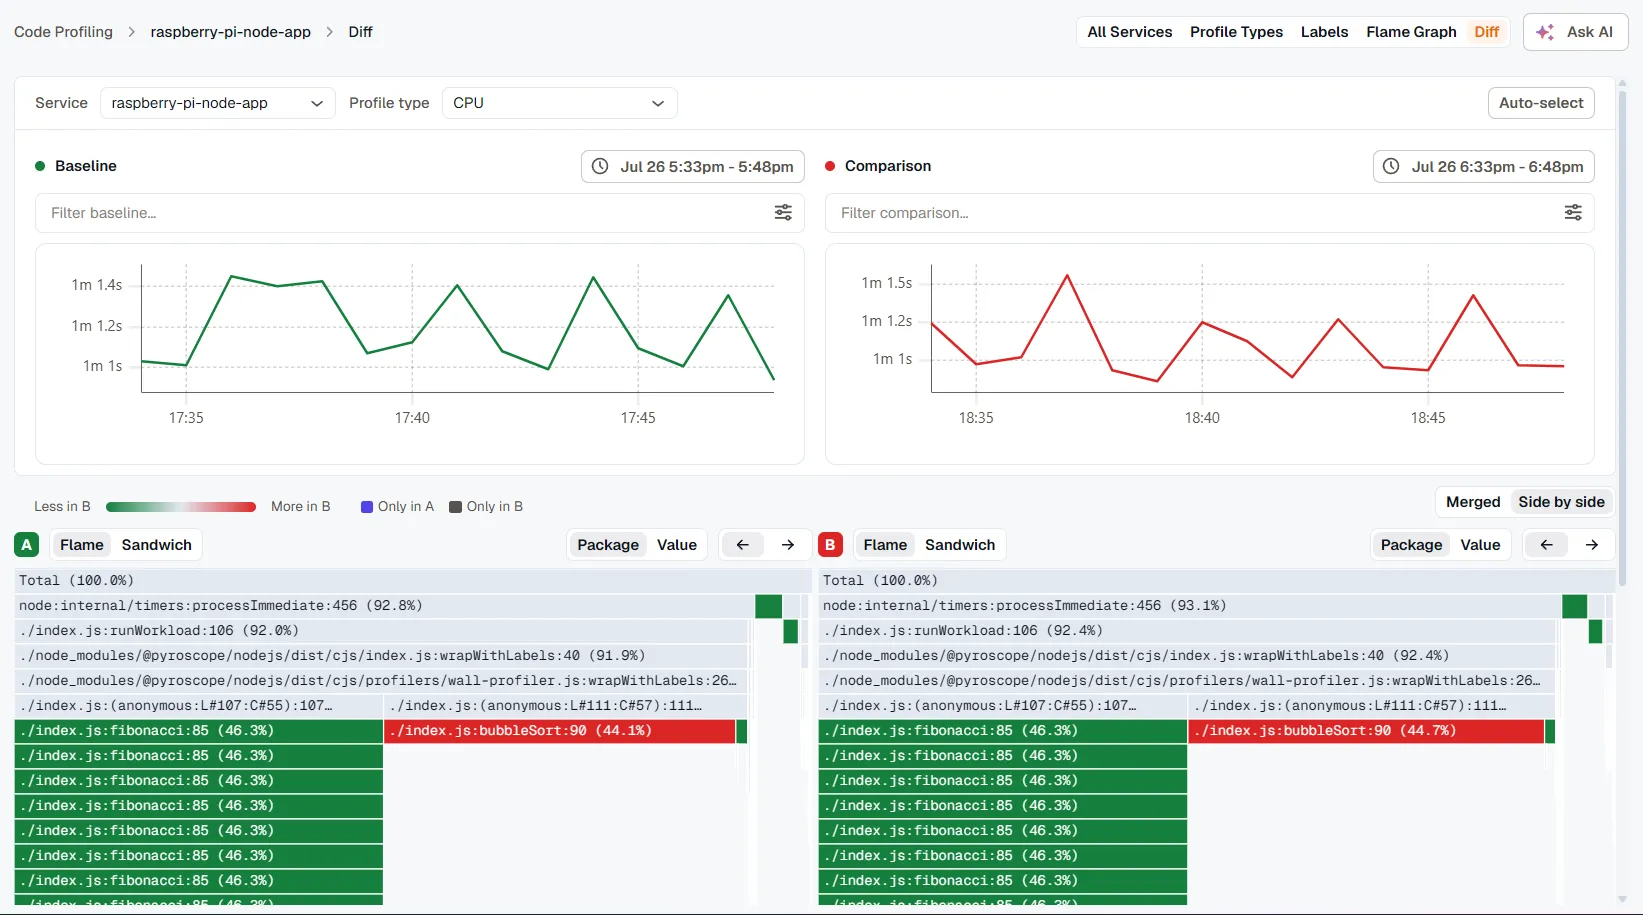
Section titled “Set up the comparison”A Service and Profile type selector sits at the top, shared by both windows. Below it, two independent panels:
- Baseline (green) — the “before” window.
- Comparison (red) — the “after” window.
Each panel has its own time-range picker, its own label filters, and its own mini chart, so baseline and comparison can come from genuinely different moments — different days, different deploys, whatever you’re comparing. Click Auto-select for a reasonable default: the last 15 minutes as the comparison window, and a 15-minute window from about an hour ago as the baseline.
Merged vs. side by side
Section titled “Merged vs. side by side”A toggle switches the bottom panel between two ways of looking at the same comparison.
Merged
Section titled “Merged”One flame graph, built from a single merged tree, colored by change: green frames got cheaper, red frames got more expensive, gray frames didn’t move. The function table next to it adds Baseline %, Comparison %, and Δ columns — percentage-point deltas, so a function’s cost is comparable even if the two windows aren’t the same length.
This is the fastest way to get a single answer: scan for the widest red frame.
Side by side
Section titled “Side by side”Two independent flame graphs, A (baseline) and B (comparison), each showing its own full 100% breakdown rather than one merged tree. Hover a frame in either one and the same function highlights in the other, with a tooltip showing self time and percentage on both sides plus the delta between them.
Reach for this when the merged view’s single tree hides something — a function that moved depth in the call stack, for instance, or one that only exists in one of the two windows. The legend calls those out directly: teal/red for less-or-more in the same function, and separate swatches for “only in A” and “only in B.”
Related
Section titled “Related”- Flame Graph — the single-window view Difference View builds on.
- Labels — the same filter mechanism, applied independently to each window here.