

Monitors
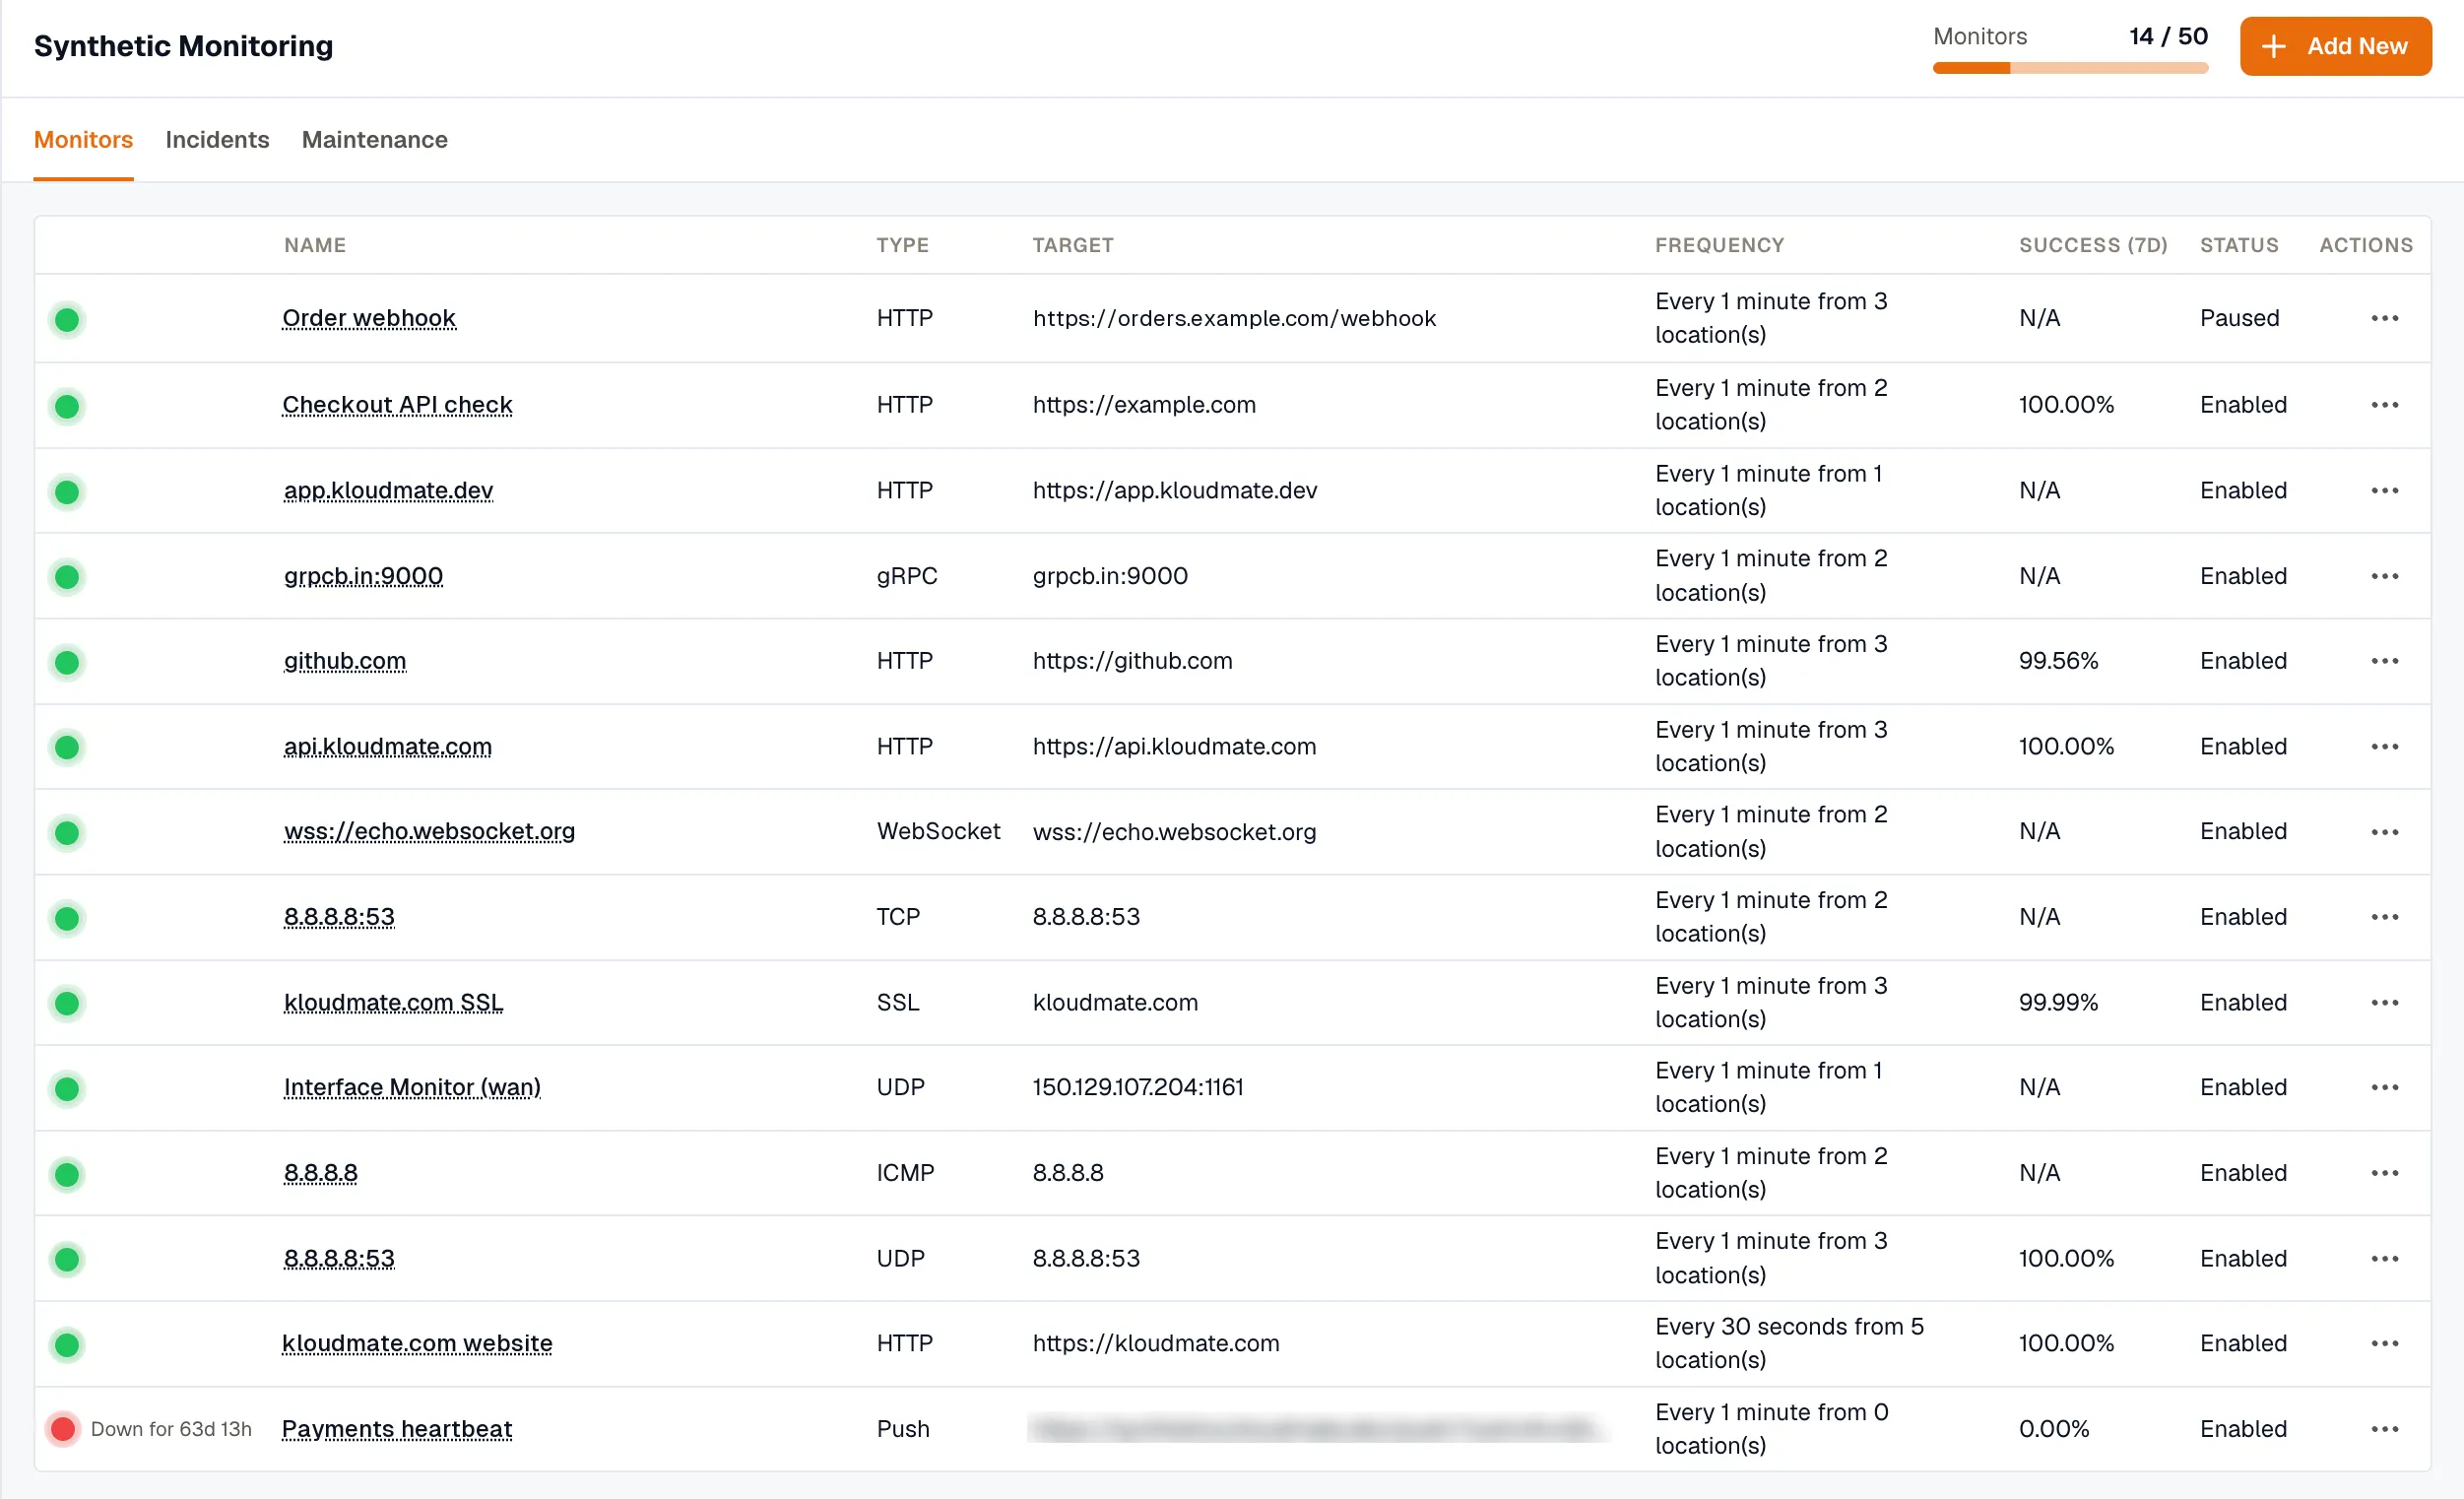
The Monitors tab lists all monitors in the current workspace, with key status information for each one.
When creating or editing any monitor (except Push), click Test next to Save Monitor to run the check once from your selected locations and preview the result before you save.
Monitors Overview
Section titled “Monitors Overview”- Name: The user-defined name of each monitor, for easy identification.
- Type: Indicates the monitor type (e.g., HTTP, SSL, DNS, TCP, UDP, gRPC, WebSocket, ICMP, Push).
- Target: Shows the endpoint or host the monitor is targeting (e.g., URL, host:port, domain).
- Frequency: Displays the check interval and number of monitoring locations used for each check.
- Success (7d): Shows the success percentage of the monitor over the past 7 days.
- Status: Indicates whether the monitor is Enabled or Paused. The colored dot next to each row shows its current health (up or down), separate from this enabled/paused state.
Monitor Details Page
Section titled “Monitor Details Page”Clicking any monitor in the list opens its details page, with full performance and history information.
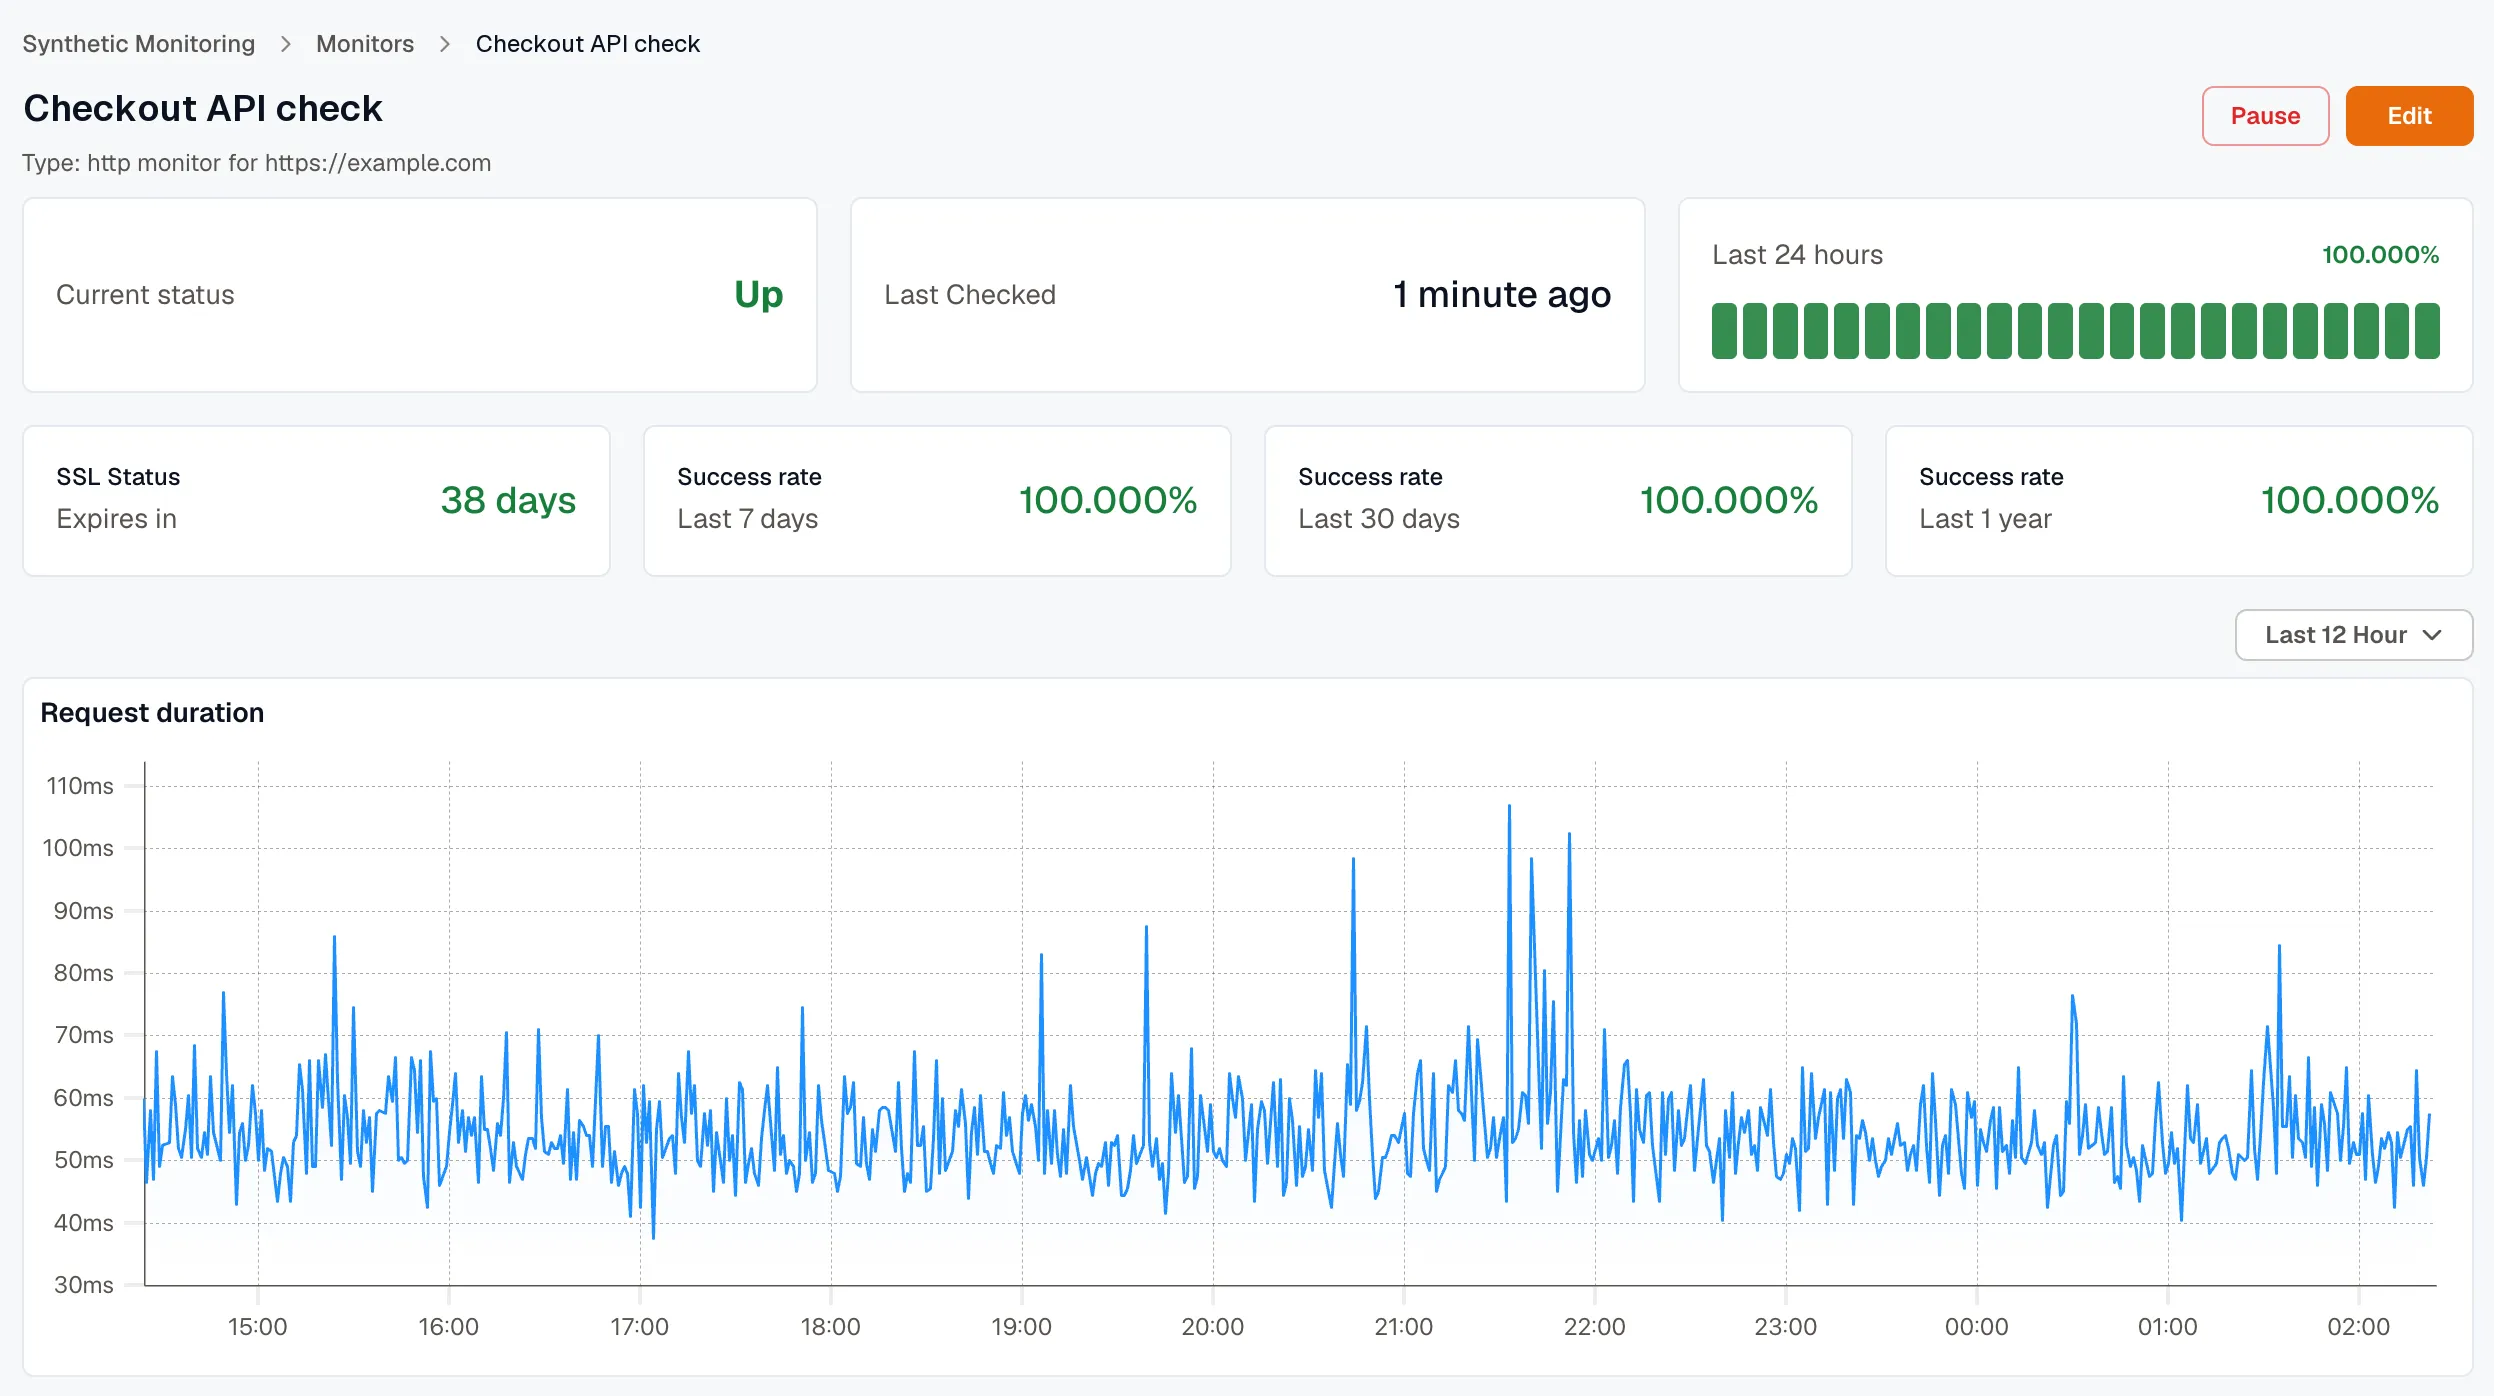
Details Page Sections - Status
Current real-time status of the monitor with visual indicators.
- Success Rate Detailed success rate metrics over various time periods.
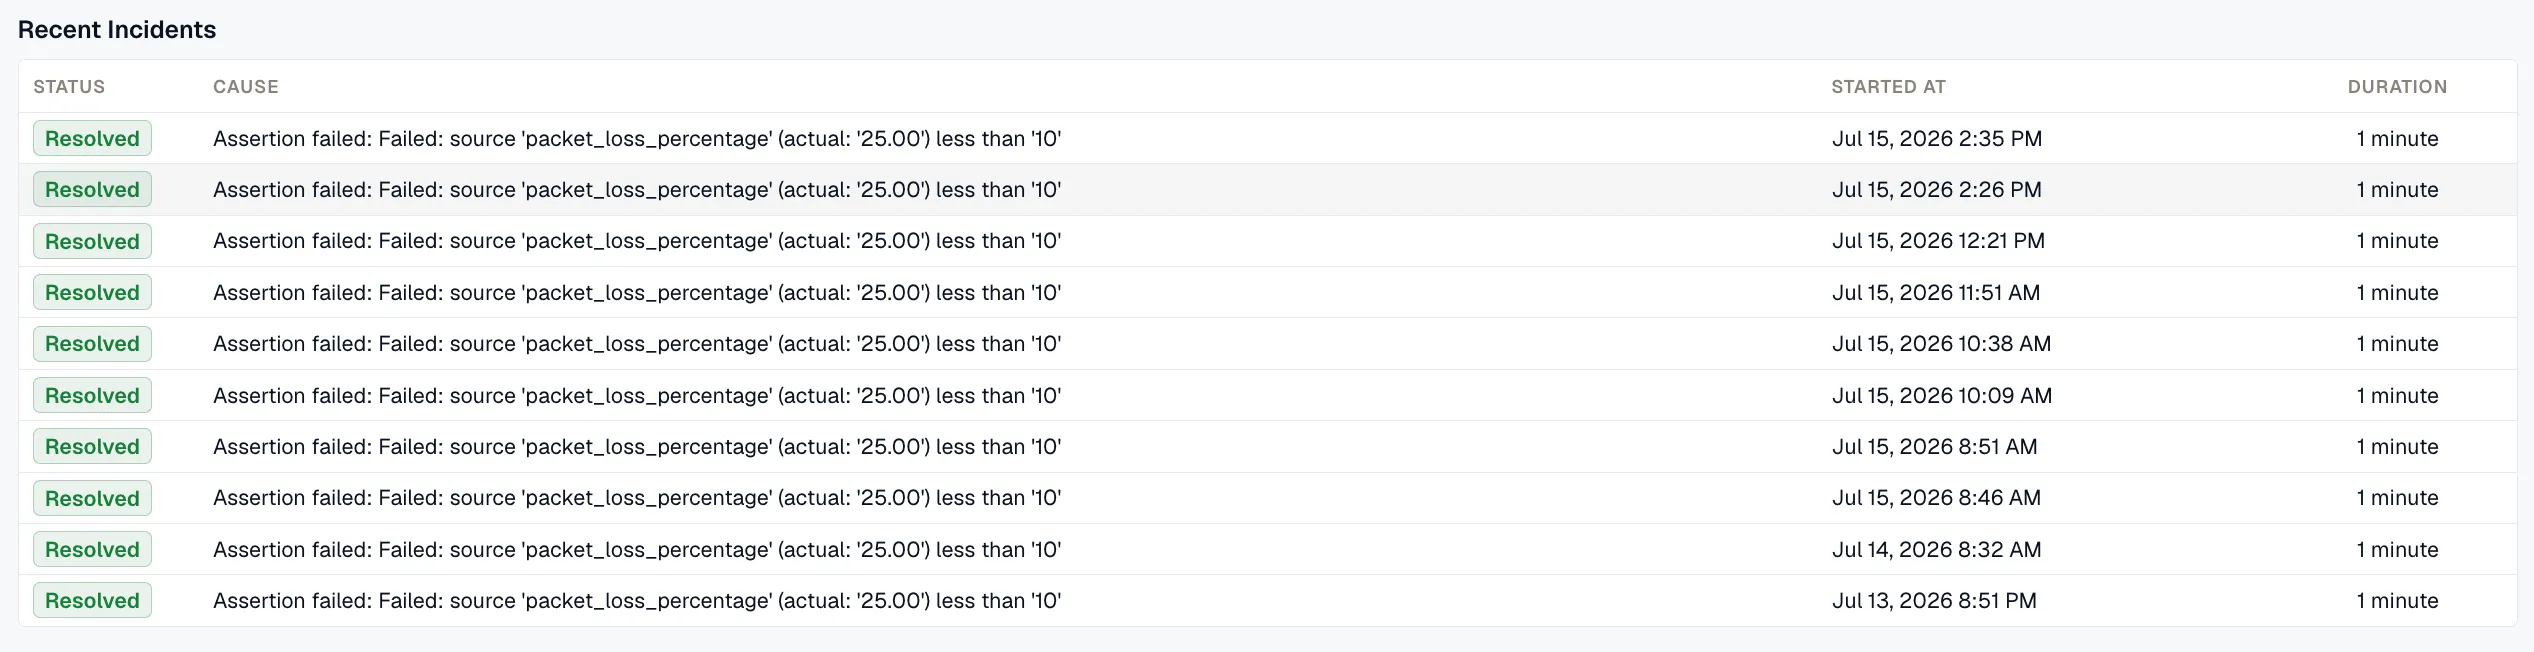
- Recent Incidents History of downtime incidents with timestamps and durations.
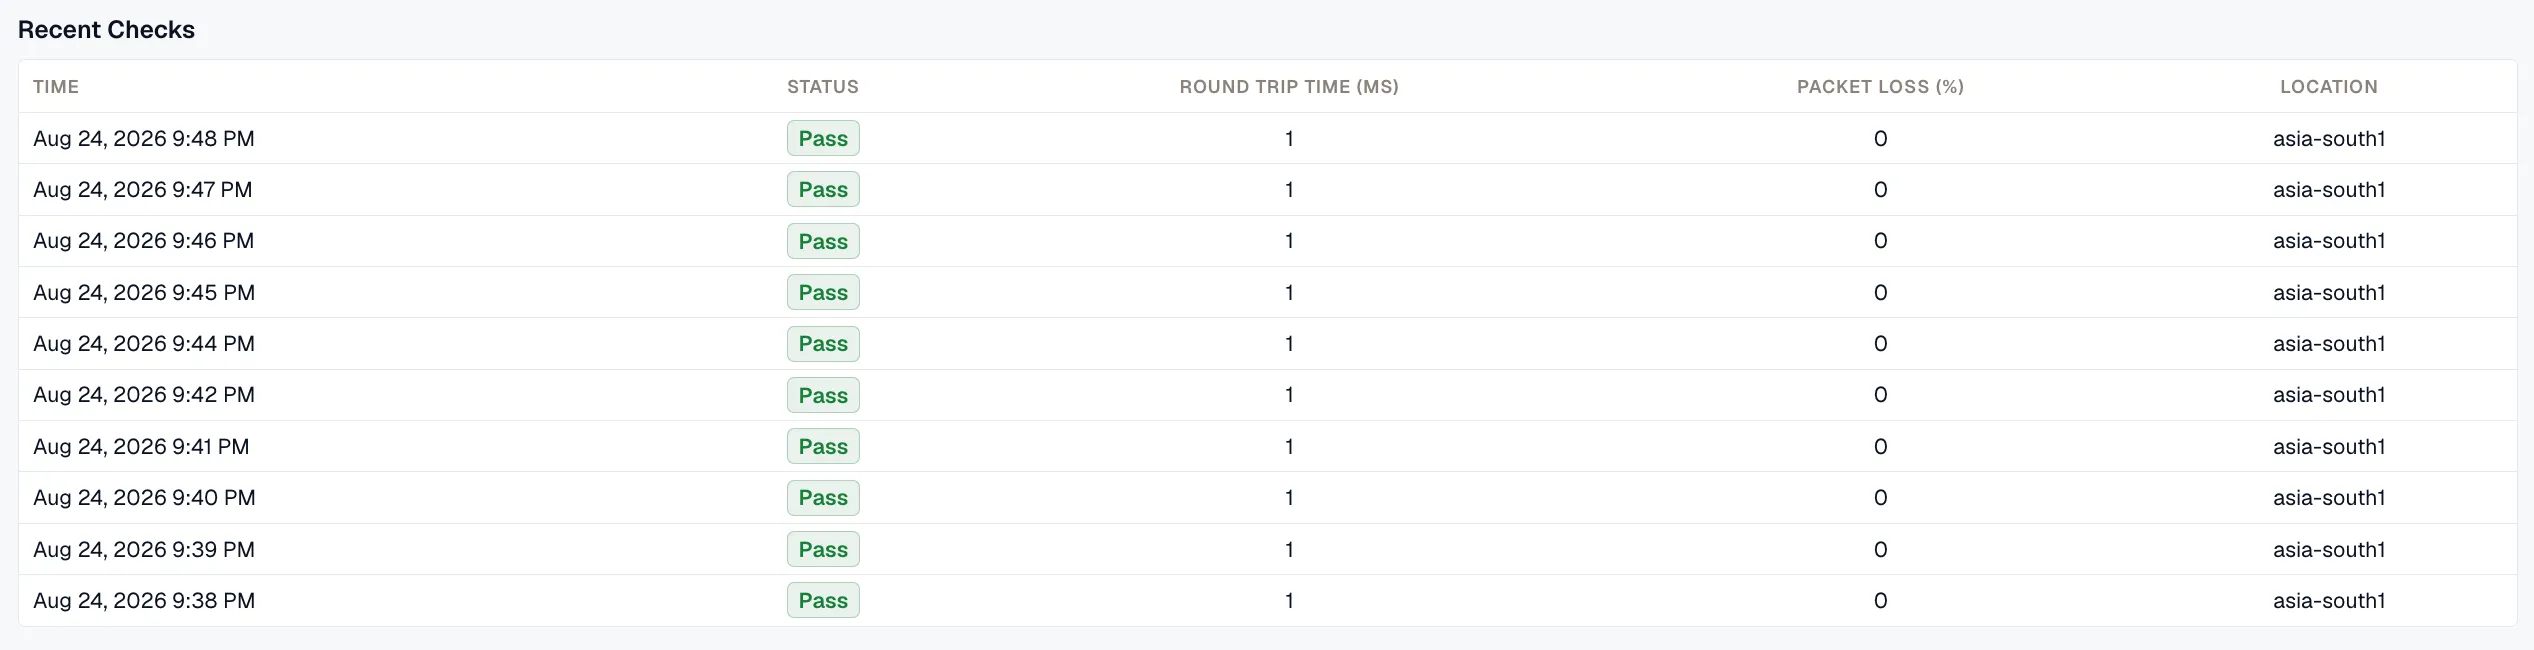
- Recent Checks
Log of the most recent check executions with results and timings.
Downtime Rules and Flapping Control
Section titled “Downtime Rules and Flapping Control”Every monitor runs its checks from the Monitoring Locations you select. Selecting multiple locations is recommended to reduce false positives caused by an issue local to a single location.
Downtime Rules controls when a failing check actually counts as downtime. Set Failed checks before going down to the number of consecutive failed checks (about 30 seconds apart) required before the monitor is marked down — for example, “2 checks in a row” means the monitor only goes down after two failures back to back. This filters out flapping, so a single transient blip or timeout doesn’t open an incident. Failures that don’t reach this threshold are unconfirmed: they’re ignored completely and never appear in uptime, response time, or incident history.
Core Uptime and Status Metrics
Section titled “Core Uptime and Status Metrics”Metrics available to be monitored in Dashboard section. These metrics are applicable to all monitors.
| Metric Name | Type | Description | Labels |
|---|---|---|---|
| kloudmate_synthetic_check_success | Gauge | Indicates if a check was successful (1) or failed (0) based on the success quorum | check_id, check_name, check_type, target, workspace_id |
| kloudmate_synthetic_check_status | Gauge | Indicates if a check was successful (1) or failed (0) for a specific location | check_id, check_name, check_type, target, workspace_id, location |