SLO Detail
The SLO detail page is where you read compliance and manage burn-rate alerts for a single SLO. It lives at /<workspaceId>/slos/<id> and is reached from the SLOs list, the breached cards on the Overview hub, the service detail Reliability tab, or the Linked SLOs panel on incident detail.
Page layout
Section titled “Page layout”The page is composed of, top to bottom:
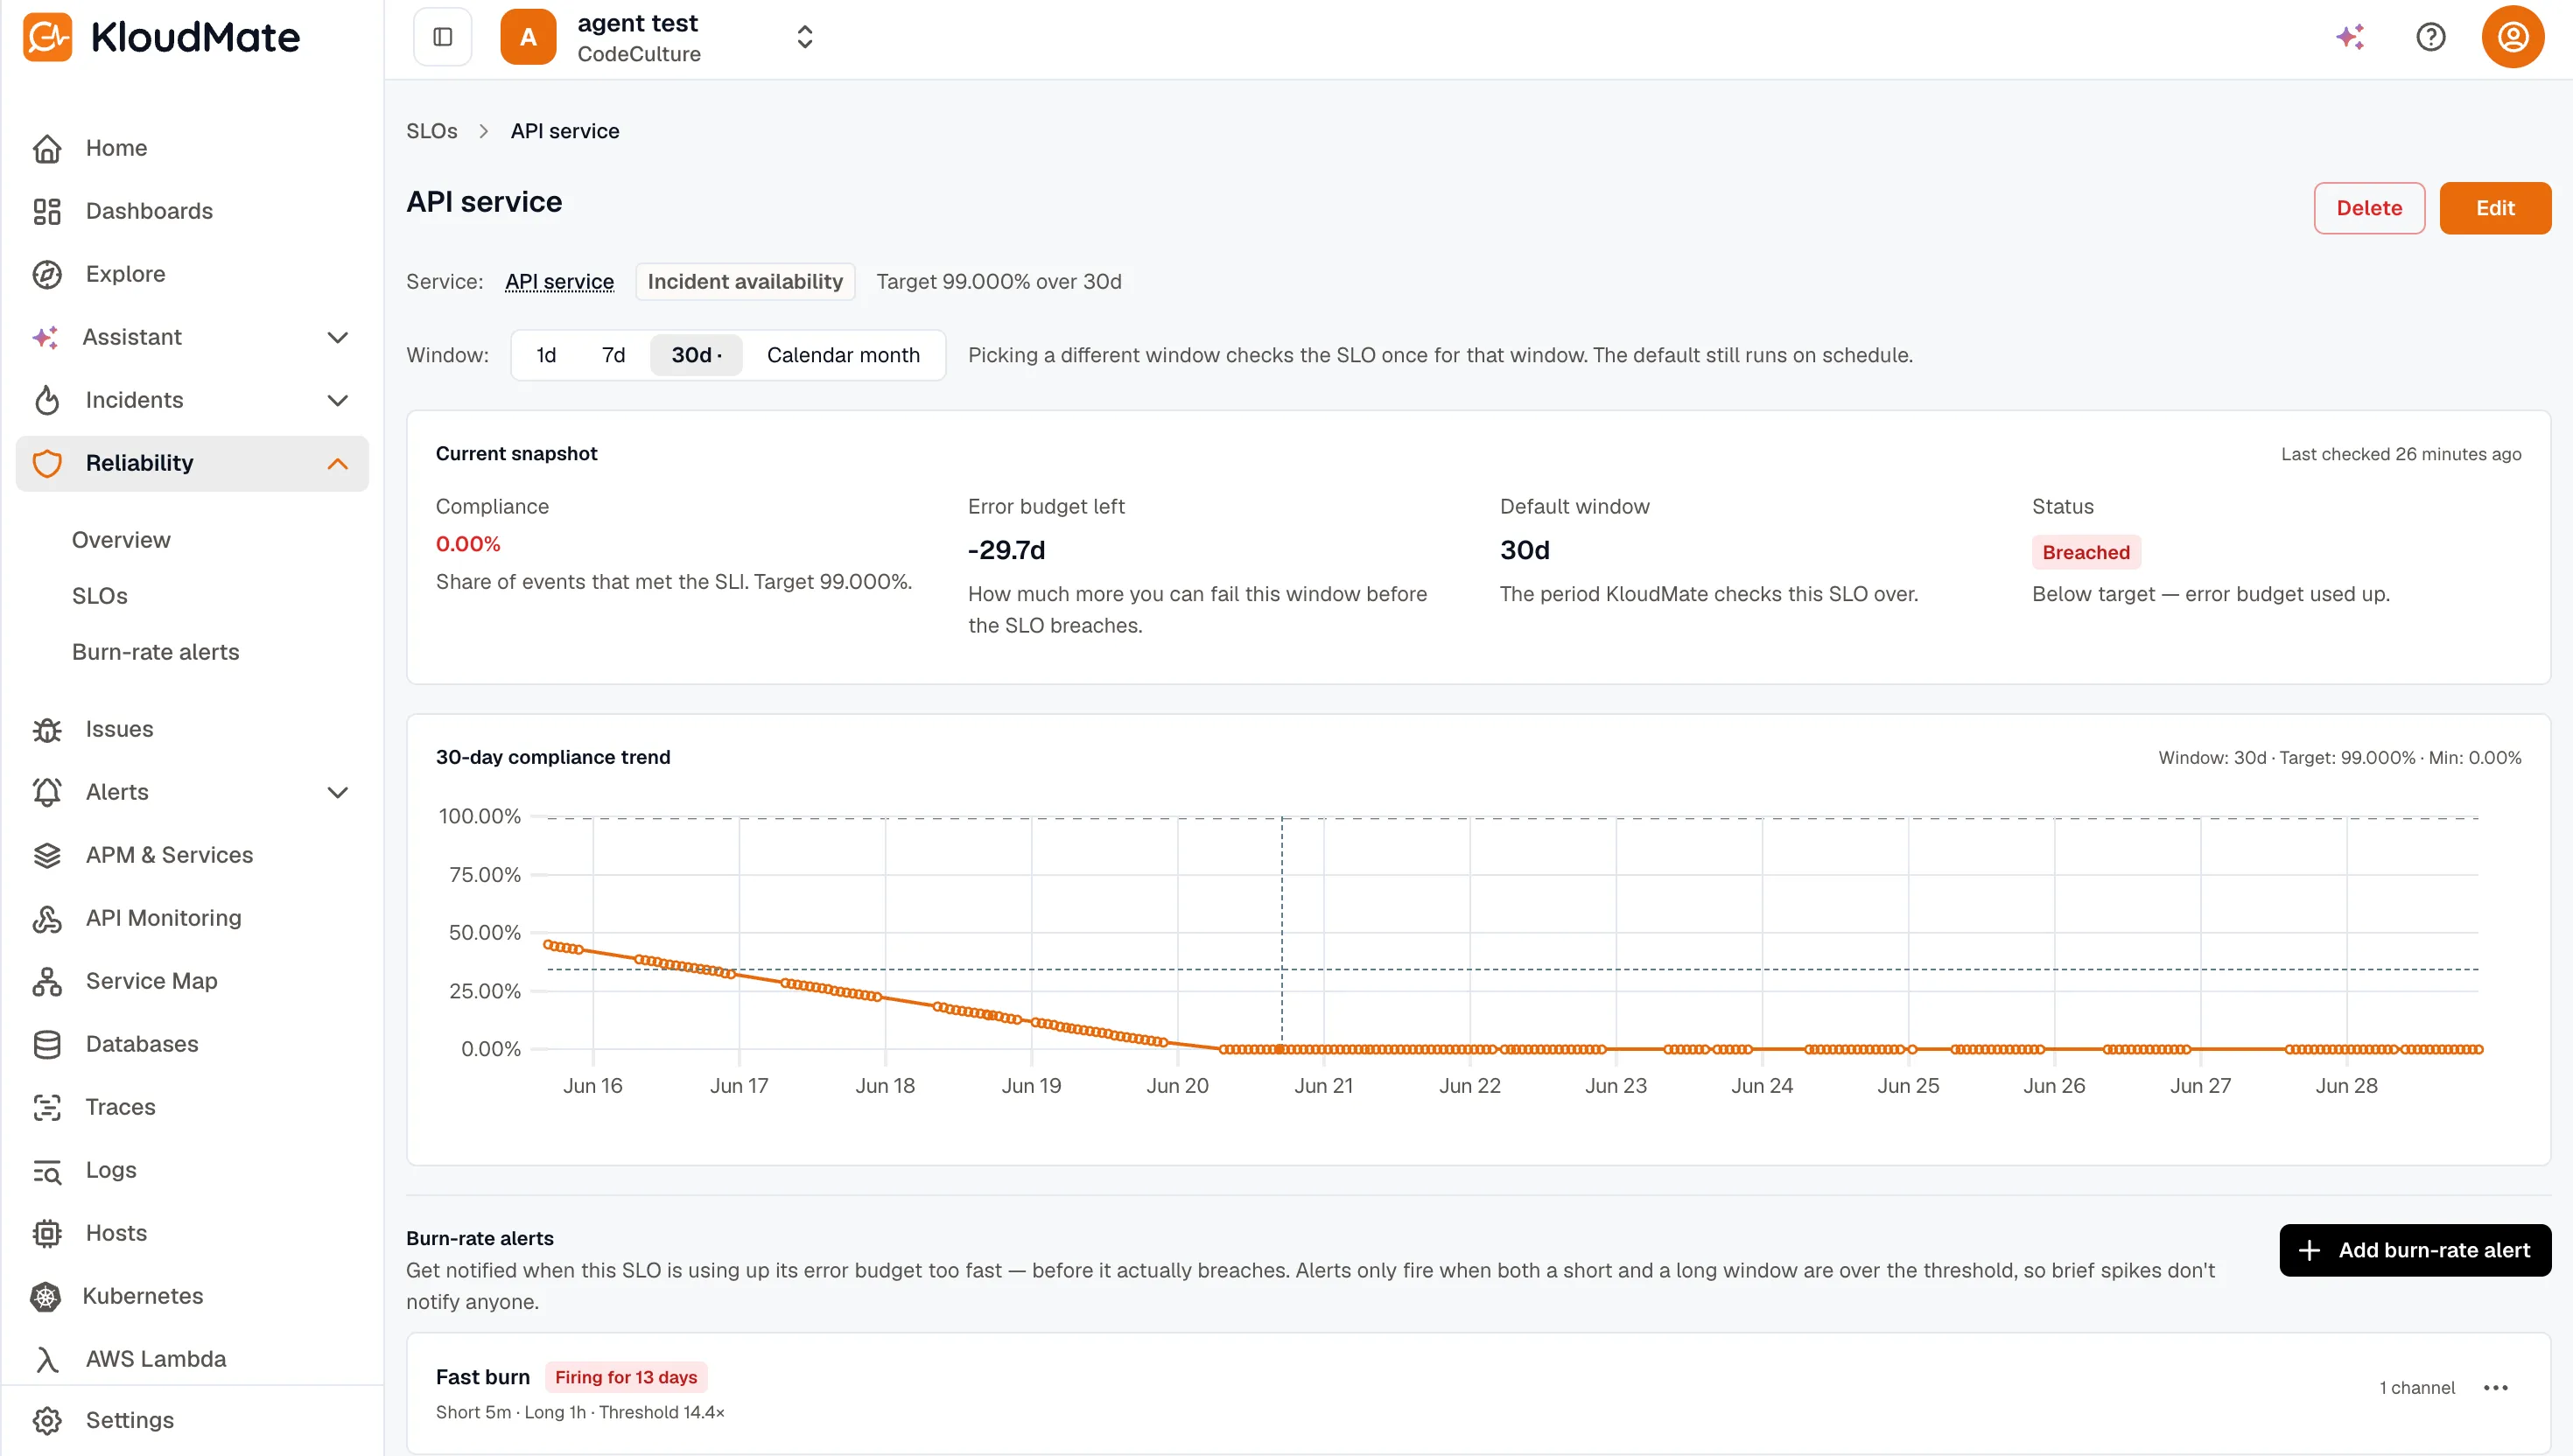
Header
Section titled “Header”Name, SLI kind chip, target / window summary, and a Disabled chip if applicable. For an Incident availability SLO the header also shows a Service link (a soft-deleted service still renders, suffixed “(deleted)”); every other kind is workspace-level and shows no service. Admins see Edit and Delete buttons.
Window picker
Section titled “Window picker”A segmented toggle: 1d / 7d / 30d / Calendar month. The SLO’s default window is bold and tooltipped as “Default window — refreshed hourly.”
Picking a different window kicks off a one-off re-evaluation — the SLO’s scheduled evaluations keep using the default. A caption next to the picker reminds you:
e.g. > Picking a different window checks the SLO once for that window. The default still runs on schedule.
Current snapshot card
Section titled “Current snapshot card”A header strip shows “Current snapshot” on the left and “Last checked X ago” (or “Not checked yet”) on the right. Below it, four metric stats in a responsive grid:
- Compliance — large, color-coded percentage. Helper text: “Share of events that met the SLI. Target X%.”
- Error budget left — how much more you can fail this window before the SLO breaches, in the SLI’s unit: a duration for the time-based kinds (incident availability, time slices, synthetic uptime), a count of events for the ratio kinds (the APM kinds and custom metric). A negative (exhausted) budget renders as e.g.
-1.4h/-3.3drather than raw seconds. - Default window — e.g.
30d. - Status —
Healthy/Breached/Not evaluatedchip with a one-line helper (e.g. “On track — within target.” or “Below target — error budget used up.”).
30-day compliance trend chart
Section titled “30-day compliance trend chart”A line chart over the last 30 days for the currently-selected window.
- Dotted points at each evaluation, so sparse data reads as a real series.
- Dashed horizontal target line for instant visual reference.
- Hover tooltip showing exact compliance % + timestamp at the cursor.
- Smart x-axis ticks — single-day data shows times (
14:30); multi-day shows dates (May 25). - Y-axis anchored from below the target to 100%, floored at 90%. Tiny drops don’t appear catastrophic, and the typical “well-above-target” case still has room.
Burn-rate alerts section
Section titled “Burn-rate alerts section”A list of every burn-rate alert configured for this SLO with its firing state. Admins see an Add burn-rate alert button and a per-alert Edit / Delete menu.
For the full preset set and form fields, see Burn-rate alerts.
Related
Section titled “Related”- Burn-rate alerts — the alerting layer over an SLO.
- Create an SLO — the wizard that produced this SLO.
- SLI kinds — what the SLI on this SLO is measuring.