

Discovery
Discovery builds a live inventory of what runs on each host or cluster. The web interface uses it to offer to instrument a service or monitor a database, instead of asking you to configure it by hand. It runs on all deployment modes.
What discovery finds
Section titled “What discovery finds”The agent finds two kinds of things:
- Application services, classified by runtime (Java, .NET, Node.js, Python, PHP, Go, and Ruby), with framework and web-server hints (nginx, Apache, and php-fpm) where they apply.
- Databases and middleware running locally, such as PostgreSQL, MySQL, Redis, and MongoDB.
For each service, discovery records how it is managed and which ports it listens on.
Where discovered services appear
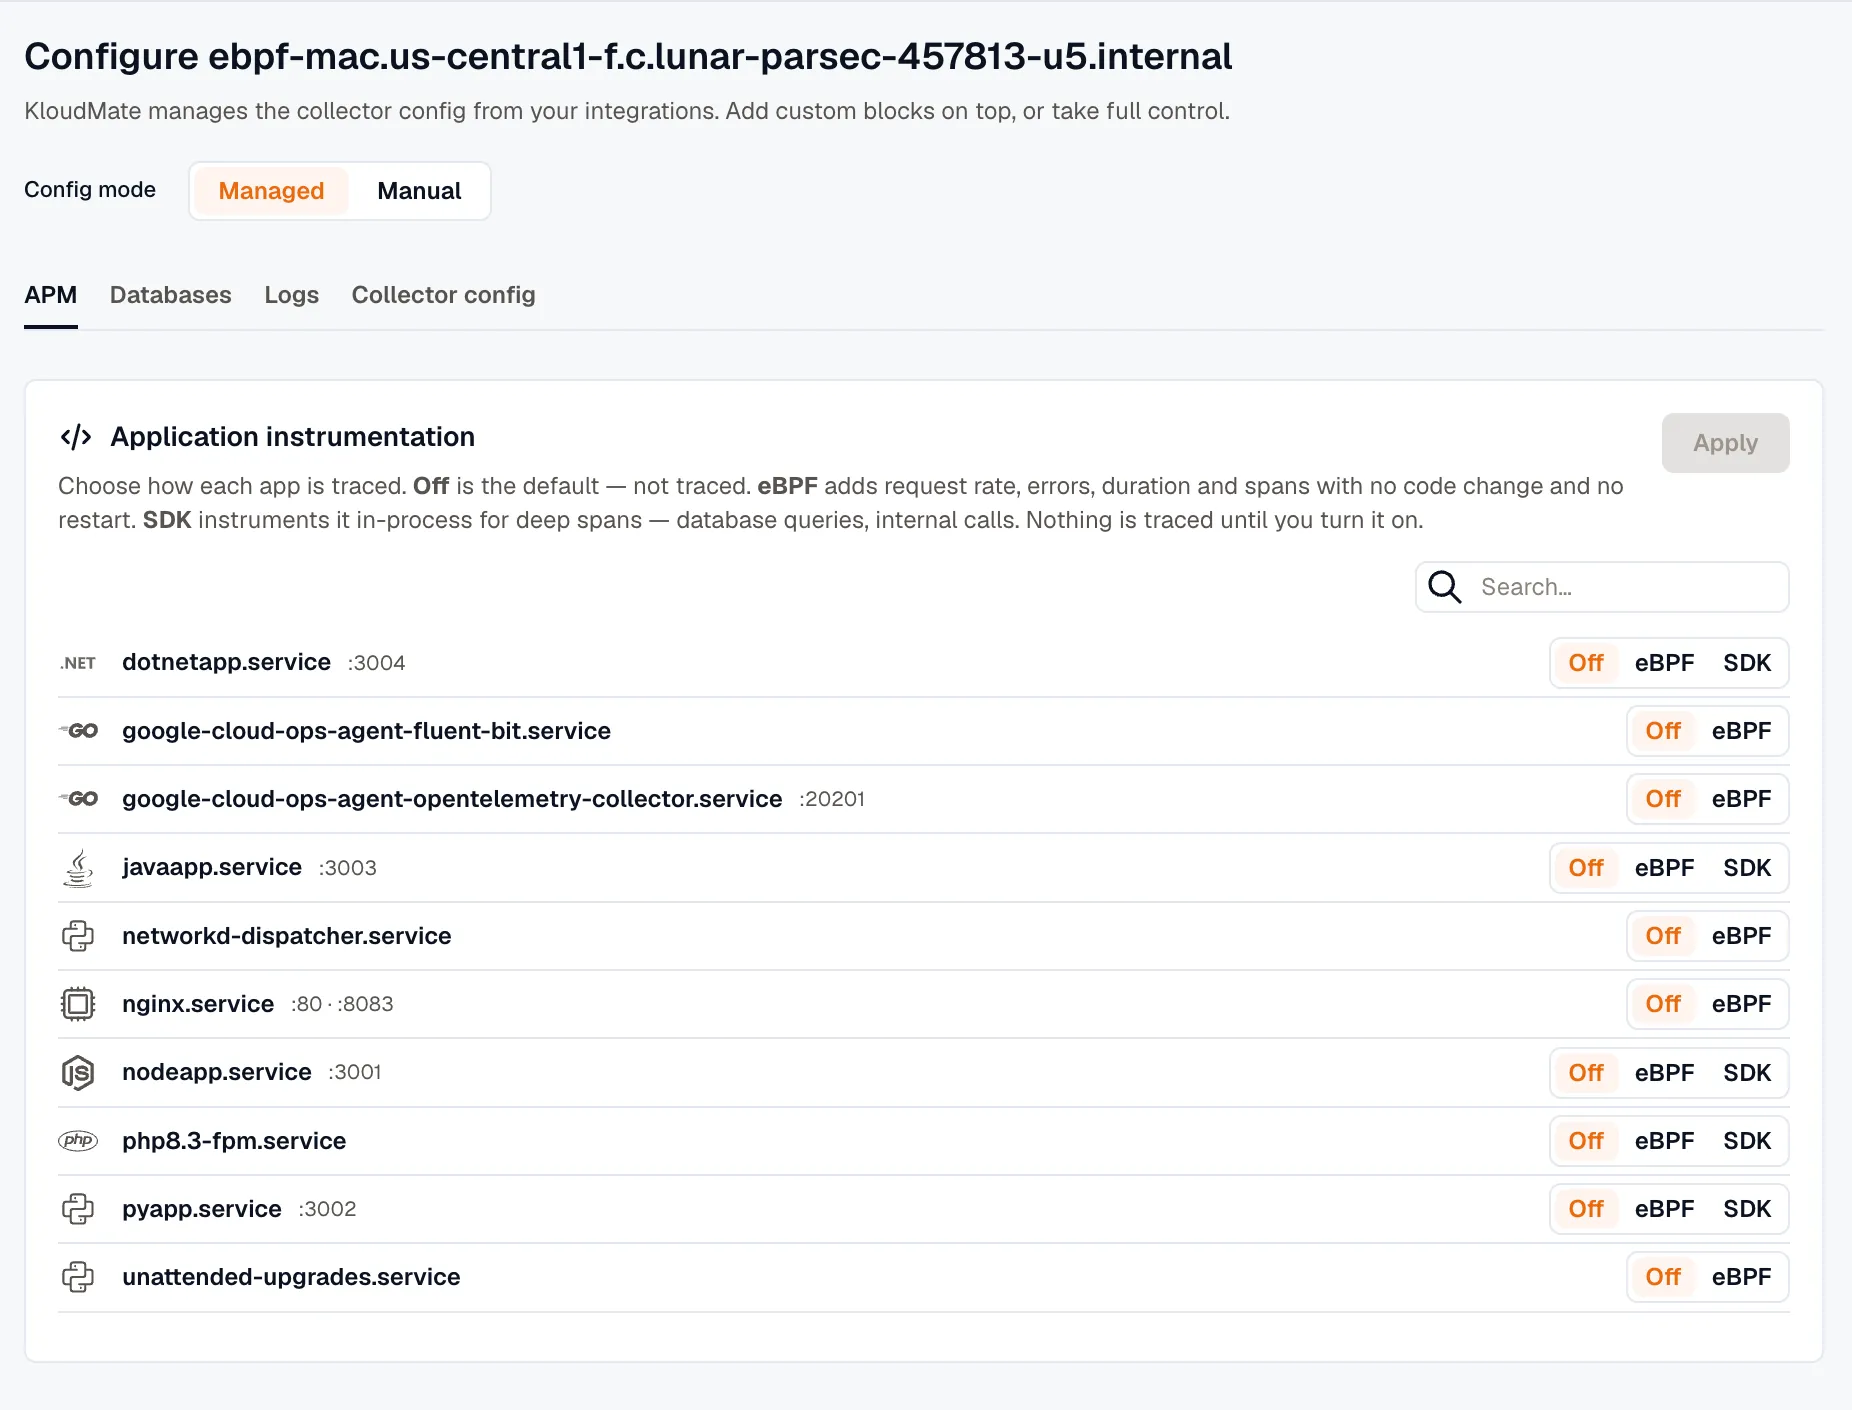
Section titled “Where discovered services appear”To see what discovery found, go to Settings → Agents, open the agent’s actions menu (⋮), and select Configure. Application services are listed in the Application instrumentation card on the APM tab, and databases on the Databases tab. Discovery reports these details for each service:
- Name and runtime (for example,
checkoutrunning Java). - Runtime version, where it affects a decision (for example, the PHP major and minor version, or whether a .NET app runs on .NET Framework or .NET Core).
- Kind: how the service is managed, such as a systemd unit, a bare process, a container, a Windows service, or an Internet Information Services (IIS) application pool.
- Listen ports.
- State:
runningoridle. Discovery also reports installed-but-not-running services asidle, so you can choose to instrument one on its next start. - Instrumentable flag: whether the agent has a way to attach application tracing to that runtime.
Stable service identity
Section titled “Stable service identity”Each discovered service gets a stable identity that survives restarts and process-ID changes. This is what lets a tracing choice keep applying after a service restarts: you instrument checkout, not a process that will be gone after the next deploy.
Privacy and safety
Section titled “Privacy and safety”Discovery keeps sensitive data on the host:
- It never sends raw environment variables or full command lines to KloudMate, because these can contain secrets. It extracts only what it needs to classify a service (runtime, version, and listen ports) and discards the rest.
- It skips the agent itself and developer tools, so they are not listed or instrumented.
How discovery powers the rest of the agent
Section titled “How discovery powers the rest of the agent”Discovered services are the entry point for the opt-in features:
- Application APM: on the APM tab, choose Off, eBPF, or SDK for each service, then click Apply. SDK is offered only for instrumentable services. See Application APM.
- Database monitoring: on the Databases tab, click Monitor next to a discovered database to start the monitoring wizard, which prefills the engine and endpoint. See Database monitoring.