

Dashboard Details
Opening a dashboard takes you to the Dashboard Details view where all your panels are displayed together. This is your live monitoring view — all panels update based on the selected time range and refresh settings.
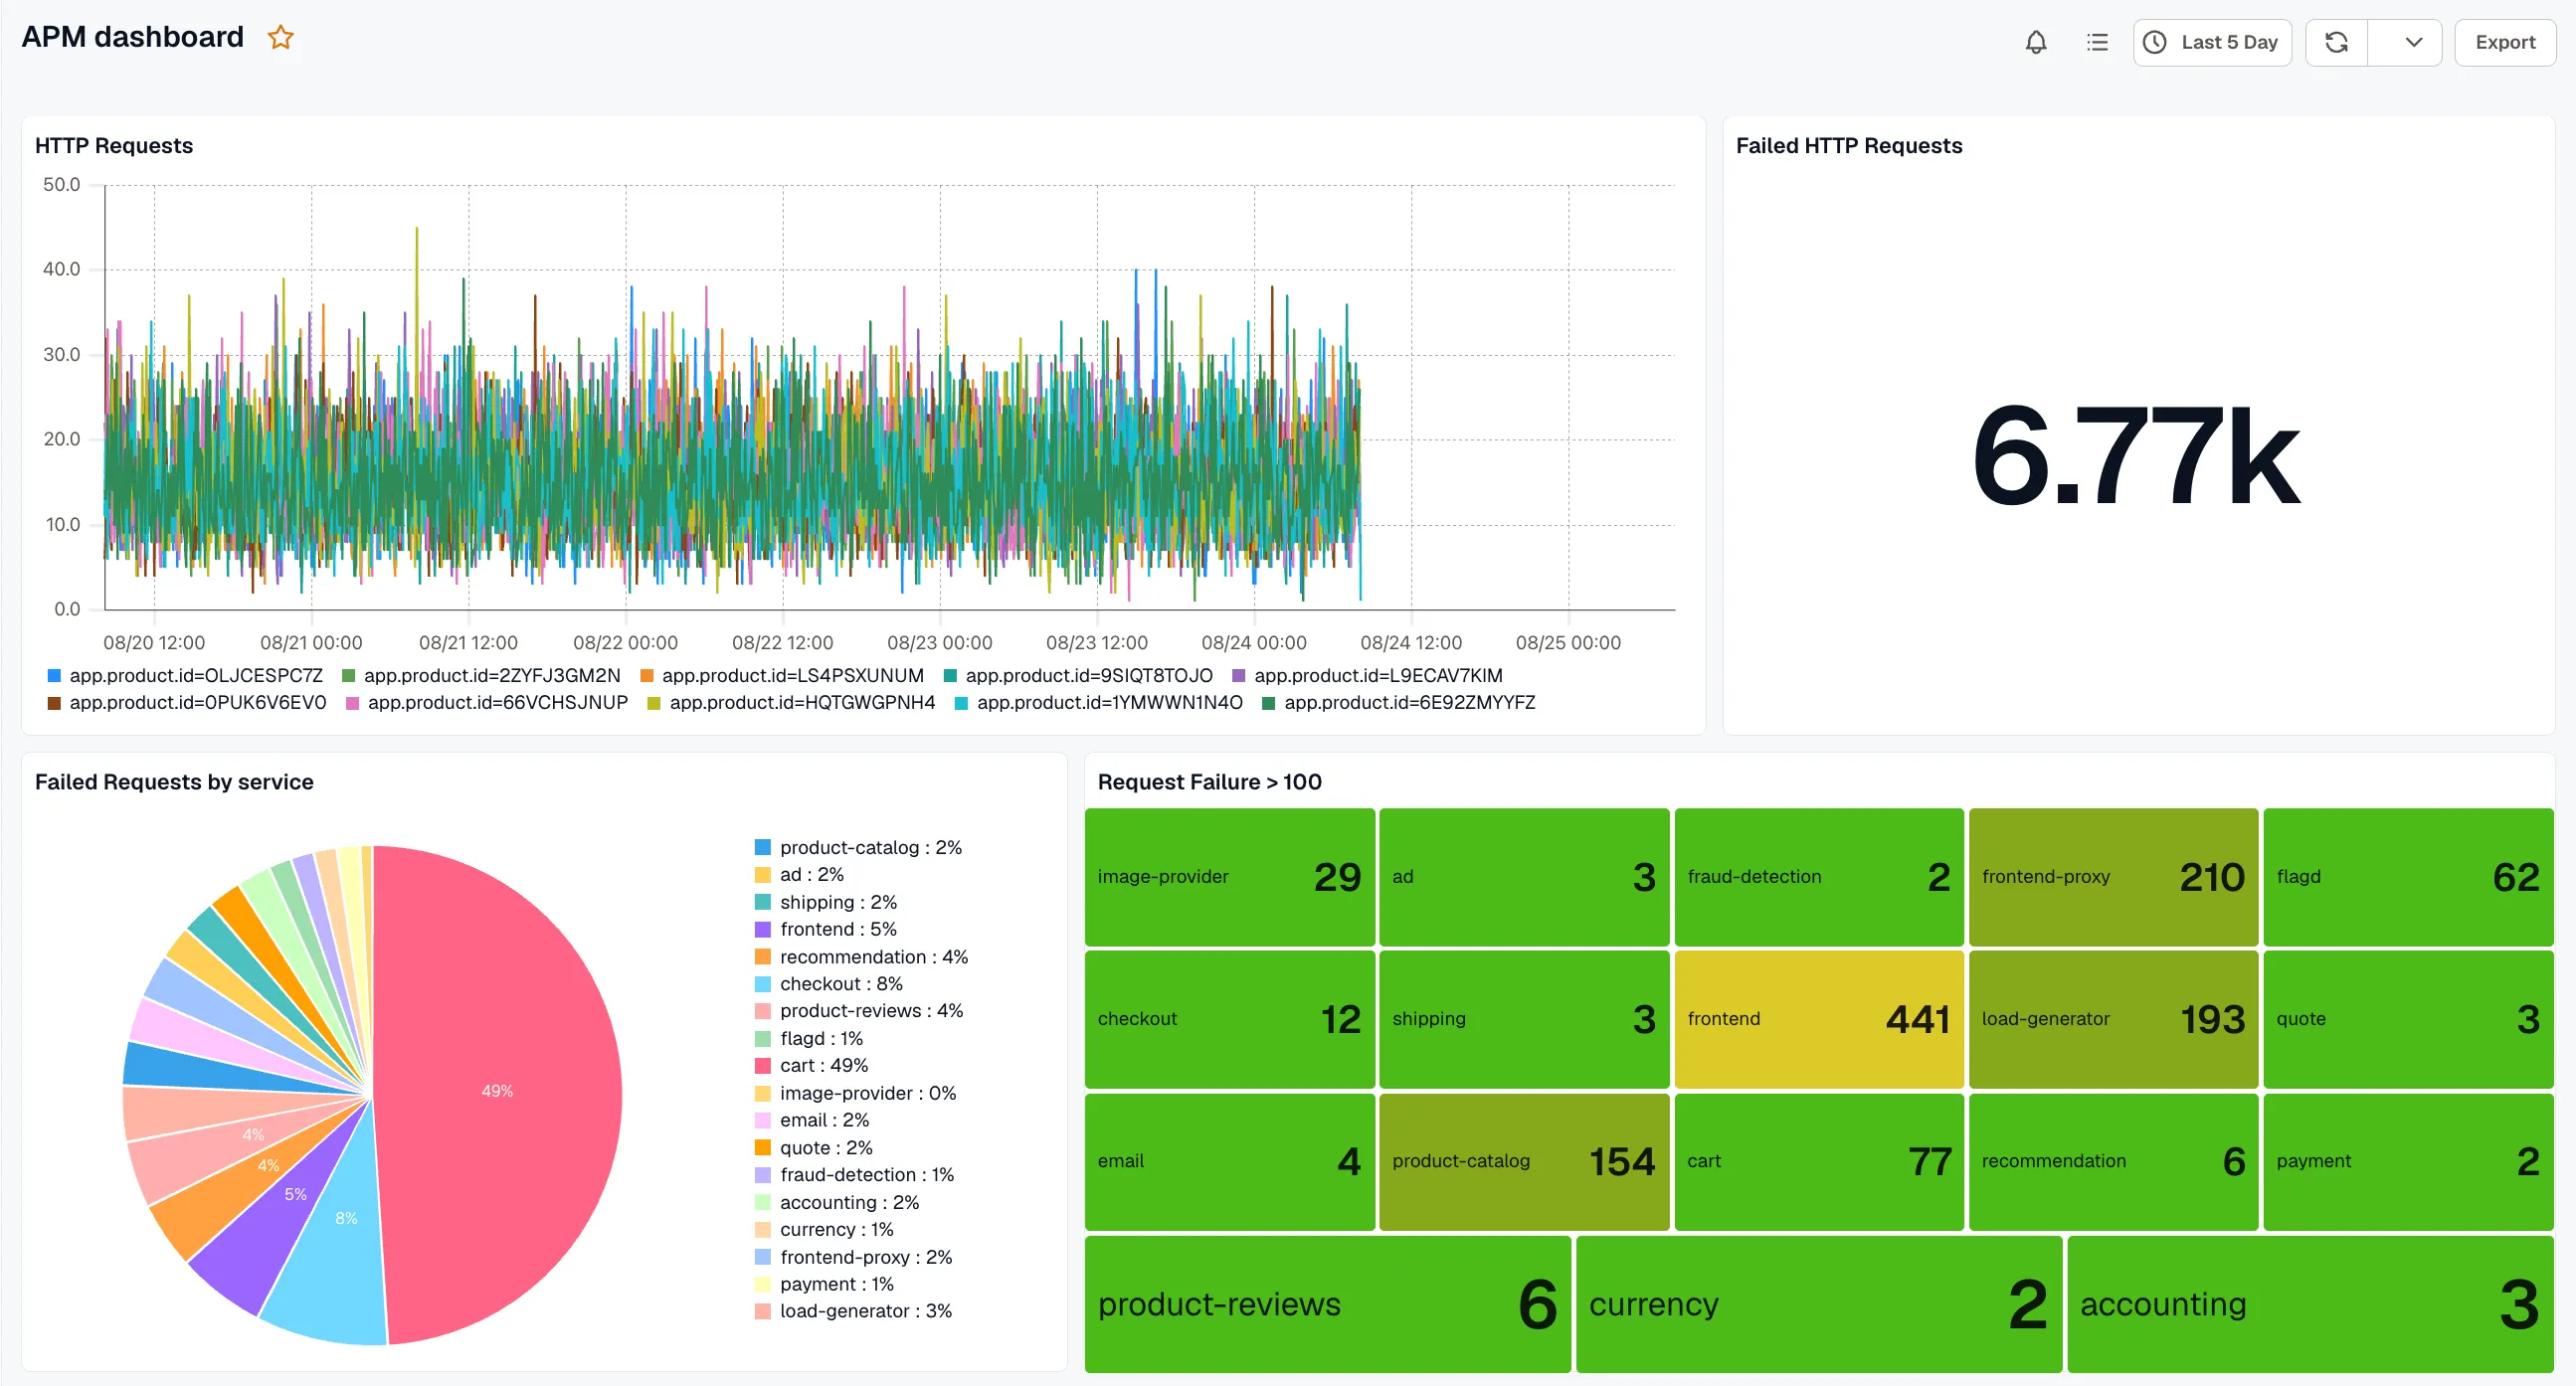
Toolbar
Section titled “Toolbar”The toolbar at the top provides the following controls:
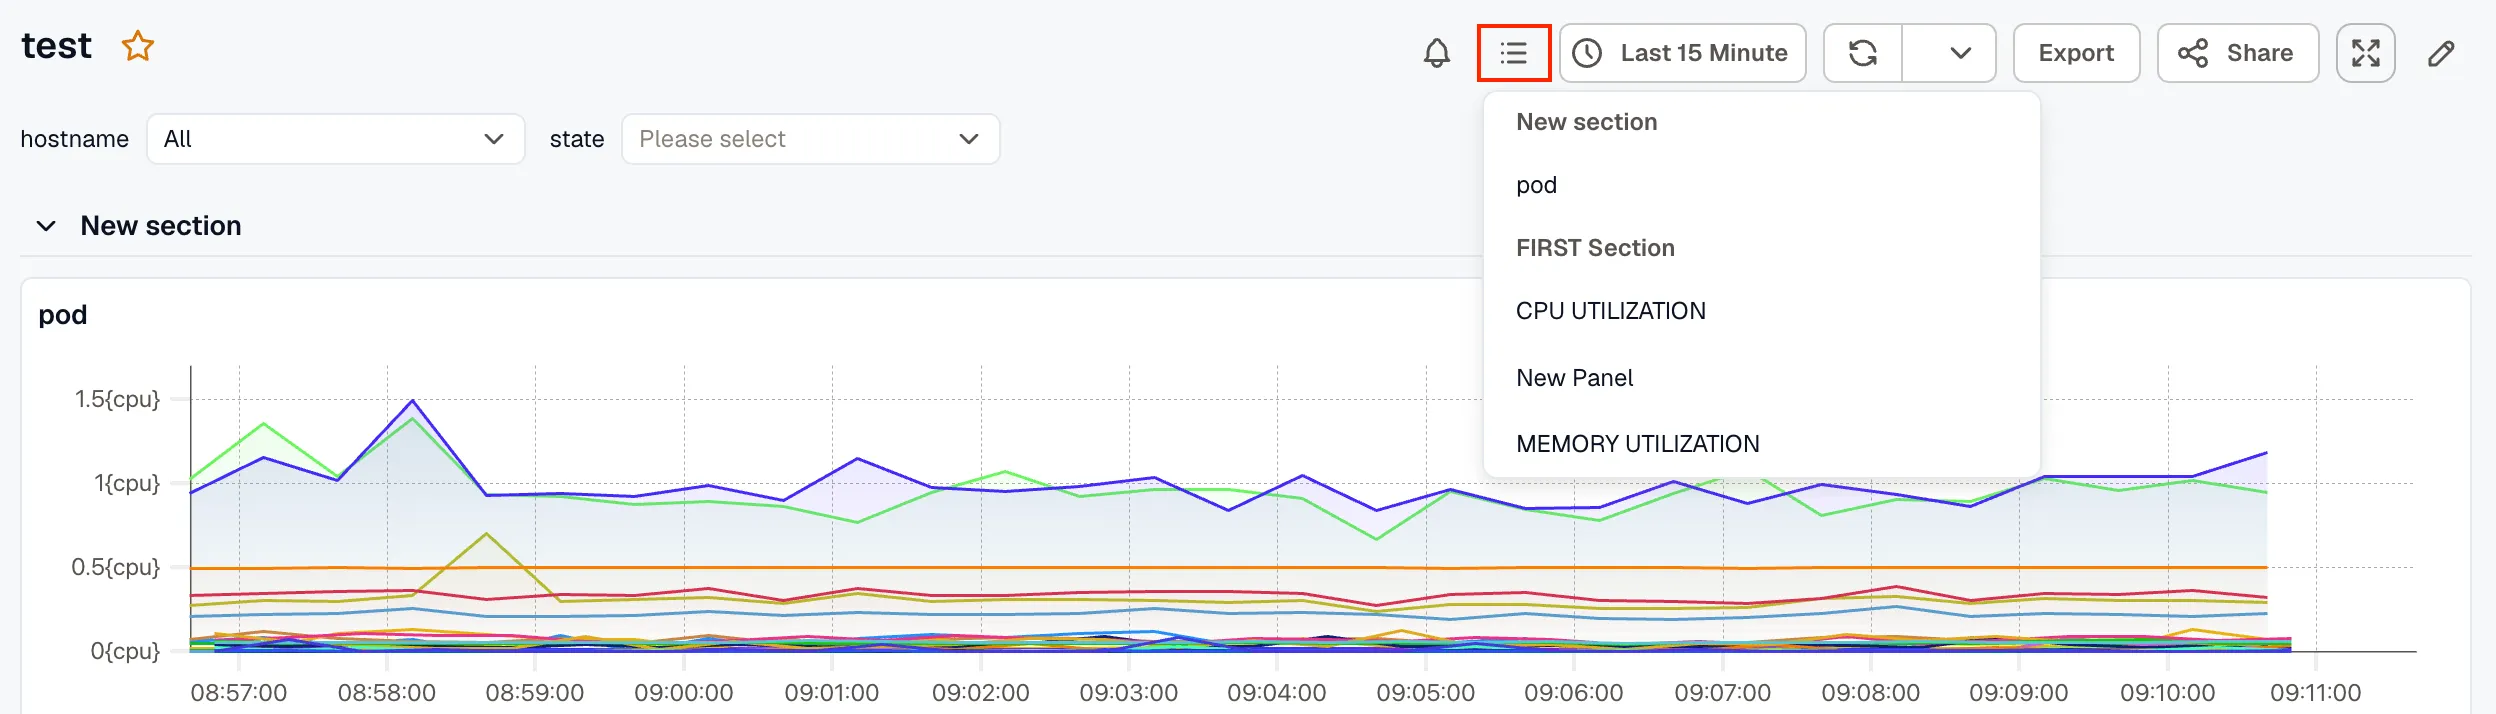
- Panel list: Opens a dropdown listing all panels on the dashboard, letting you quickly jump to a specific panel without scrolling.
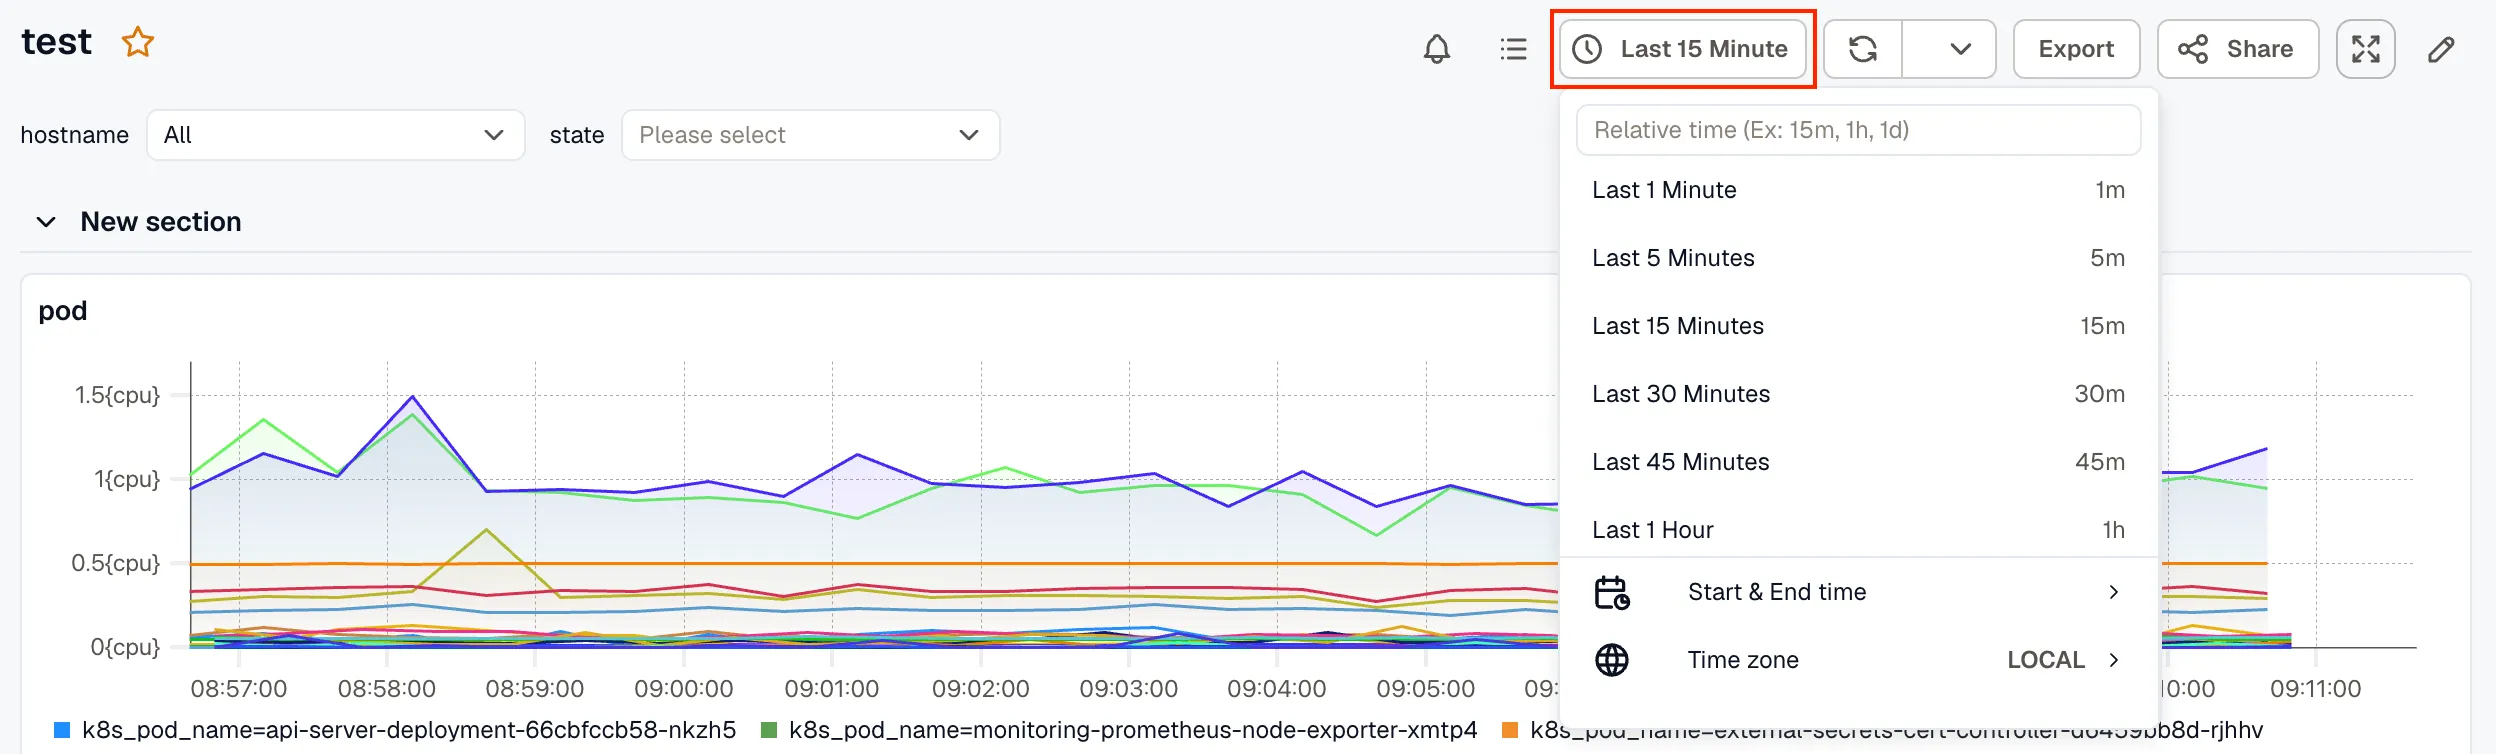
- Time range picker: Sets the time window applied to all panels. Choose a relative option or use Start & End time to set a custom range. You can also set the Timezone.
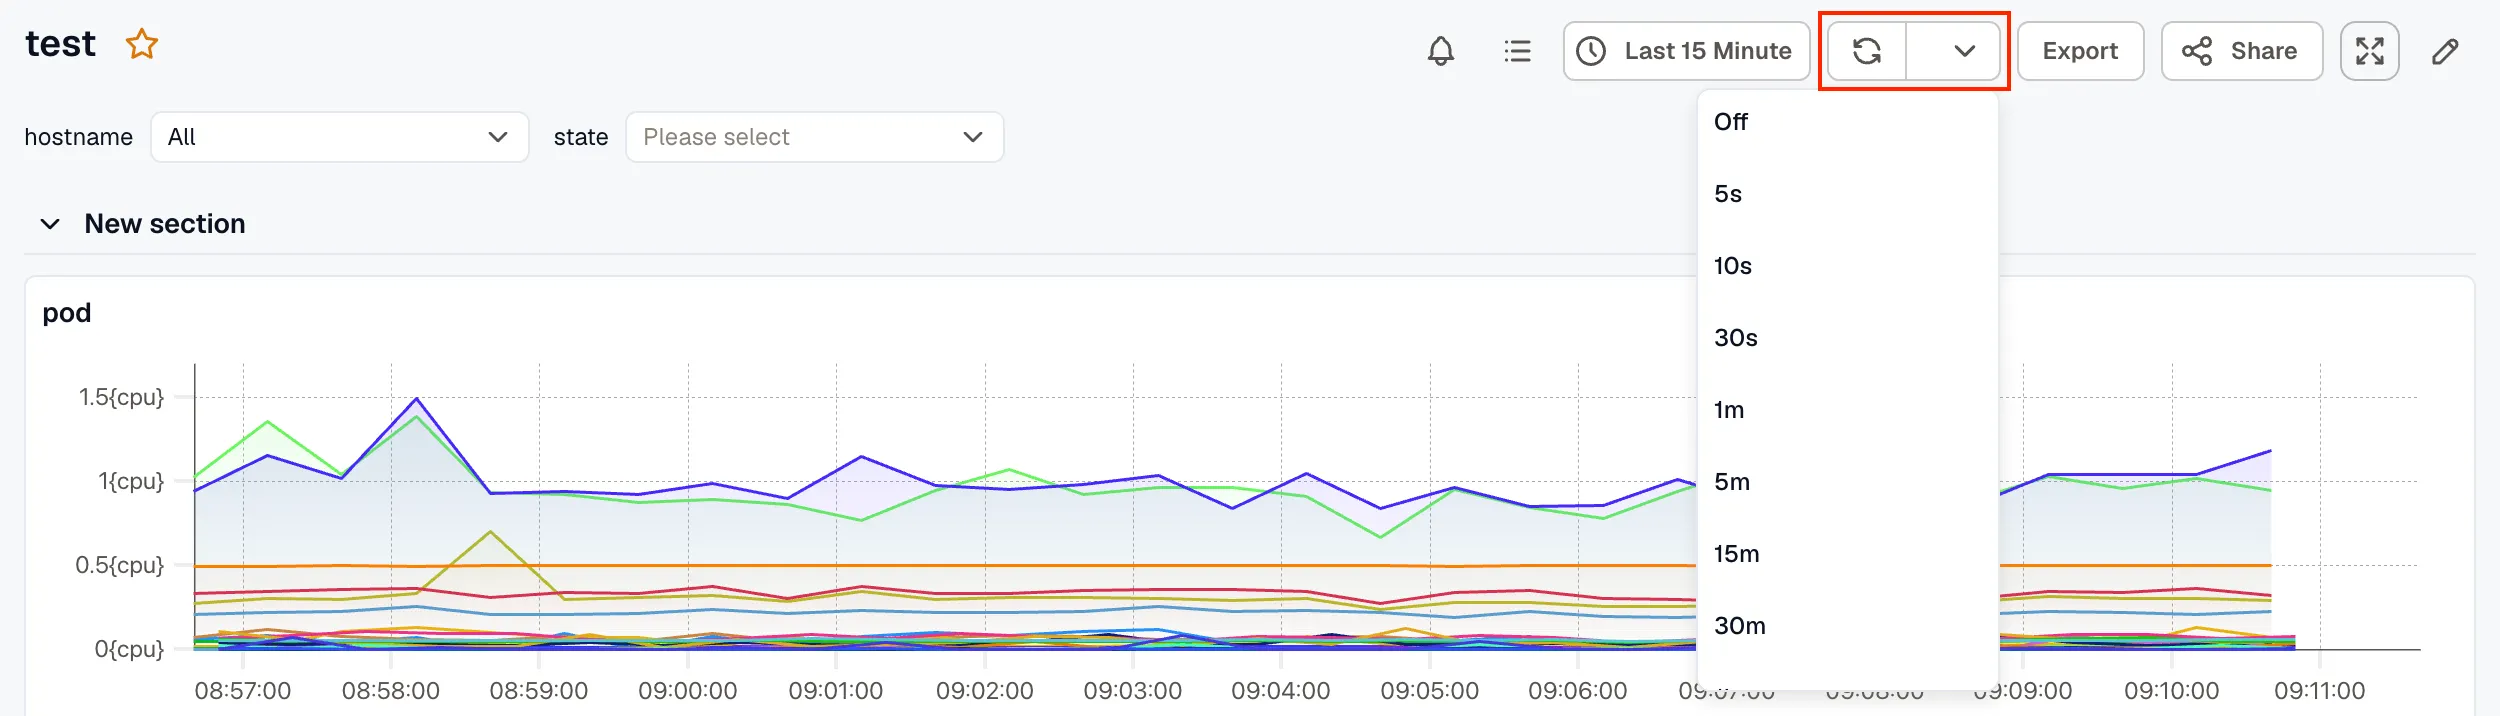
- Refresh icon: Manually refreshes all panels to pull the latest data.
- Refresh interval dropdown: Sets an automatic refresh interval so the dashboard stays current.
- Export: Exports the dashboard.
- Share: Opens the Share Dashboard dialog, with options for a public link or a copy of the dashboard’s JSON.
- Fullscreen: Expands the dashboard to fullscreen view.
- Edit: Enters edit mode to modify the dashboard and its panels.
Viewing Alerts in Dashboards
Section titled “Viewing Alerts in Dashboards”KloudMate integrates alerts directly into your dashboard visualizations, providing immediate context on system health alongside your metrics.
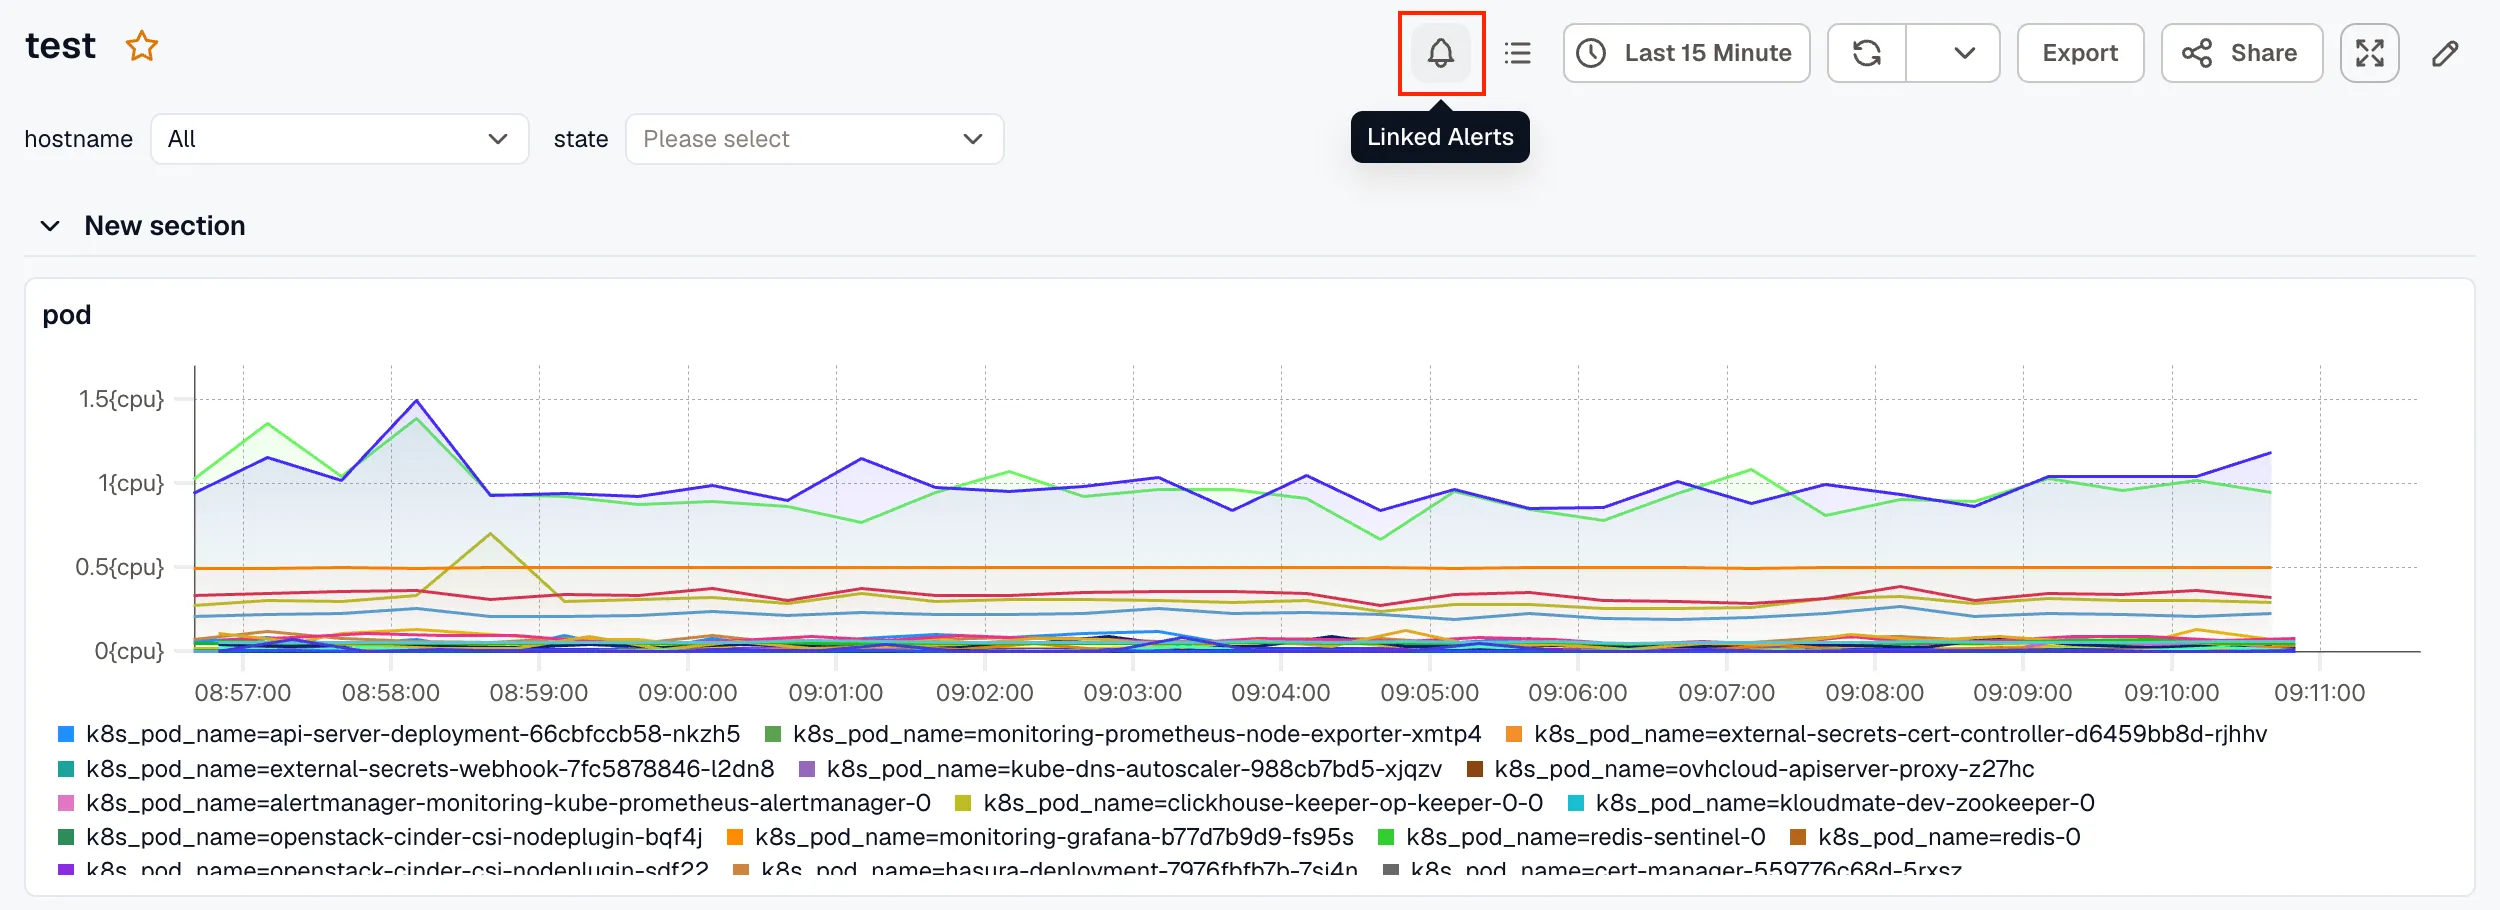
- Linked Alerts: Click the bell icon in the toolbar to open the Linked Alerts drawer, which lists every alert linked to a panel in the dashboard.
- Panel Alert Indicators: If a panel is linked to an alert and the alert is currently Firing, a status indicator will appear on the panel header.
- Alerts Drawer: Clicking on an alert indicator opens the Alerts Drawer without leaving the dashboard context. This drawer displays information for alerts in the Firing state:
- The current evaluation state of the alert.
- The conditions that triggered it.
Sharing a Dashboard
Section titled “Sharing a Dashboard”Click Share — from the dashboard list’s more options (⋯) icon, or from an individual dashboard’s toolbar — to open the Share Dashboard dialog. Both entry points offer the same two options.
Public link
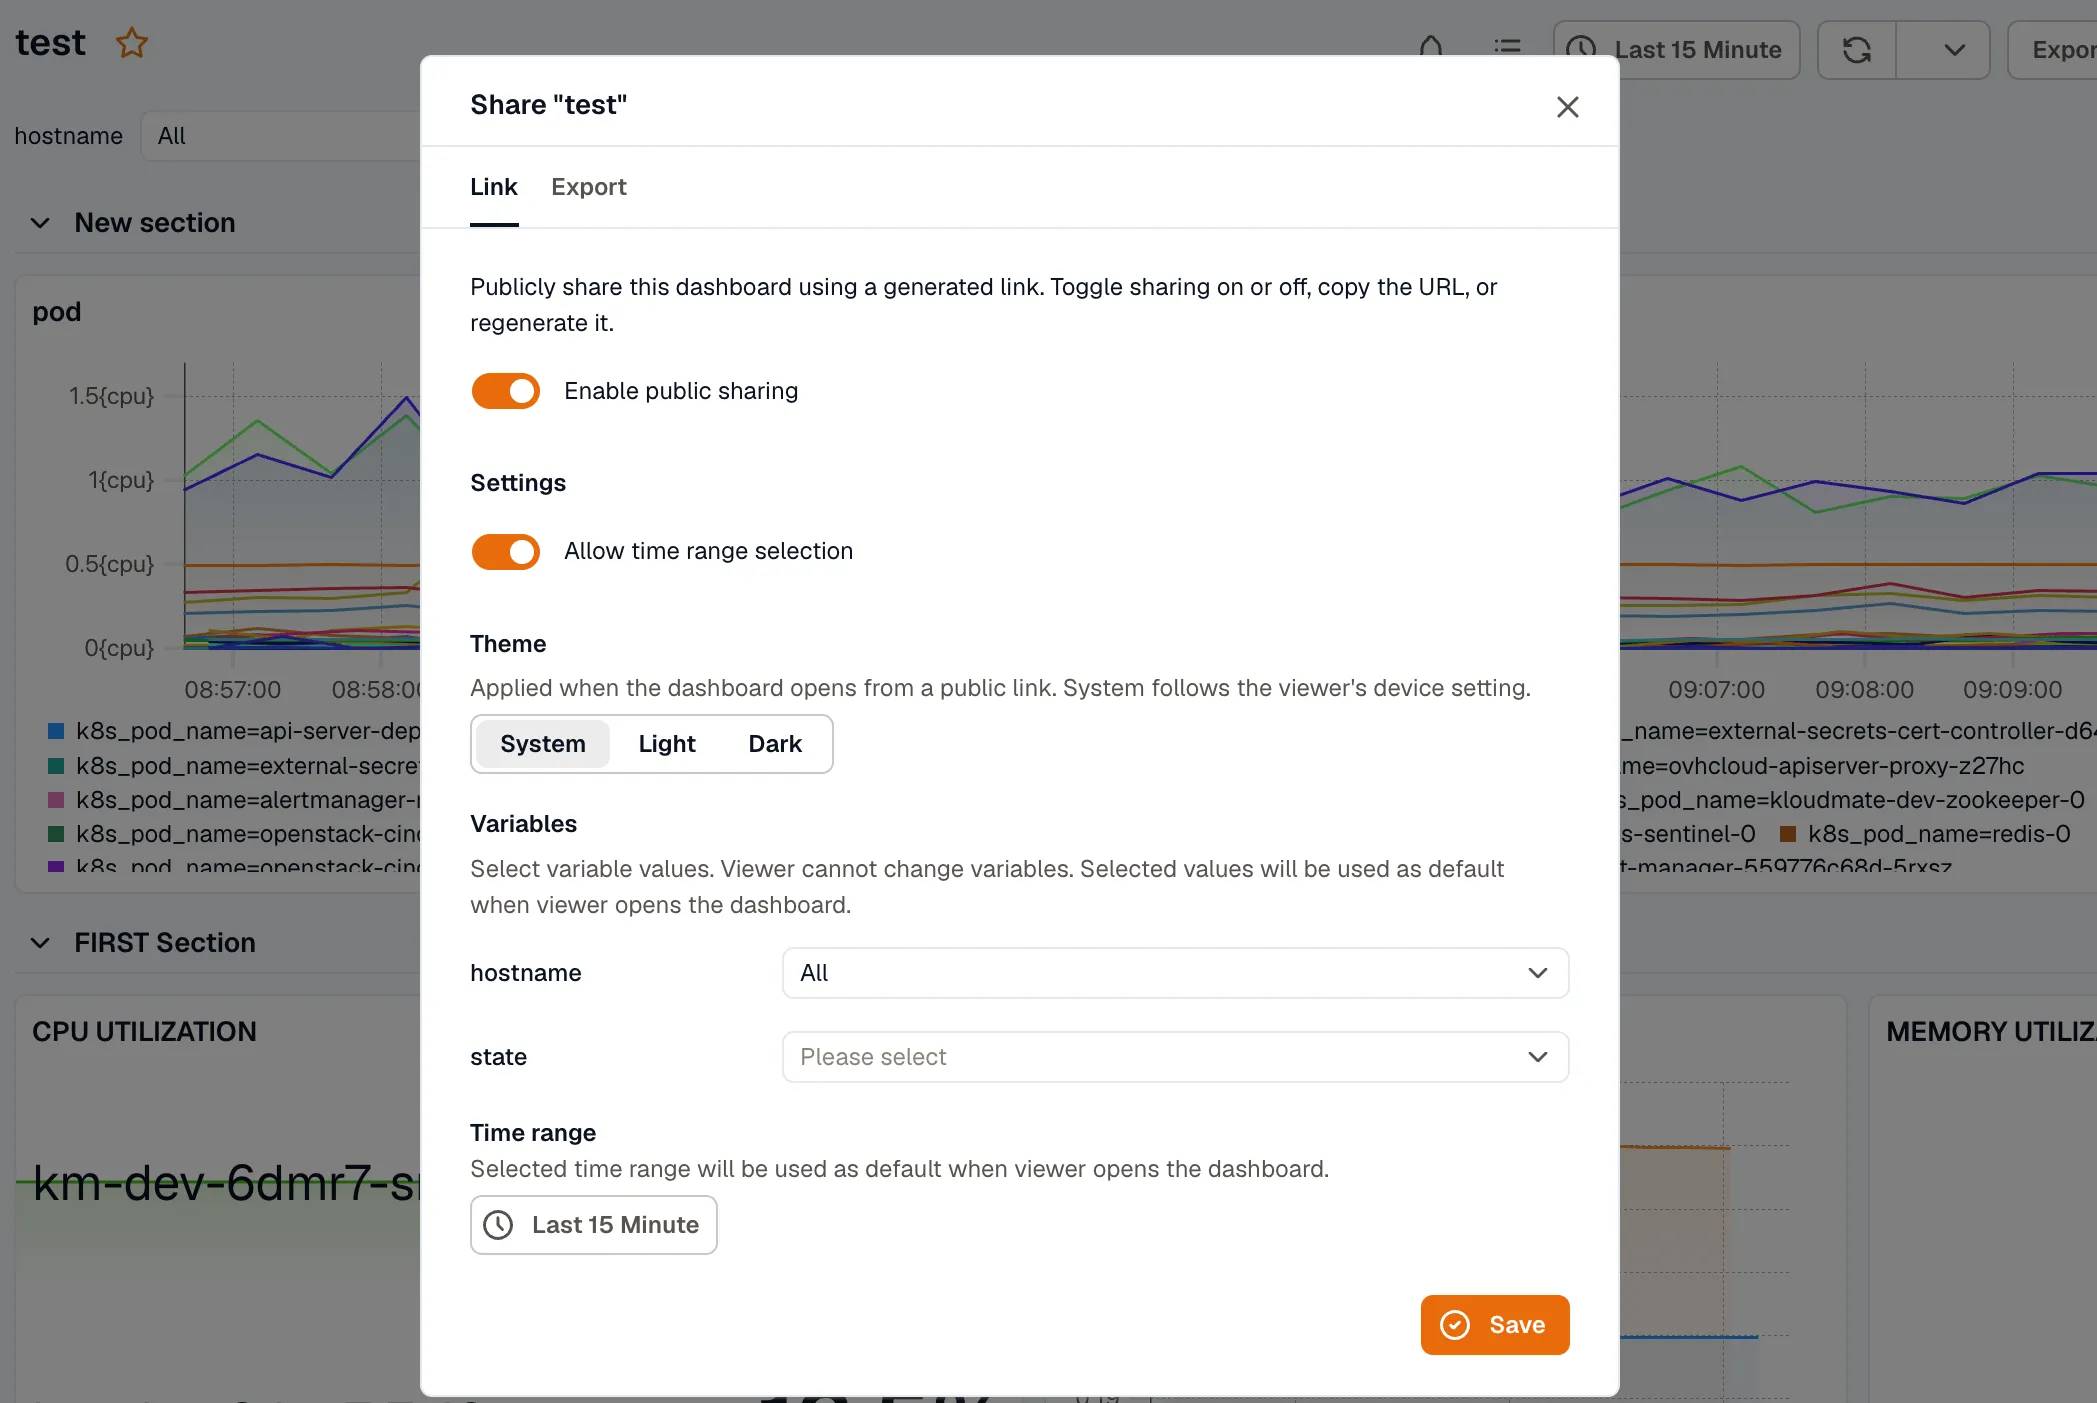
Section titled “Public link”Generates a link that anyone can use to view the dashboard without logging in to KloudMate.
- Enable public sharing: Toggle this on to activate the public link.
- Allow time range selection: Toggle this on to let viewers change the time range when viewing the shared dashboard.
- Time range: Sets the default time range viewers will see when they open the shared link.
Click Save to apply the settings. The shared link can be managed from the Public Dashboards page.
Copy JSON
Section titled “Copy JSON”Copies the dashboard’s JSON definition to your clipboard. Use this to replicate a dashboard in another workspace: same layout, no manual rebuild.
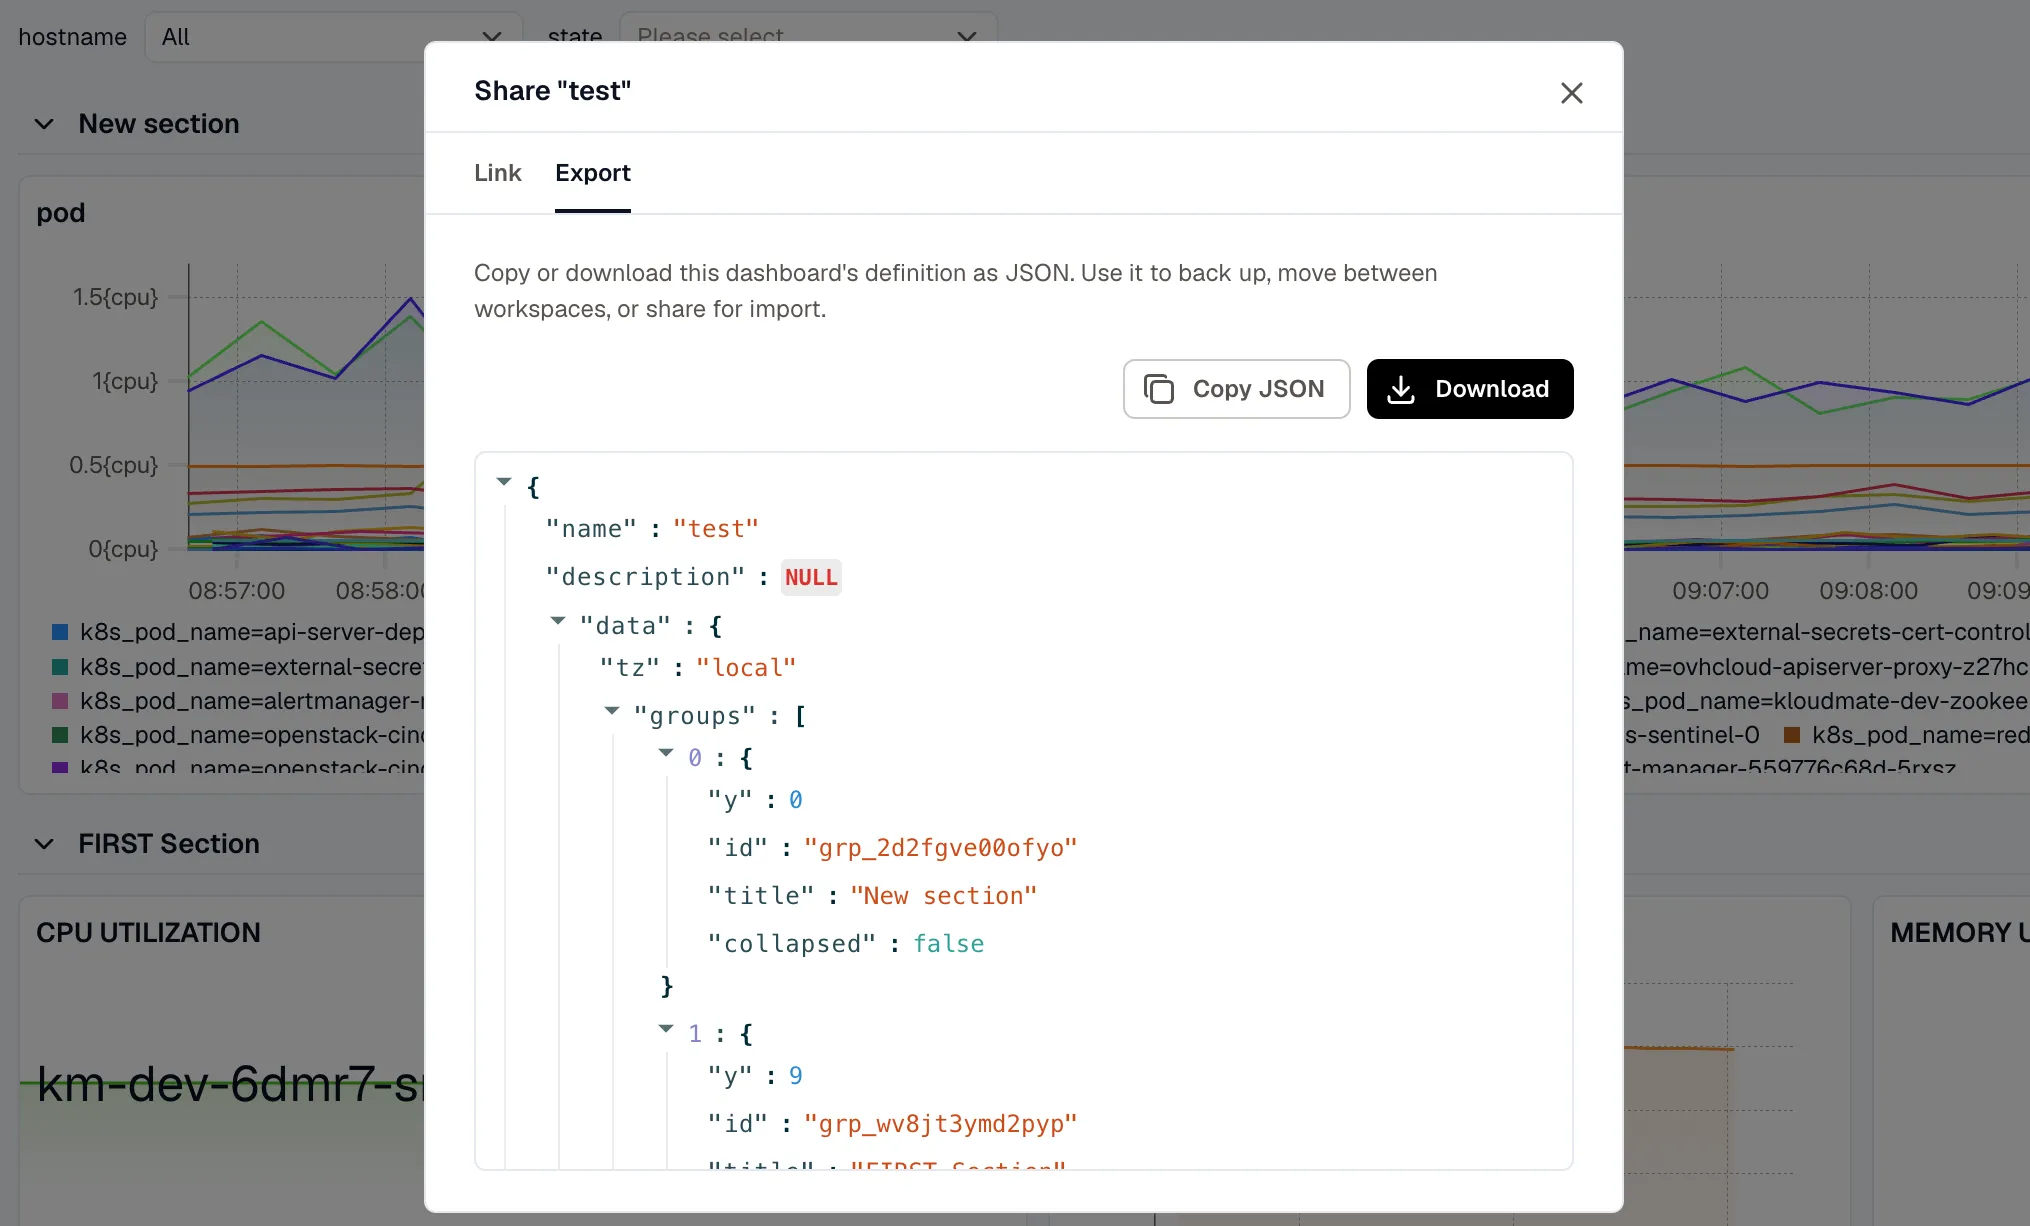
To recreate it elsewhere, navigate to the Dashboards section in the target workspace, click Import, paste the copied JSON, and click Submit. The dashboard is recreated in the new workspace.