

Runtime
The Runtime tab on a service’s APM page shows how the service’s language runtime behaves: memory, garbage collection (GC), threads, and the event loop or scheduler. Use it when a service is slow or restarting and the traces don’t explain why, to tell whether the runtime is the cause and not the code or a dependency.
Open APM & Services, click a service, then select Runtime. The tab follows the page’s time range.
Supported runtimes
Section titled “Supported runtimes”The tab reads the runtime metrics that the OpenTelemetry SDK reports.
| Runtime | How to get the metrics |
|---|---|
| Java (JVM) | The OpenTelemetry Java agent reports them by default. For heap buffers and CPU load, add -Dotel.instrumentation.runtime-telemetry.emit-experimental-metrics=true. |
| Go | Call runtime.Start() from go.opentelemetry.io/contrib/instrumentation/runtime. Scheduler latency also needs runtime.NewProducer() on the metric reader. |
| Node.js | @opentelemetry/auto-instrumentations-node includes them by default. With a manual setup, register @opentelemetry/instrumentation-runtime-node. |
| .NET | On .NET 9 and later, add the built-in meter with AddMeter("System.Runtime"). On .NET 6 to 8, add OpenTelemetry.Instrumentation.Runtime with AddRuntimeInstrumentation(). |
| Python | Install opentelemetry-instrumentation-system-metrics. The OpenTelemetry Operator’s Python image and opentelemetry-bootstrap include it. |
Services that the KloudMate Agent instruments with the SDK report these metrics with no extra setup. A service traced with eBPF only doesn’t report runtime metrics. If it runs on Kubernetes, its container metrics are still on the Infrastructure tab.
Filters
Section titled “Filters”When the service reports service.version, a Version filter appears next to the tabs. When it runs in more than one pod, a Pod filter appears too. Both narrow every section of the tab. Picking a version limits the Pod list to the pods that ran that version.
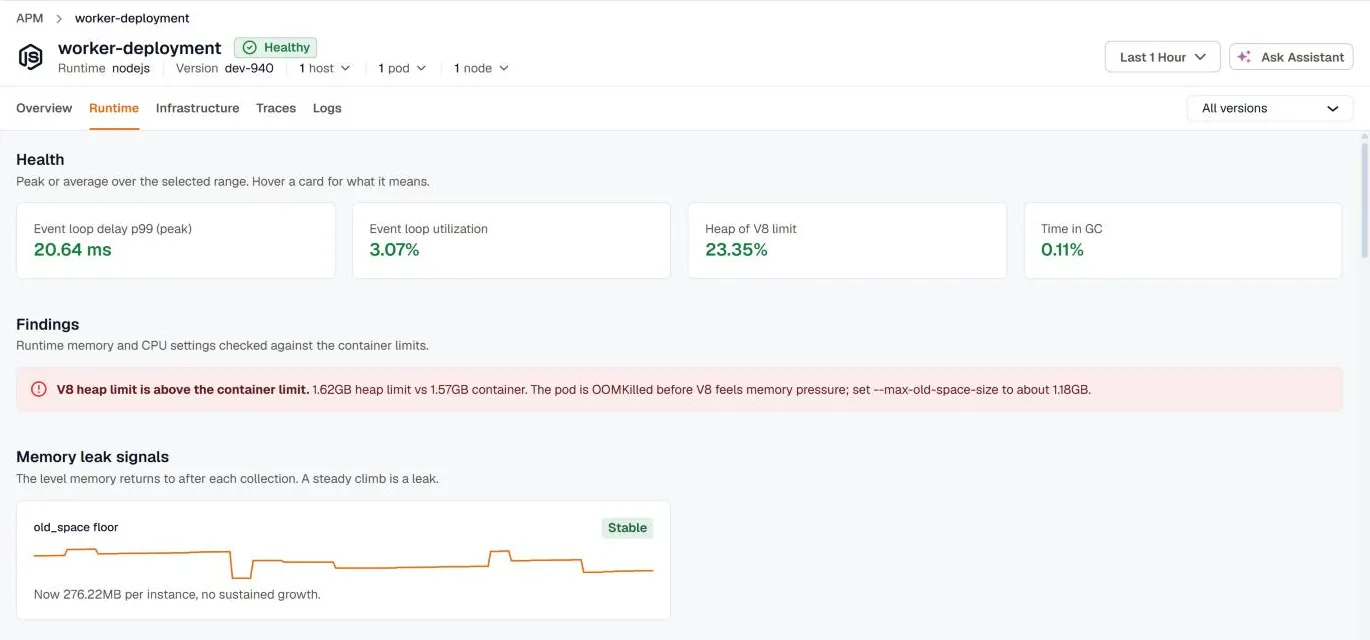
Health
Section titled “Health”The health cards show the runtime’s key values over the selected range, as a peak or an average. Green, amber, and red mark healthy, warning, and critical values.
| Runtime | Cards |
|---|---|
| Java | Heap after GC (of max), Time in GC, GC pause p99, Blocked threads (peak) |
| Go | Goroutines (peak / instance), Heap of GOMEMLIMIT, Allocation rate, Scheduler latency p99 |
| Node.js | Event loop delay p99 (peak), Event loop utilization, Heap of V8 limit, Time in GC |
| .NET | GC pause time, Gen2 collections, Thread pool queue (peak), Exceptions |
| Python | RSS (peak / instance), CPU, Gen2 collections, Uncollectable objects |
Findings
Section titled “Findings”Findings checks the runtime’s memory and CPU settings against the container’s limits, for services that run on Kubernetes. Each finding names the setting to change. For example:
- Java: the max heap is above 80% of the container’s memory limit. Metaspace, thread stacks, and direct buffers live outside the heap, so the pod is OOMKilled before the JVM throws
OutOfMemoryError. Keep-XmxorMaxRAMPercentageat 75% or less. - Go:
GOMEMLIMITisn’t set, so the GC doesn’t know about the container’s limit. OrGOMAXPROCSis above the CPU limit, so the pod gets throttled. - Node.js: the V8 heap limit is above the container’s limit, or so far below it that Node runs out of heap while the container still has room. Set
--max-old-space-sizeto about 75% of the container’s limit.
Memory leak signals
Section titled “Memory leak signals”Each card tracks the level memory returns to after each collection, such as the Java heap live set or the Node.js old space floor, with a sparkline over the range. A steady climb is a leak. The card is marked Growing or Stable, shows the current value and how fast it’s rising per hour, and estimates when it reaches the limit if it keeps growing.
Runtime impact and efficiency
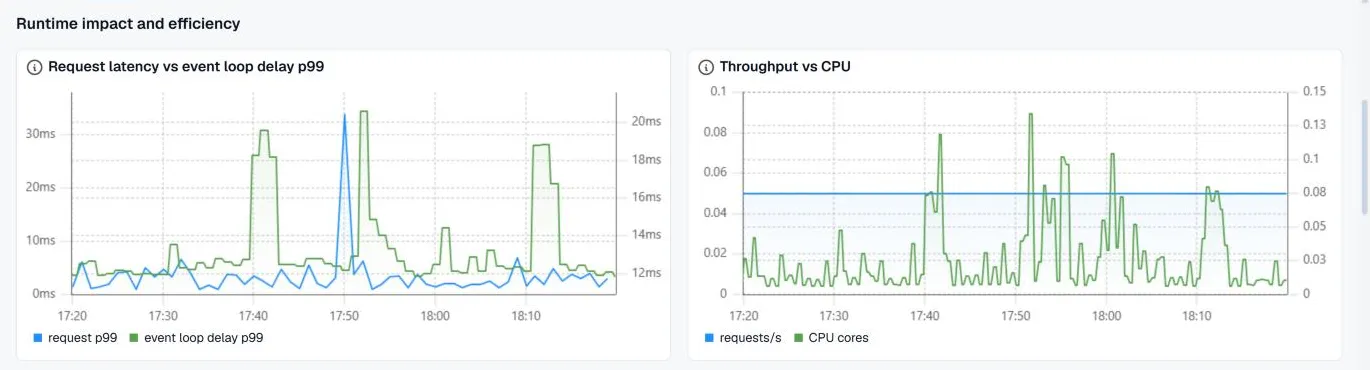
Section titled “Runtime impact and efficiency”These charts compare the runtime with the service’s traffic.
- Request latency vs the runtime’s pause signal (GC pause p99 for Java, event loop delay p99 for Node.js, scheduler latency p99 for Go). Spikes that line up mean the runtime is slowing requests.
- Throughput vs CPU. CPU should track traffic. CPU rising while traffic is flat means each request costs more work.
- CPU time per request. The unit cost of a request. Compare it before and after a release to catch efficiency regressions.
Runtime charts
Section titled “Runtime charts”The section named after the runtime, such as JVM or Node.js runtime, charts memory by pool or generation, GC rate and pauses, threads, CPU, and runtime-specific signals such as goroutines, the event loop, the .NET thread pool, or Python’s uncollectable objects. Each chart’s description says what to look for.
Version comparison
Section titled “Version comparison”Version comparison shows whether a release changed what an instance costs to run. Pick a Baseline and a Compared version to see memory, CPU, and GC per instance side by side, with the change between them. A rise is the regression, since every row is a cost. Both versions must have run in the selected range, so widen the range to compare a release with the one before it.
Deployments in range lists each version with when it was first and last seen and its peak instance count. The service needs to report service.version for this section.
Instances
Section titled “Instances”The table lists each instance (pod, host, or service instance) with its memory, CPU, a key runtime value, and restarts. A cell well above the fleet median is highlighted, as is any restart. Use it to find the one pod that behaves differently from the rest.
Related
Section titled “Related”- Infrastructure for the pods and containers the service runs in
- Services for the service list and its APM dashboard
- Auto-Instrumentation to add the SDK with no code change