

Database monitoring overview
Database monitoring connects the KloudMate agent to your databases with a monitoring user, and collects their health metrics, query performance, sessions, schema, topology, and logs. You set it up per database through a wizard, and the agent generates the collector configuration for you. The results appear in the Databases module.
Two views of your databases
Section titled “Two views of your databases”The agent sees your databases in two ways that work together:
- From your applications, with no credentials. eBPF and application traces capture the queries your services run against a database, with their timing. These appear in distributed traces, the service map, and the Calling services tab of the Databases module. See eBPF observability.
- From the database itself, when you opt in. Database monitoring reads the database’s own statistics: connections, cache hit ratio, replication lag, top queries, active sessions, and more. This needs a monitoring user.
Both views share a database identity, so a slow query in a trace lines up with the server metrics for the same database. See Telemetry identity.
Before you start
Section titled “Before you start”- The agent must be in managed config mode. Database monitoring is generated into the managed collector configuration, on every platform. If the agent is in manual mode, the Databases tab offers to switch it. Switching regenerates the configuration from the agent’s integrations and replaces manual edits. See the configuration model.
- The agent must reach the database. For a self-hosted database, install the agent on the same machine. For a managed database such as Amazon RDS, Cloud SQL, or MongoDB Atlas, install it on a host that can reach the database over the network.
- The engines and coverages you’re offered come from the agent itself, so they depend on the agent version. Upgrade the agent to get newer coverages.
Where to set it up
Section titled “Where to set it up”You can open the wizard from two places:
- Databases → Monitor a database. Choose the agent, then the engine. This is the quickest path when you’re adding a database for the first time.
- Settings → Agents. Open the agent and go to its Databases tab. It lists the databases the agent discovered and not yet monitored, with a Monitor button on each, and the databases already monitored, with Edit and Remove. Use Add database for a database that wasn’t discovered.
Once you add one database of an engine on a host, the other discovered databases of that engine drop off the Discovered on this host list. Add further databases of the same engine with Add database.
Coverages
Section titled “Coverages”You choose what to collect for a database as a set of coverages. Standard metrics is always on. Every other coverage, such as Query performance, Schema catalog, or Replication topology & lag, is off until you turn it on.
Under Standard metrics, check Collect all optional metrics to collect the receiver’s full metric set instead of the basic one. You get more detail, at a higher series count. Several panels in the Databases module need it.
See Engines and coverages for every coverage by engine.
The wizard
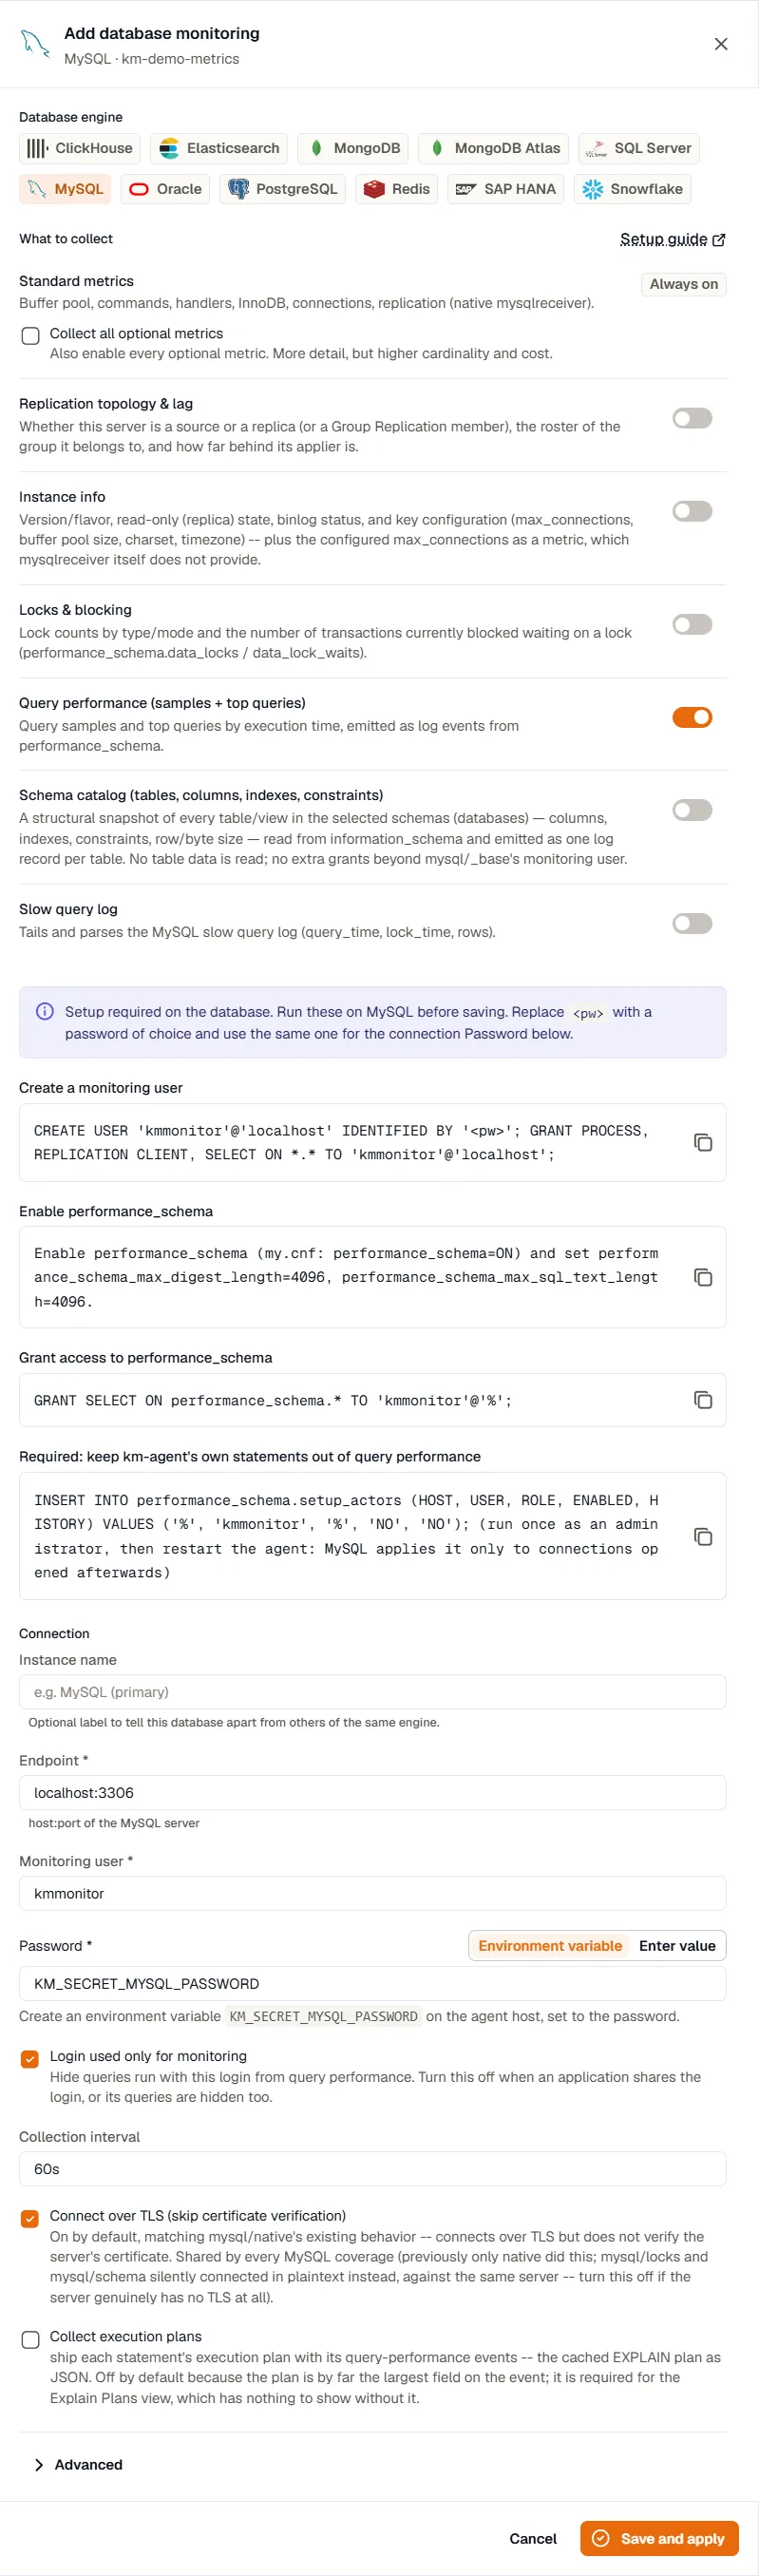
Section titled “The wizard”The wizard is one form, top to bottom:
- Database engine. Skipped when you started from a discovered database or from the Databases module, since the engine is already chosen.
- What to collect. Turn coverages on and off.
- Setup required. The grants, extensions, and database settings the selected coverages need, ready to copy. Run them on the database before you save.
- Connection. The fields your coverages need: endpoint, monitoring user, password, and coverage-specific settings such as scan intervals or schemas to scan. Instance name is optional, but set it when you monitor more than one database of the same engine on one endpoint, such as an Oracle CDB root and its PDBs. It keeps their data apart.
- Advanced. An optional YAML fragment per coverage, merged into that coverage’s generated receiver configuration. Use it for settings the form doesn’t expose, such as TLS options. It isn’t validated against a schema, and a password typed here is stored in plain text.
Click Save and apply. The change reaches the agent within a minute.
What’s checked when you save
Section titled “What’s checked when you save”The wizard checks that required fields are filled in and that any Advanced override is a YAML mapping. It doesn’t connect to the database, so it can’t test your password or grants.
- A wrong password or a missing grant shows up as errors in the agent log, and as empty tabs in the Databases module. If a tab stays empty, run the setup steps again and check the agent log.
- A database the agent can’t generate is skipped on its own. The other databases and the rest of your telemetry keep working. Skipped integrations and the reason are listed on the agent’s Collector config tab.
Edit or remove a database
Section titled “Edit or remove a database”Monitored databases are edited from the agent that monitors them, not from the Databases module. Go to Settings → Agents, open the agent, and go to its Databases tab.
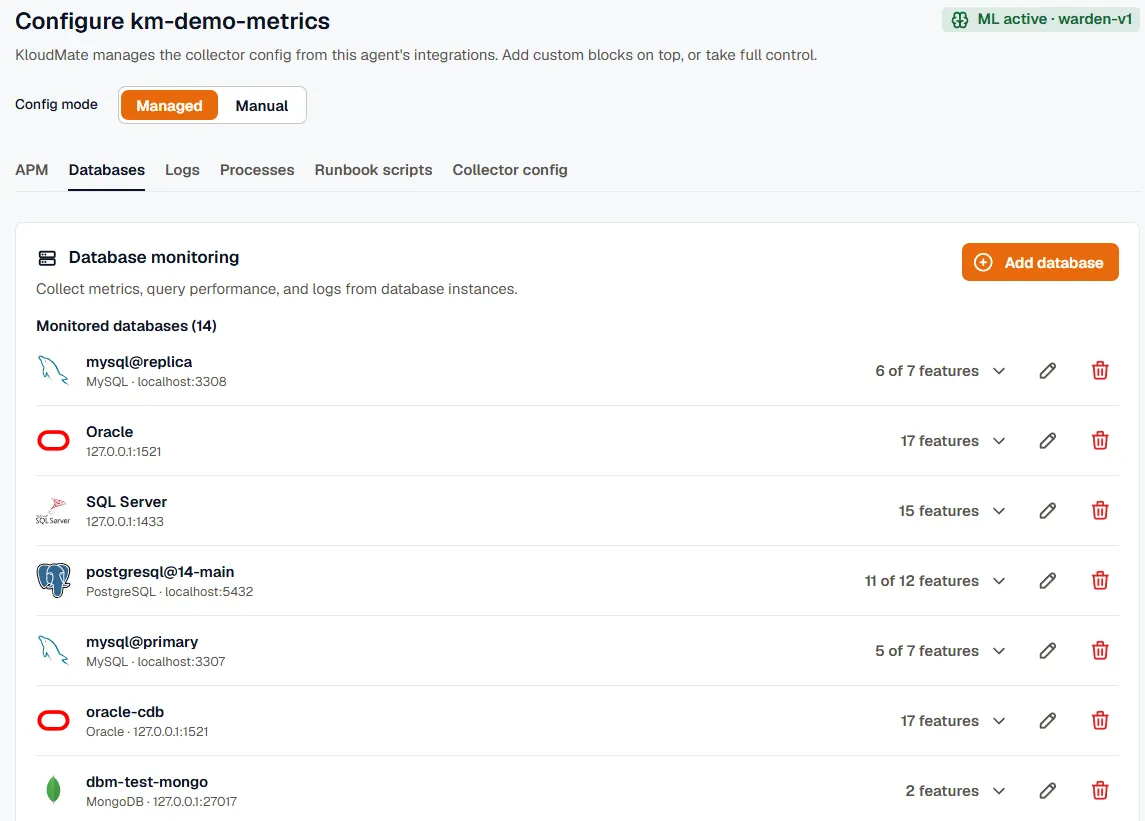
Click Edit on a monitored database to change its coverages, connection, or overrides. Stored passwords stay in place unless you replace them. To turn on a coverage you haven’t enabled yet, expand the database’s feature list and follow Edit to enable.
Click Remove to stop monitoring a database. The change applies within a minute.
Reduce query performance volume
Section titled “Reduce query performance volume”The Query performance coverage sends two kinds of log events. Query samples (db.server.query_sample) are snapshots of the sessions on the database at each collection. Top queries (db.server.top_query) are the most expensive statements since the previous collection. On a busy database, these can add up to thousands of events an hour.
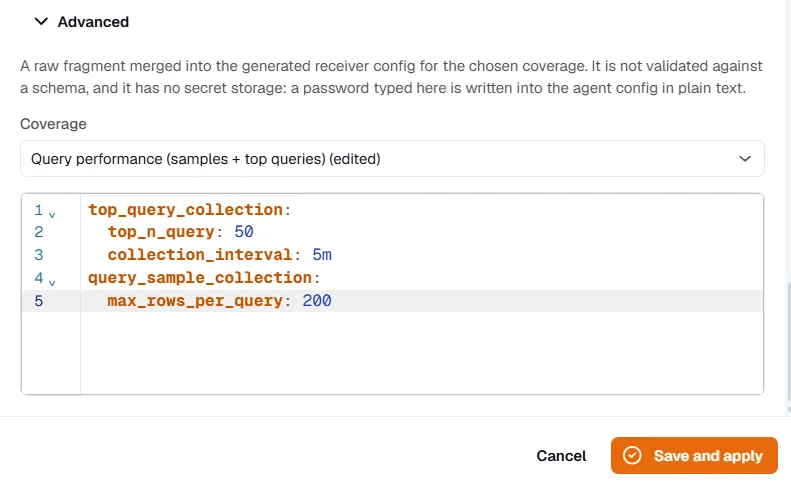
To send fewer, edit the database, expand Advanced, choose the Query performance coverage, and set these keys:
| Engine | Top queries per collection | Top query interval | Sessions per sample |
|---|---|---|---|
| PostgreSQL | top_query_collection.top_n_query (200) | top_query_collection.collection_interval (1m) | query_sample_collection.max_rows_per_query (1000) |
| MySQL and MariaDB | top_query_collection.top_query_count (200) | top_query_collection.collection_interval (1m) | query_sample_collection.max_rows_per_query (100) |
| SQL Server | top_query_collection.top_query_count (250) | top_query_collection.collection_interval (1m) | query_sample_collection.max_rows_per_query (100) |
| Oracle | top_query_collection.top_query_count (200) | top_query_collection.collection_interval (1m) | query_sample_collection.max_rows_per_query (100) |
Defaults are in parentheses. For example, this sends the top 50 PostgreSQL statements every 5 minutes instead of the top 200 every minute, and samples at most 200 sessions:
- Query samples follow the standard metrics interval. The receivers don’t support a separate interval for samples. Don’t set a top-level
collection_intervalin this override: query performance shares a receiver with standard metrics, so it would slow those down too. - Connection poolers produce many idle samples. An idle session is sampled once after each query it finishes, which is how short queries are captured at all. Behind a pooler such as PgBouncer, most connections are idle at any moment, so most samples are idle sessions. Samples can’t be filtered by session state, so lower
max_rows_per_queryto send fewer of them. - The sample row limit isn’t a ranking. When there are more sessions than
max_rows_per_query, the sessions that get sampled aren’t chosen by activity or duration.
PII detection
Section titled “PII detection”Database query logs and database spans pass through the agent’s PII detection before they leave the host. Records that contain personal data are tagged with km.pii.detected, km.pii.critical, and km.pii.categories. The matched values themselves aren’t copied into these attributes.
The agent’s configuration page shows the status of the on-host machine learning classifier: ML active when it’s running, ML not responding when it stopped reporting, ML not installed, or PII detection off.