Configuration & Data
Set these environment variables on the Lambda function, alongside the layer. For the full walkthrough, start with Setup.
Required
Section titled “Required”| Variable | Value |
|---|---|
OTEL_EXPORTER_OTLP_ENDPOINT | Your KloudMate OTLP endpoint, for example https://otel.kloudmate.com:4318. |
OTEL_EXPORTER_OTLP_HEADERS | Your ingest key as an Authorization header: Authorization=YOUR_KLOUDMATE_API_KEY. Create a key under API Keys. |
Optional
Section titled “Optional”| Variable | Value |
|---|---|
OTEL_SERVICE_NAME | The name your function appears under in KloudMate. Defaults to the function name. |
OTEL_LOGS_EXPORTER | Set to none to stop sending logs — for example, when the AWS account integration already collects this function’s logs from CloudWatch. |
OTEL_METRICS_EXPORTER | Set to none to stop sending metrics. |
OTEL_TRACES_EXPORTER | Set to none to stop sending traces. |
OTEL_LOG_LEVEL | Set to debug to print the extension’s own diagnostics to CloudWatch — useful when telemetry isn’t showing up. |
Metrics
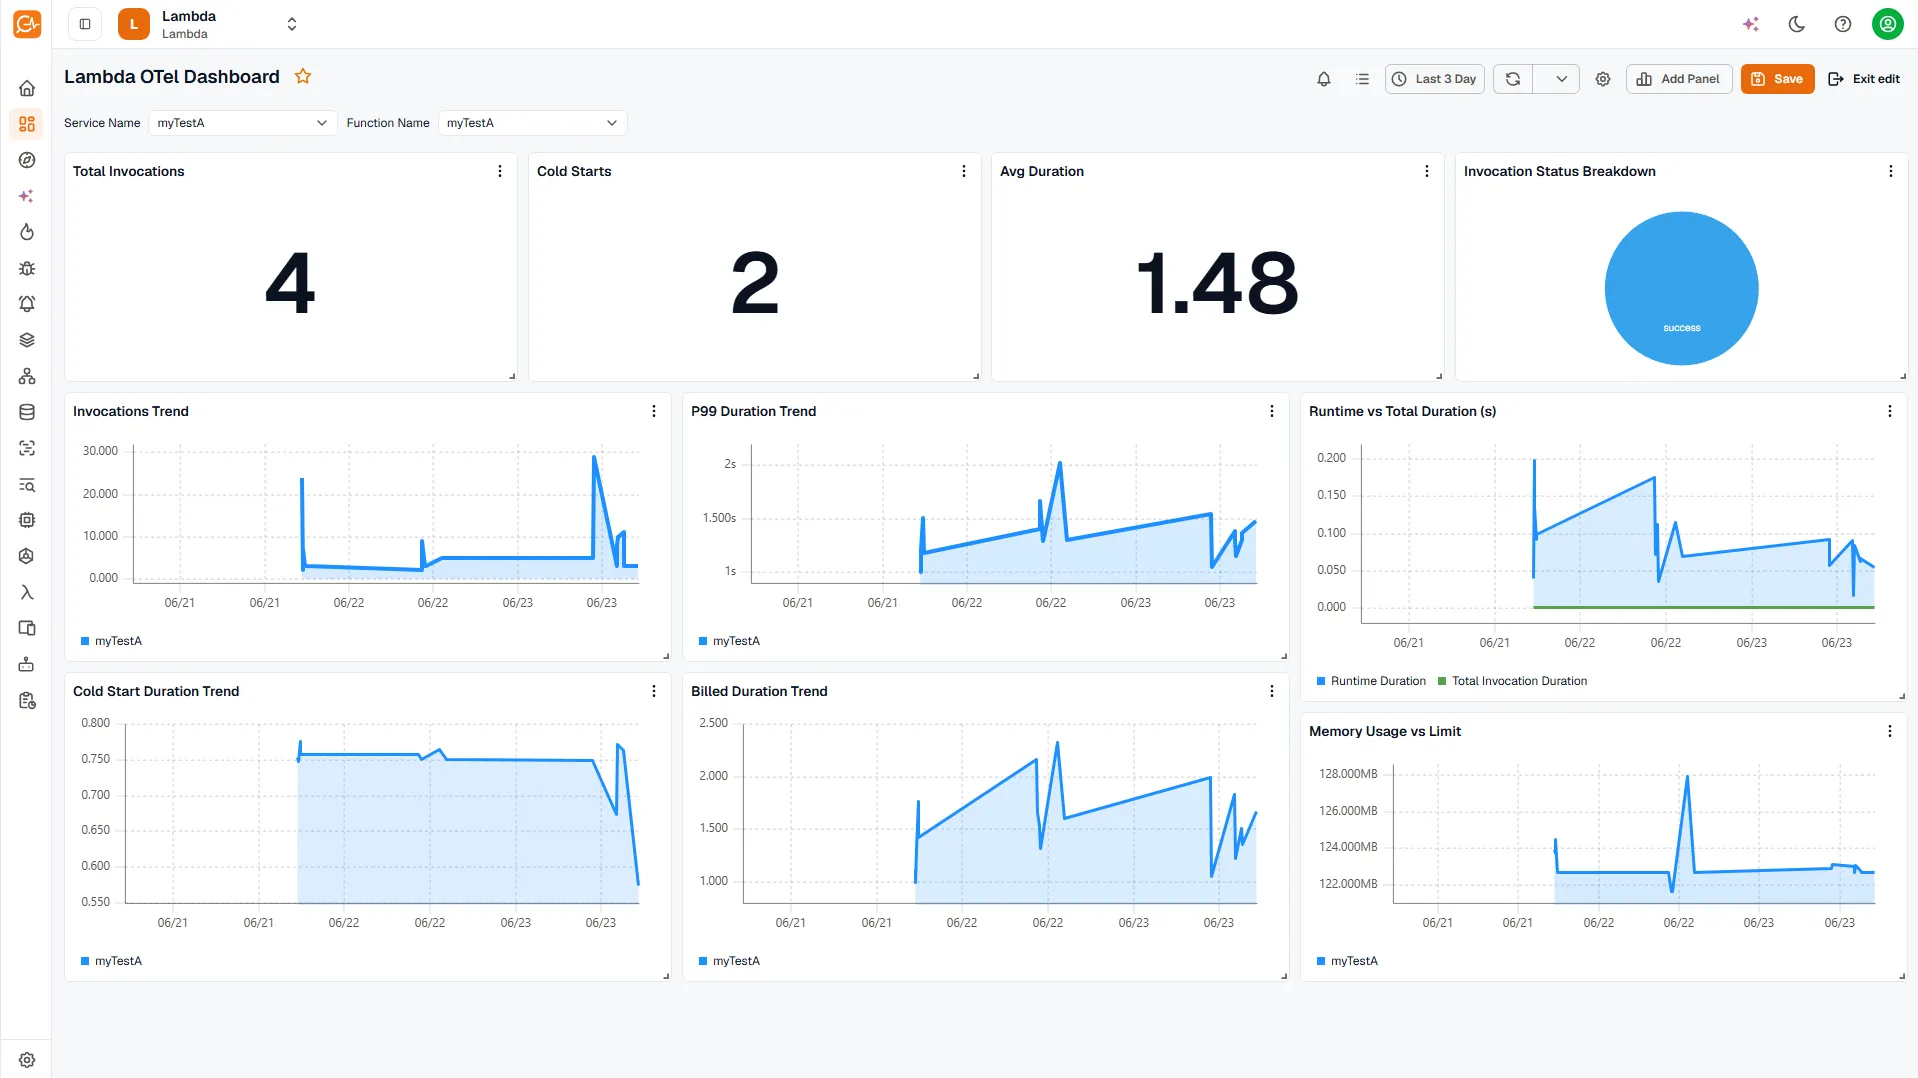
Section titled “Metrics”The extension reports these for every invocation. Use the names to build dashboards and alerts in KloudMate.
| Metric | Unit | What it measures |
|---|---|---|
faas.invoke_duration | seconds | Total invocation time |
faas.init_duration | seconds | Cold-start time (cold starts only) |
faas.mem_usage | bytes | Peak memory used |
aws.lambda.billed_duration | seconds | AWS billed time |
aws.lambda.produced_bytes | bytes | Response payload size |
aws.lambda.runtime_duration | seconds | Handler time, not counting the extension |
aws.lambda.restore_duration | seconds | SnapStart restore duration |
Each metric is tagged with the request ID, a cold-start flag, and the invocation status, so you can filter and group by any of them.
You can use these metrics to build dashboards that track your function’s health and resource consumption over time.
Logs and traces
Section titled “Logs and traces”Your function’s stdout/stderr lines arrive as logs, with the severity read from each line. Without active tracing, you still get logs and metrics.
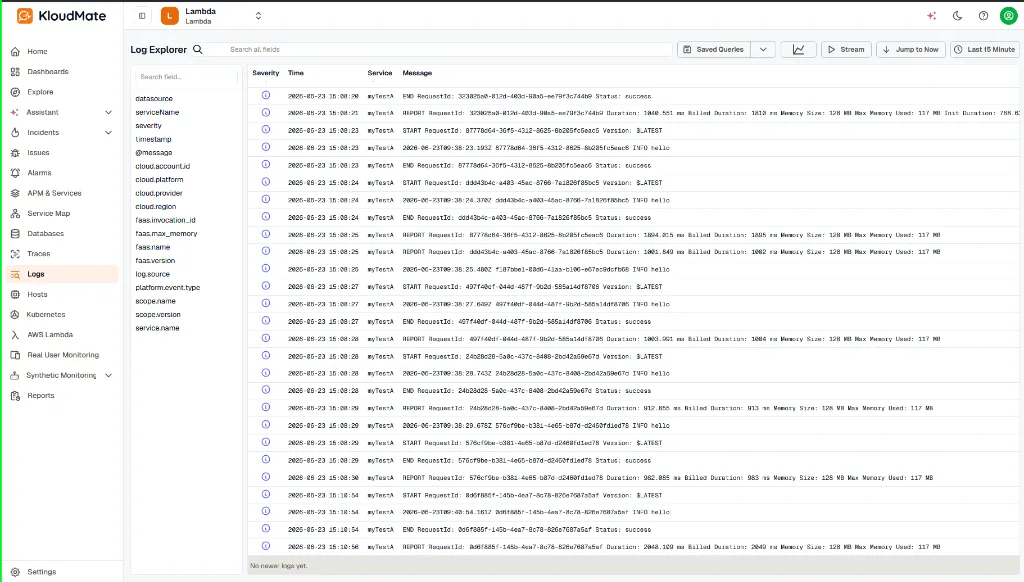
Logs in Log Explorer
Section titled “Logs in Log Explorer”Every logs or print statement from your function code is forwarded directly to the Log Explorer, alongside lifecycle events like START, END, and REPORT requests.
Trace Correlation
Section titled “Trace Correlation”With X-Ray active tracing enabled, each invocation also produces a trace. This connects the logs from that specific execution to a unified trace timeline.
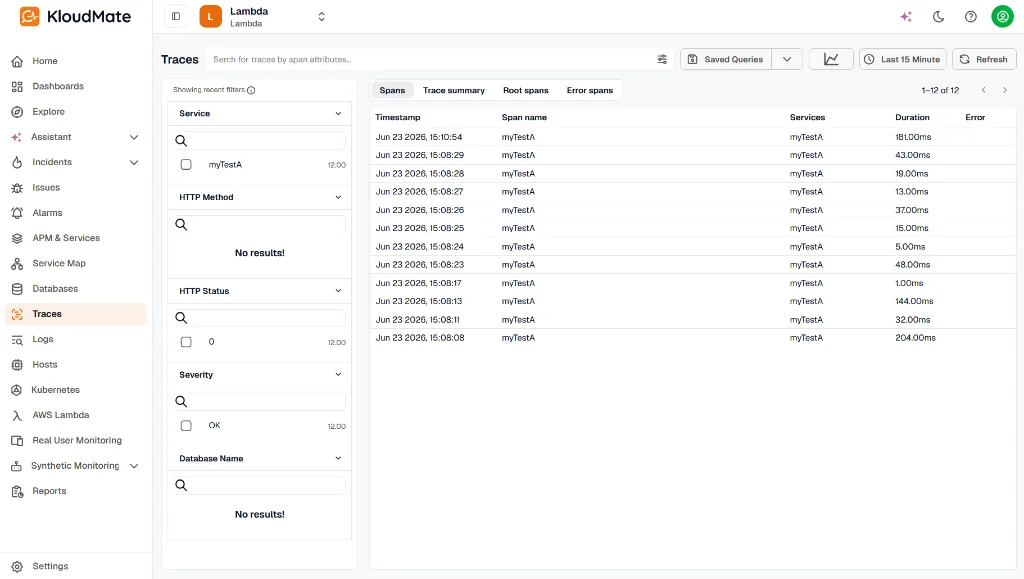
In the Traces explorer, you can list and filter invocations by their duration and status:
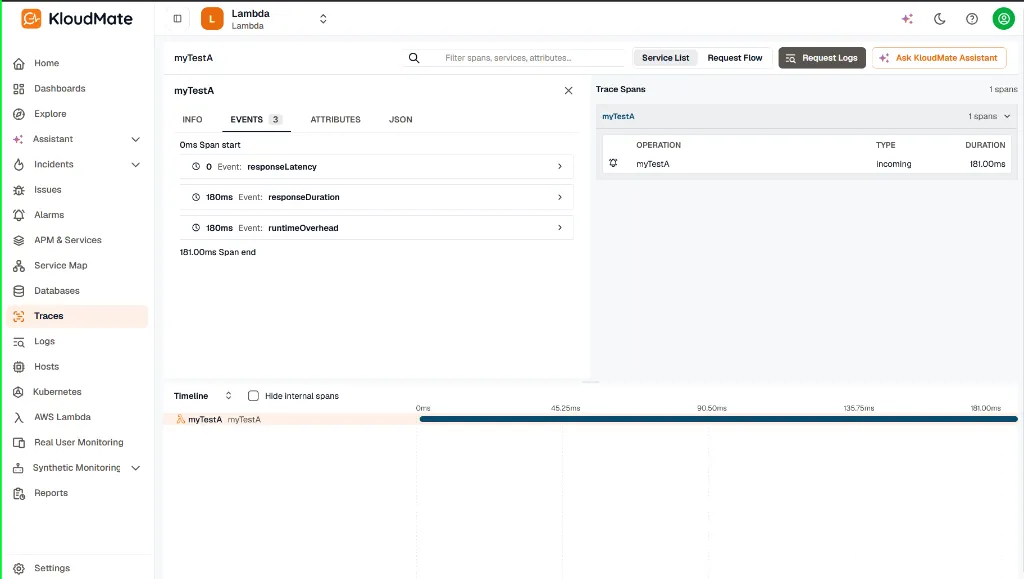
Selecting an execution trace opens a detailed breakdown of the execution timeline. This breaks down the lifecycle into sub-spans like responseLatency, responseDuration, and runtimeOverhead: