

Kubernetes Monitoring
Kubernetes Monitoring in KloudMate gives you visibility into cluster health, workload availability, resource usage, pod behavior, and related telemetry collected by the KloudMate Agent.
KloudMate organizes Kubernetes data into tabs for clusters, nodes, namespaces, pods, storage, workloads, and jobs, plus a map of the traffic between workloads, so you can move from fleet-level health to pod-level troubleshooting quickly.
What This Covers
Section titled “What This Covers”- cluster, node, namespace, pod, and workload metrics
- container logs and Kubernetes events
- optional application telemetry through Kubernetes auto-instrumentation
- prebuilt dashboards and alerting workflows built on top of the collected data
Install the Kubernetes Agent
Section titled “Install the Kubernetes Agent”Use the Kubernetes Agent installation guide to deploy the KloudMate Agent into your cluster.
The same installation flow supports self-managed Kubernetes and managed services such as AKS, EKS, and GKE Standard. For GKE Autopilot, see the Monitoring GKE Autopilot Clusters guide.
What You Can Do After Installation
Section titled “What You Can Do After Installation”- detect performance issues early
- track CPU and memory utilization across nodes, pods, and workloads
- identify unhealthy or unstable workloads
- investigate incidents with logs, events, and metrics together
- build dashboards and alerts around cluster health
Once data is flowing, use:
- Explore for ad hoc queries
- Log Explorer to investigate pod logs
- Dashboards for curated visualizations
- Alerts to notify on resource or availability issues
Unified Monitoring for Apps and Databases
Section titled “Unified Monitoring for Apps and Databases”When applications and databases run inside Kubernetes, KloudMate can correlate their telemetry with infrastructure metrics from the same cluster.
Use these guides when you need deeper service-level visibility:
What Kubernetes Monitoring Covers
Section titled “What Kubernetes Monitoring Covers”KloudMate provides visibility into all major Kubernetes components:
Clusters
Section titled “Clusters”The Clusters tab lists every connected cluster, with overall health, capacity, and scale at a glance. Use it as the starting point before drilling into a specific node, namespace, or workload.
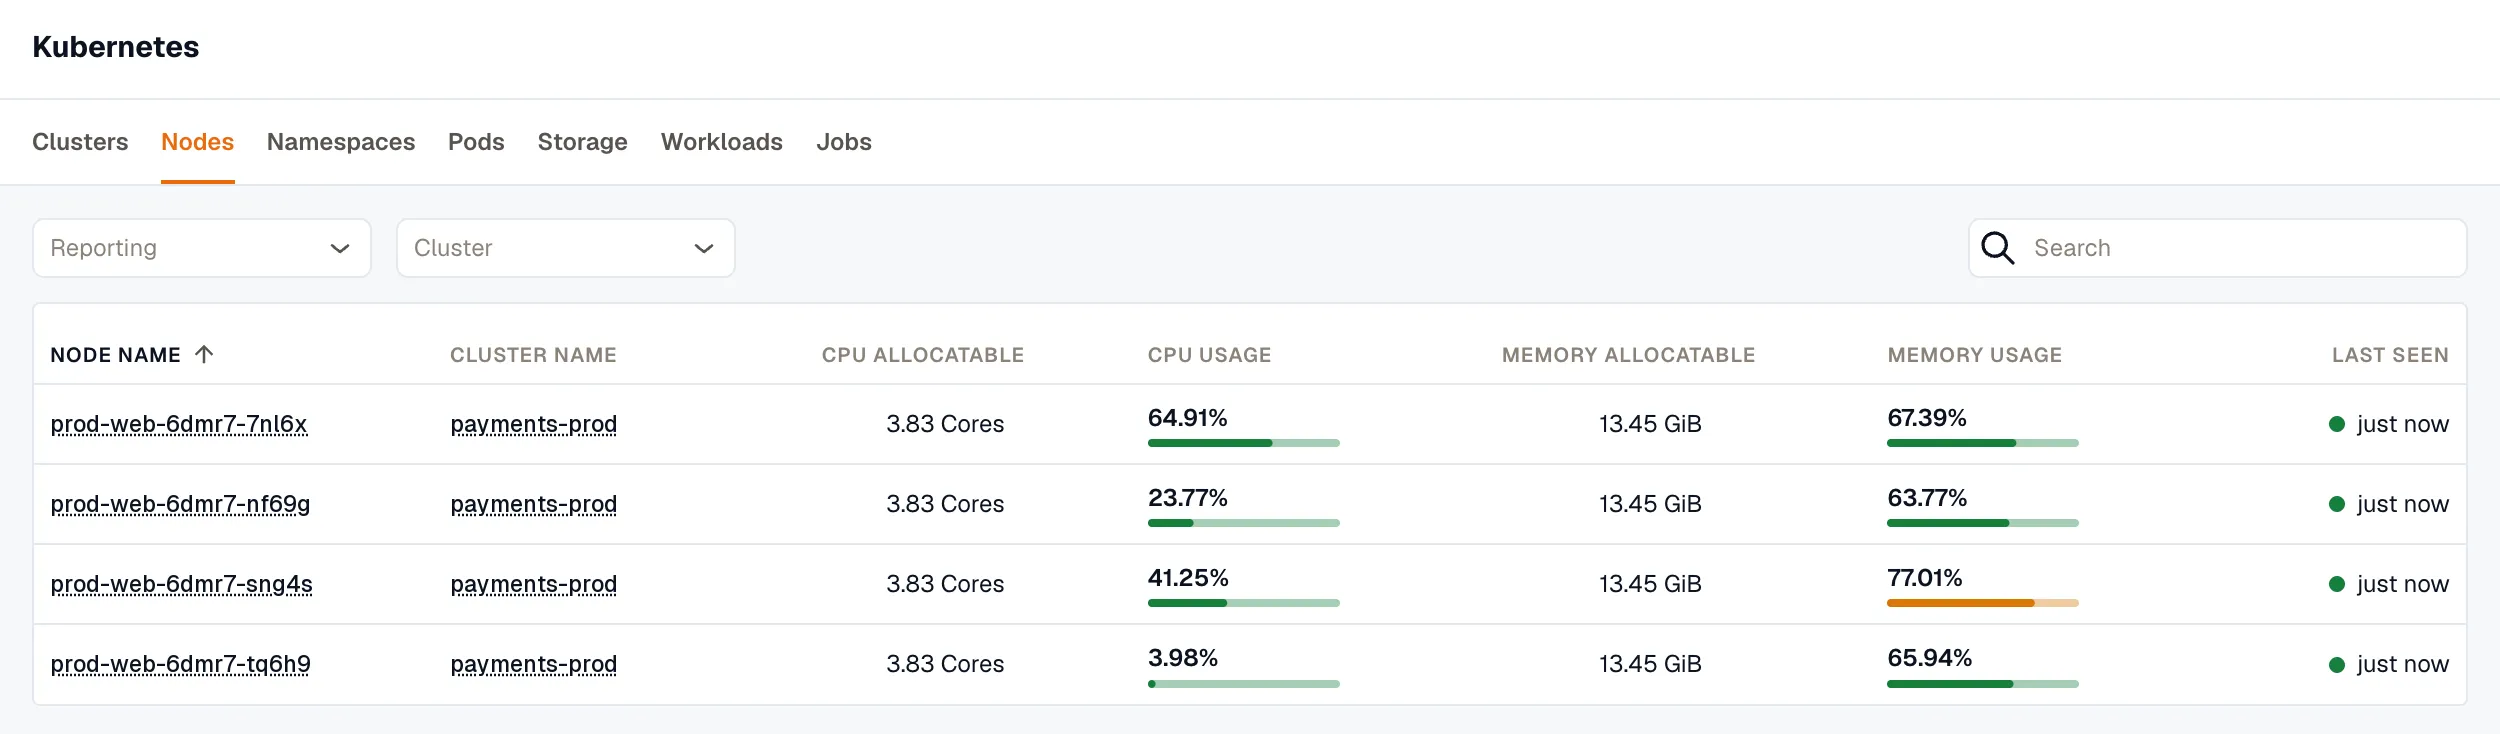
The Nodes tab lists every node across your clusters, showing node health and infrastructure-level resource usage: allocatable CPU and memory alongside current usage for each. Use it to spot nodes running hot before they affect scheduling.
Namespaces
Section titled “Namespaces”The Namespaces tab breaks resource distribution down by namespace, so you can see how CPU, memory, and workload counts spread across the teams, applications, or environments sharing a cluster.
The Pods tab lists every pod across your clusters, with its performance, restart count, and resource consumption. Use it to find pods that are restarting frequently or running hot before they affect the workloads they belong to.
Storage
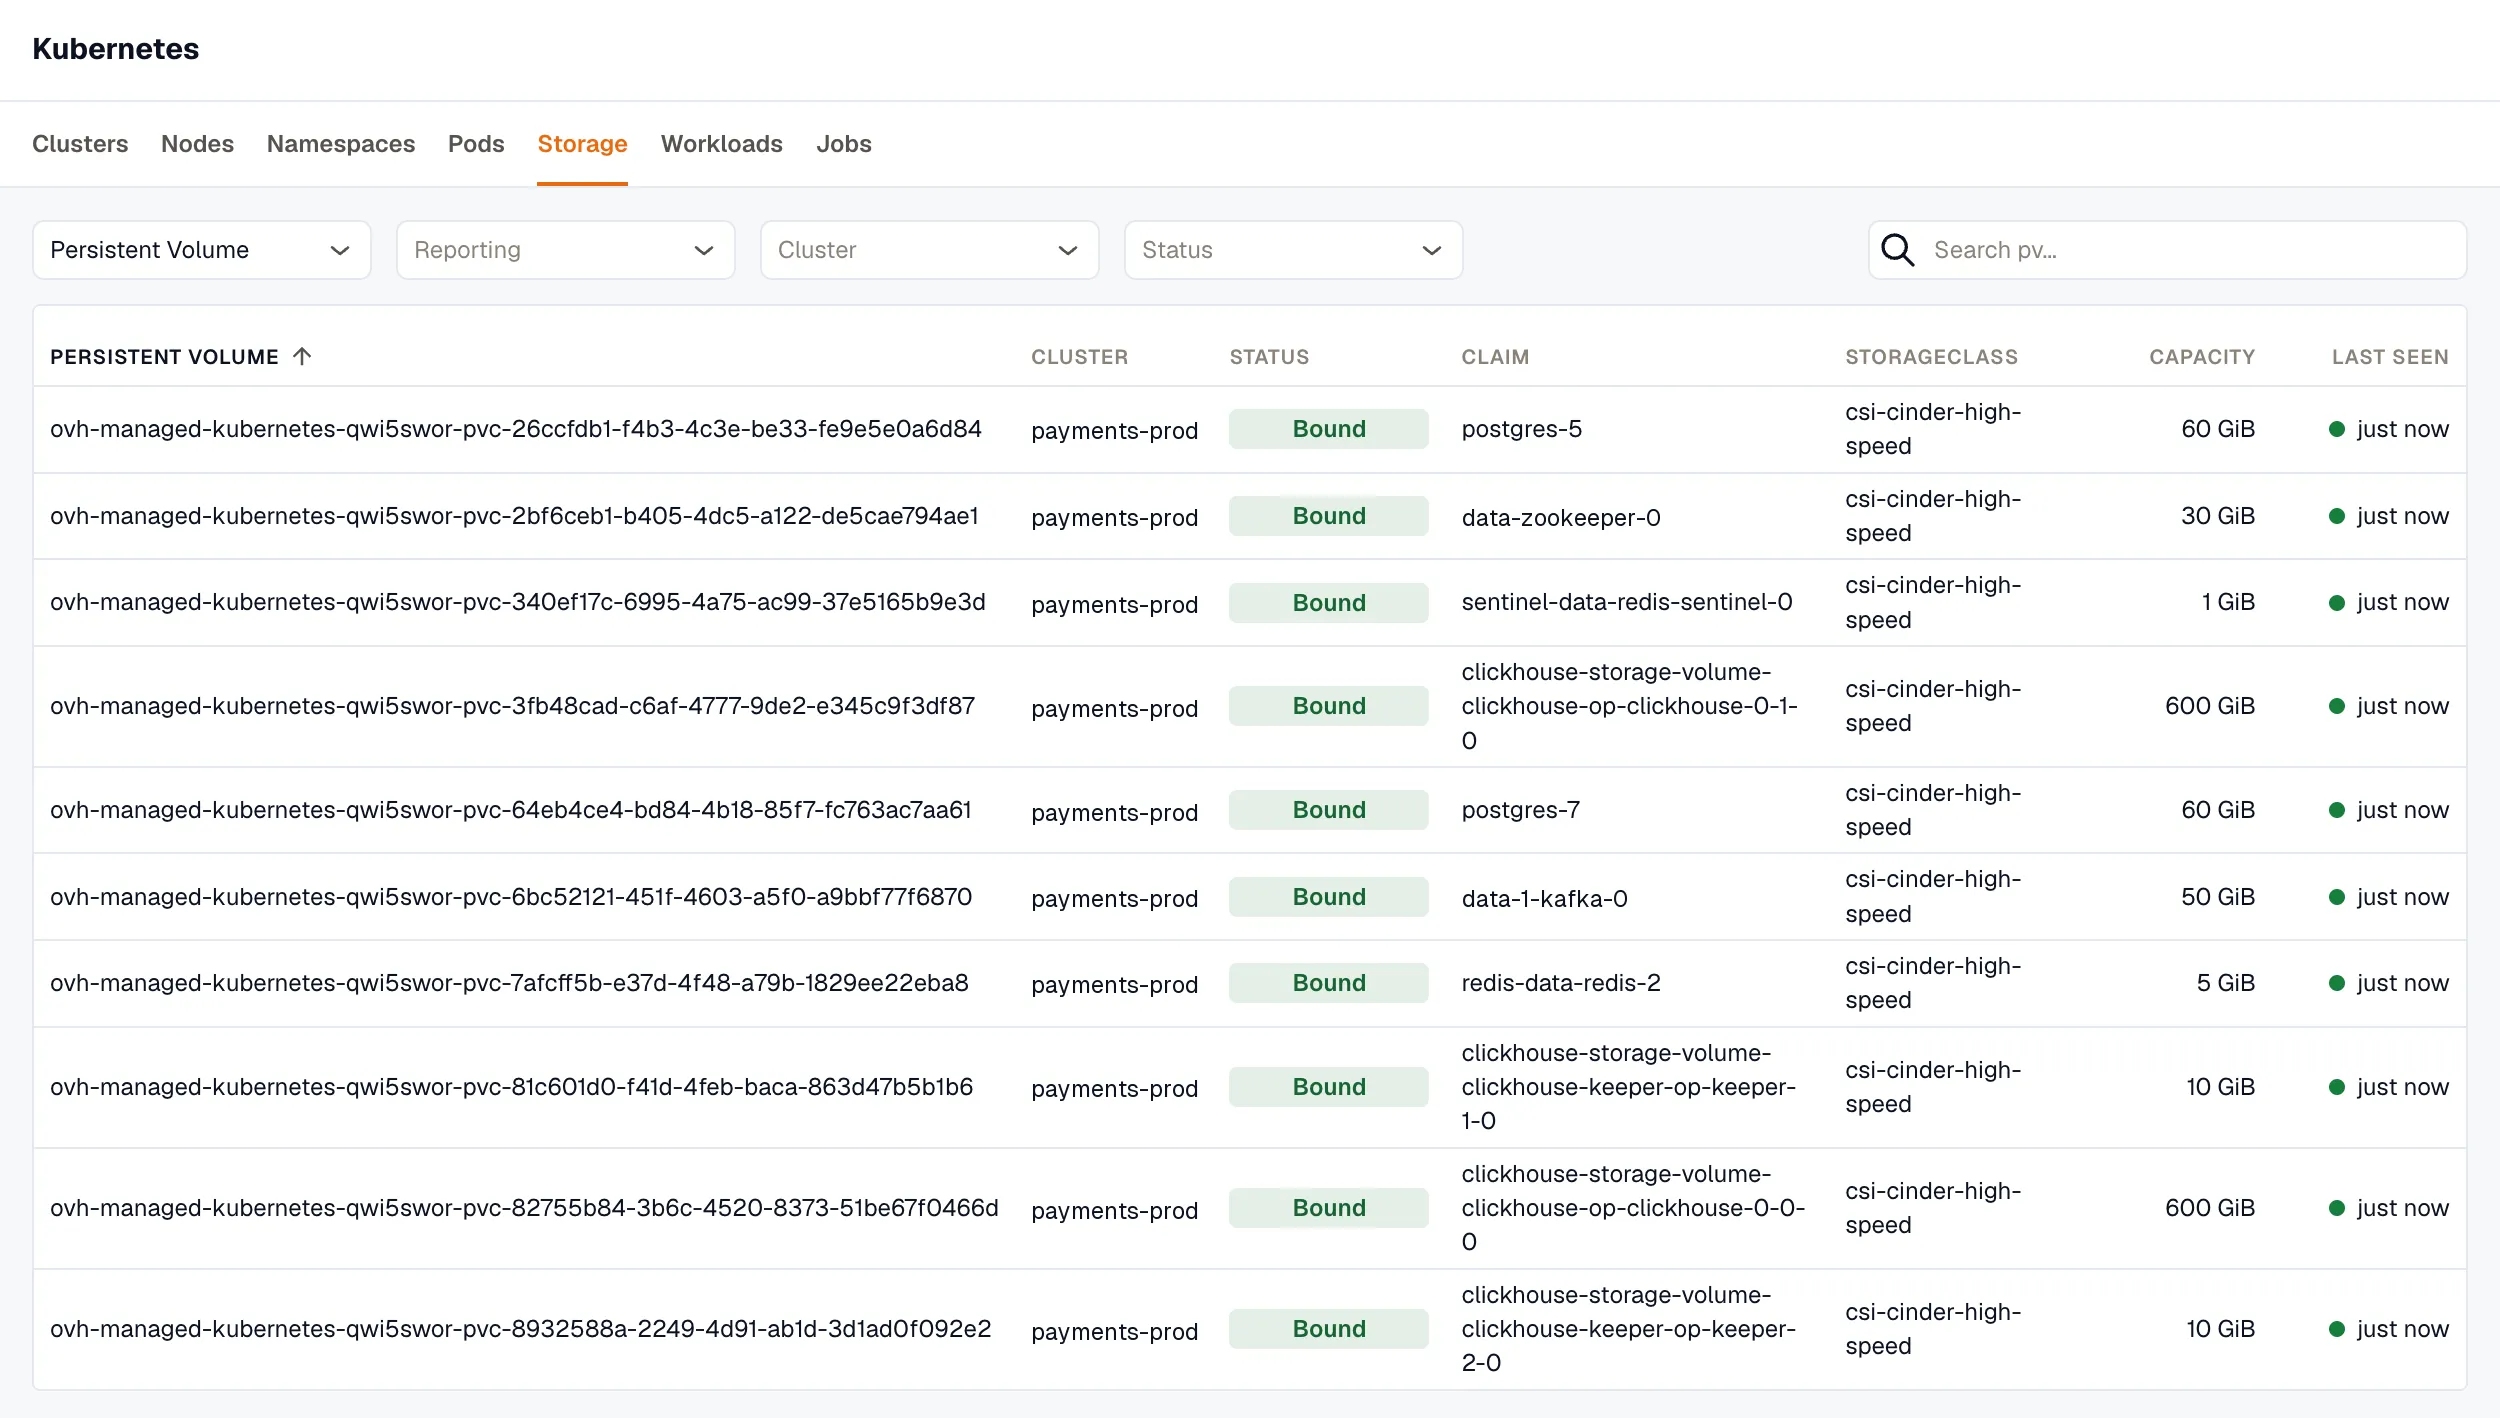
Section titled “Storage”The Storage tab lists Persistent Volumes across your clusters, with their status, claim, storage class, and capacity. Use it to see what’s provisioned and bound without checking each cluster individually. To list Persistent Volume Claims instead, select Persistent Volume Claim as the storage type.
Workloads
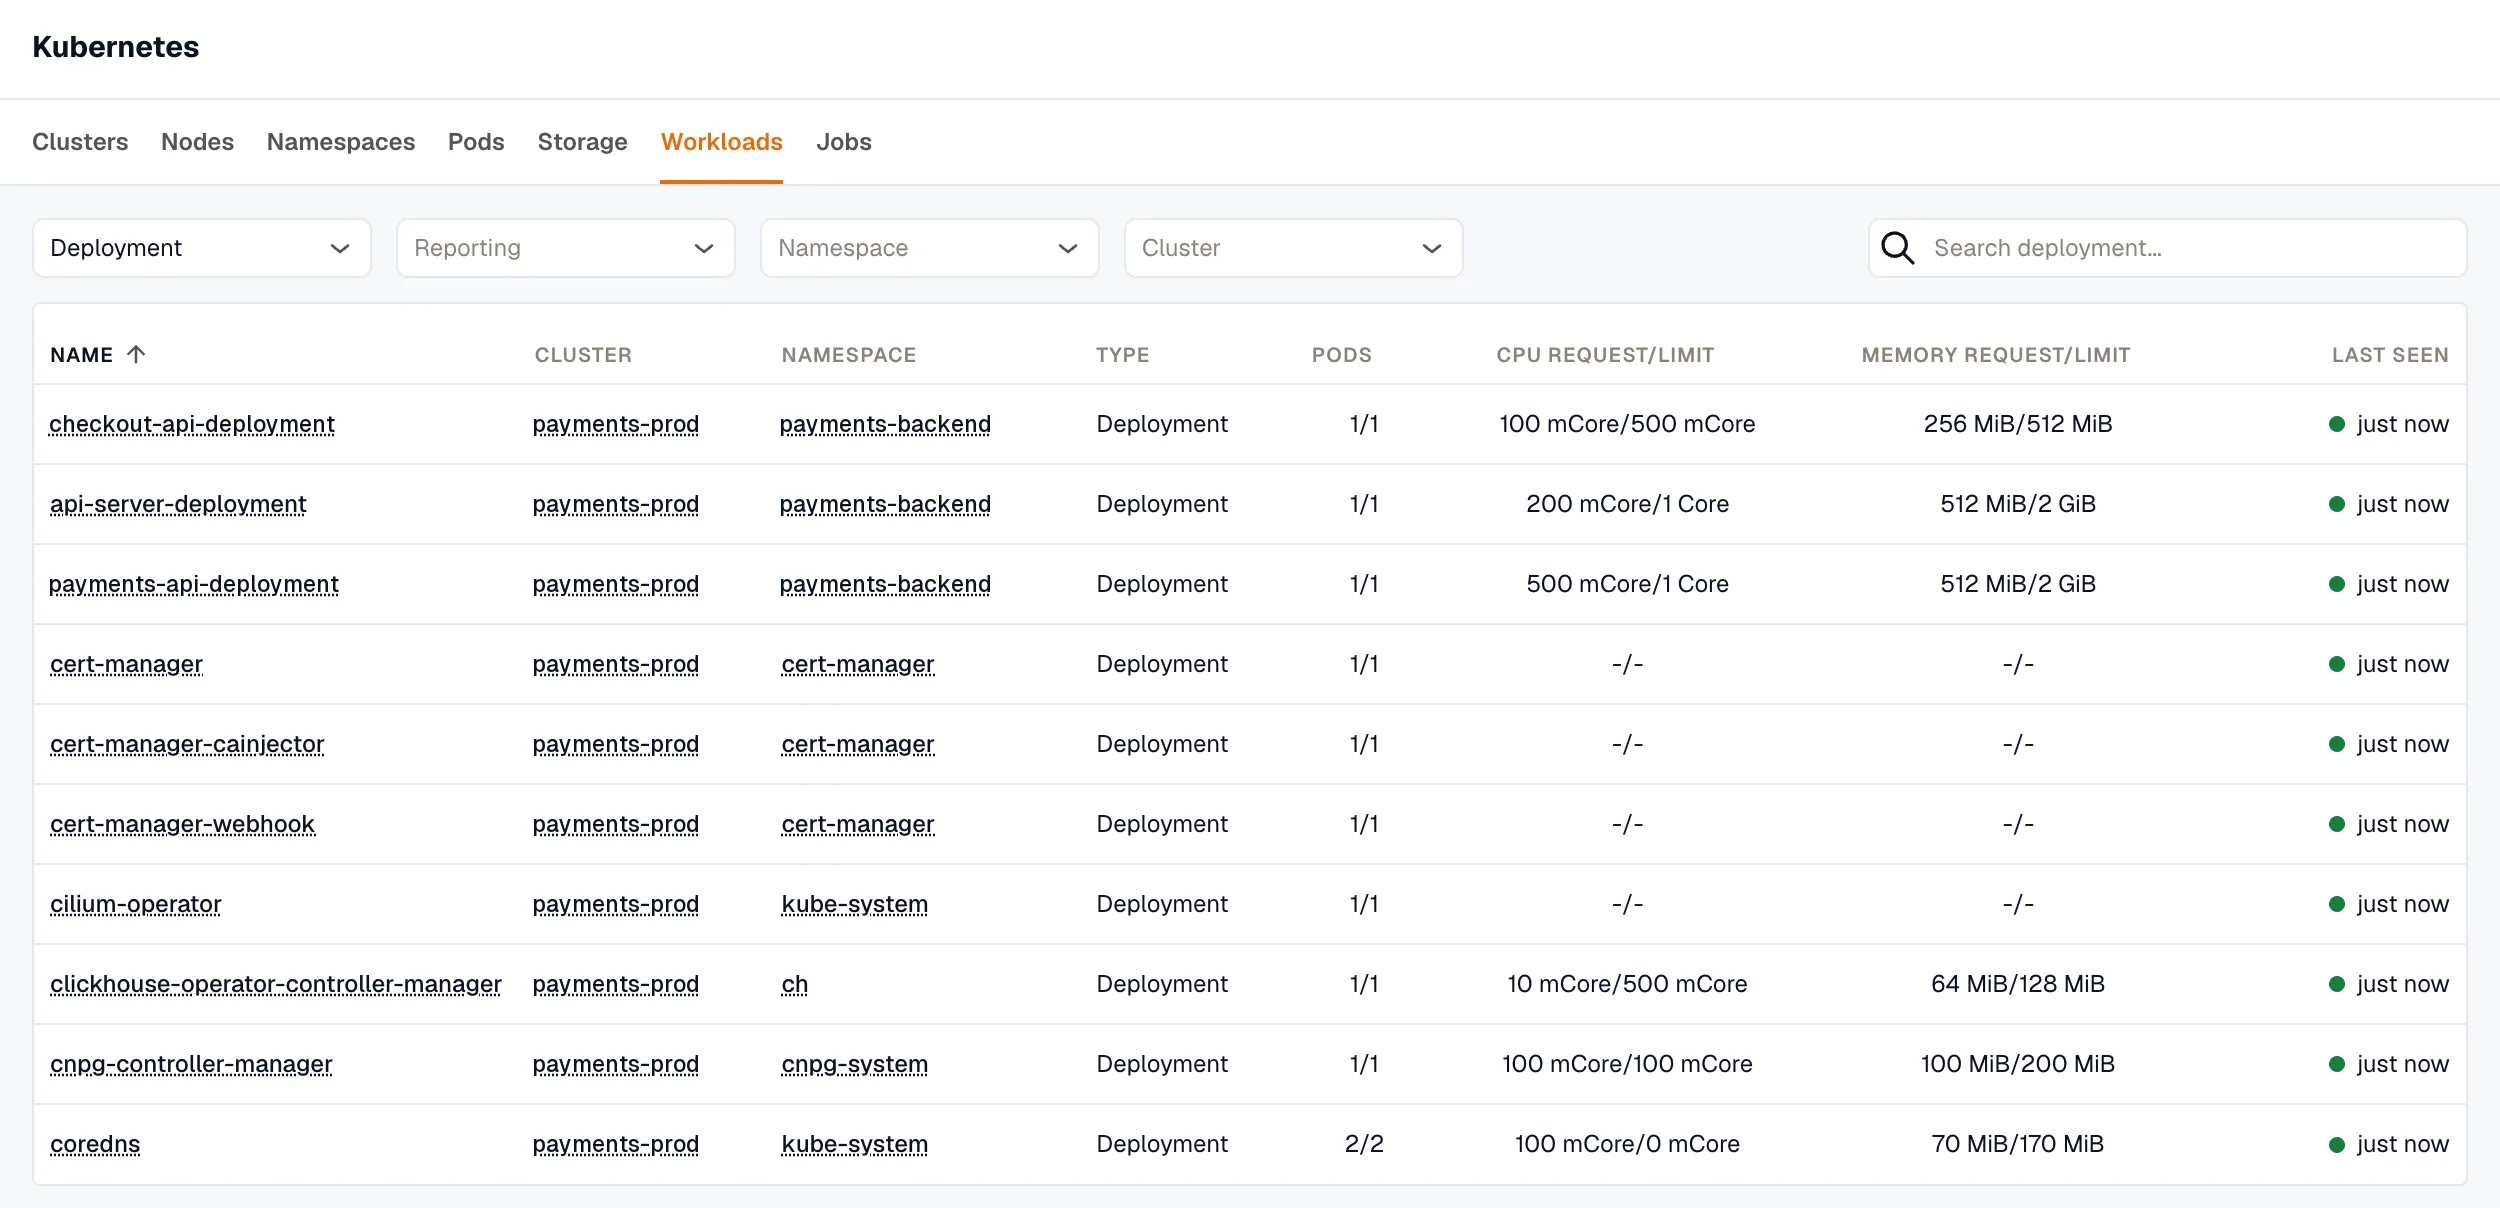
Section titled “Workloads”The Workloads tab lists deployments, daemonsets, statefulsets, and other workload types across your clusters, showing their health and availability alongside pod counts and CPU and memory requests and limits. Filter by workload type, namespace, or cluster to narrow the list.
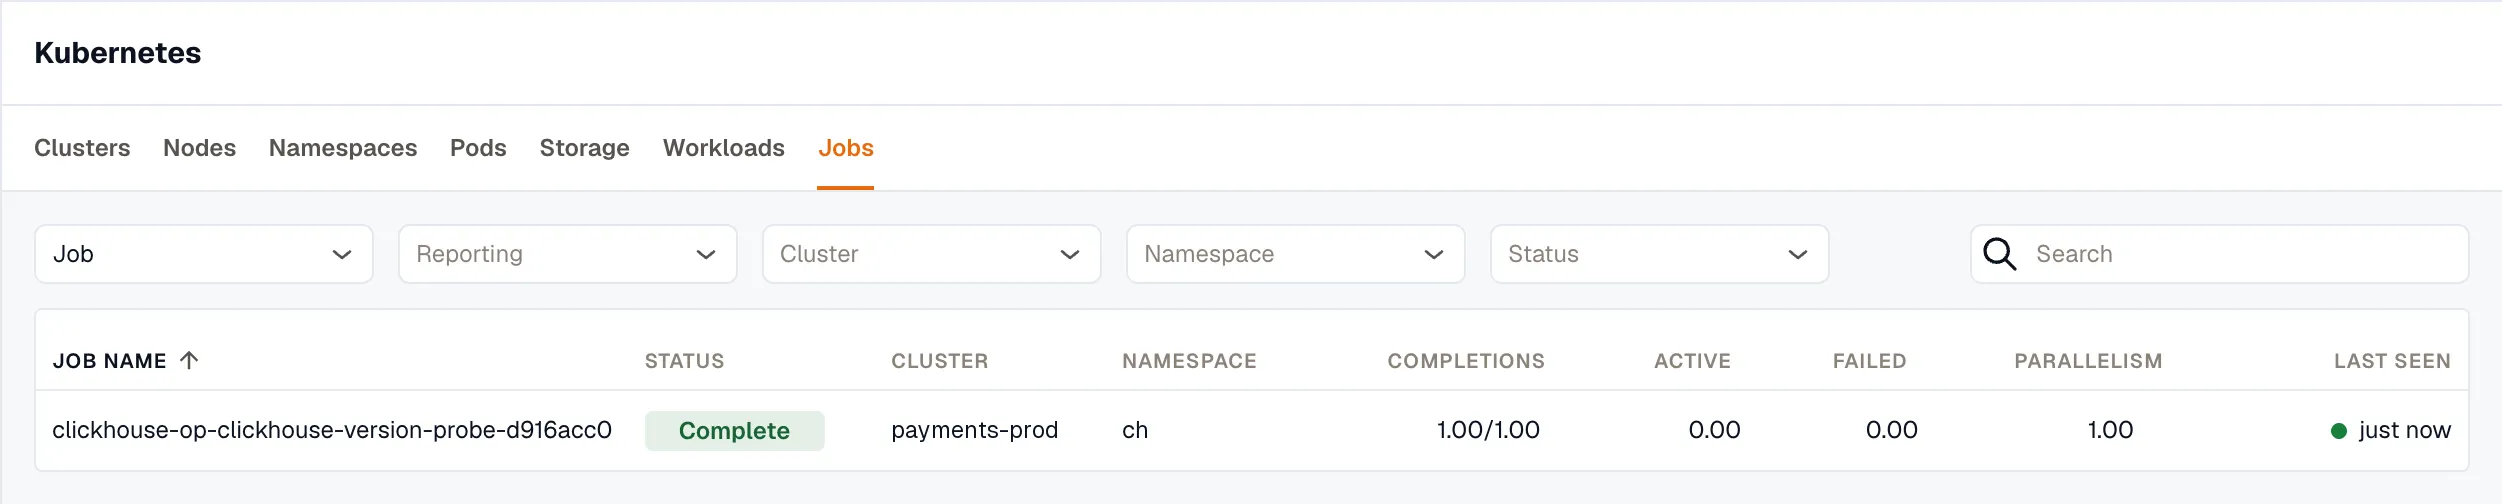
The Jobs tab lists Jobs across your clusters, with their status, completions (succeeded out of desired, the same count kubectl shows), and active, failed, and parallelism counts. Filter by cluster, namespace, or status to find Jobs that failed or haven’t completed. To list CronJobs instead, select CronJob as the job type. Each CronJob shows its cluster, namespace, and number of active jobs.
The Map tab shows how the workloads in a cluster talk to each other. Pick a cluster, then pick a namespace or keep All namespaces.
- All namespaces shows one box per namespace, with how many workloads and Services it has and how many of them are alerting. A line joins two namespaces whose workloads talk to each other. Click a namespace to open its map.
- A single namespace shows its Deployments, StatefulSets, DaemonSets, and Services, with a line between each pair that talks. Workloads and Services in other namespaces that they talk to are dimmed. Click one to open its namespace.
Click a workload or Service to open a side panel with its firing alerts, what it connects to, and Open in Kubernetes (Open in Inventory for a Service).
The map draws workloads and Services that sent data in the last 2 hours, up to 200 at a time. In a larger cluster, pick a namespace to see all of them. Nodes aren’t drawn. In a namespace, workloads and Services with no traffic are counted under the map instead, with a link to the namespace.
The lines come from network flow data that the KloudMate agent collects with eBPF, so the nodes need a kernel that supports it. See eBPF requirements. Without flow data, the map draws no lines and notes that the cluster sends no traffic data.
See what a resource connects to
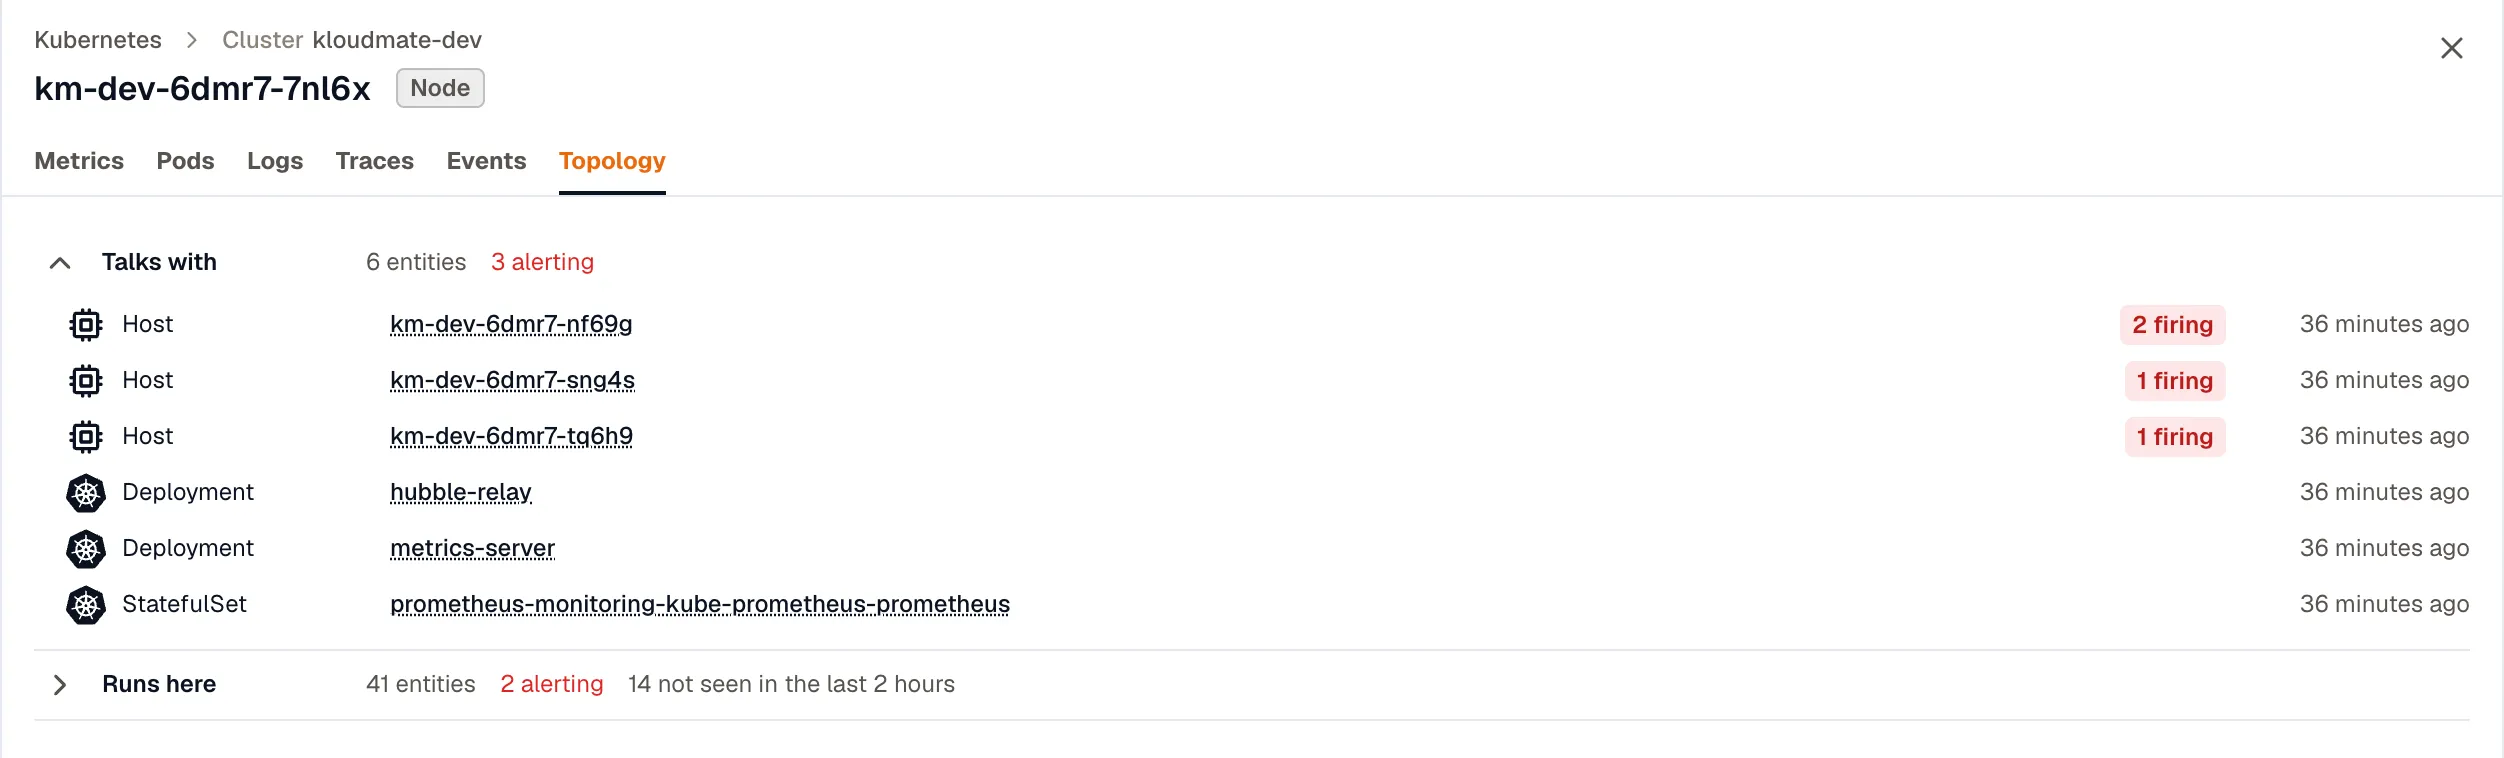
Section titled “See what a resource connects to”Open a node, pod, Deployment, StatefulSet, or DaemonSet, and select the Topology tab, the last tab in the drawer. It lists what the resource connects to, grouped by relation, such as Talks with for network traffic and Runs here for what runs on a node.
Each group shows how many of its resources are alerting, and a group with alerting resources opens by default. Hover over a resource’s firing count to see its alerts, and click an alert to open its rule in a new tab. Resources not seen in the last 2 hours are counted but not listed.
Find resources that stopped reporting
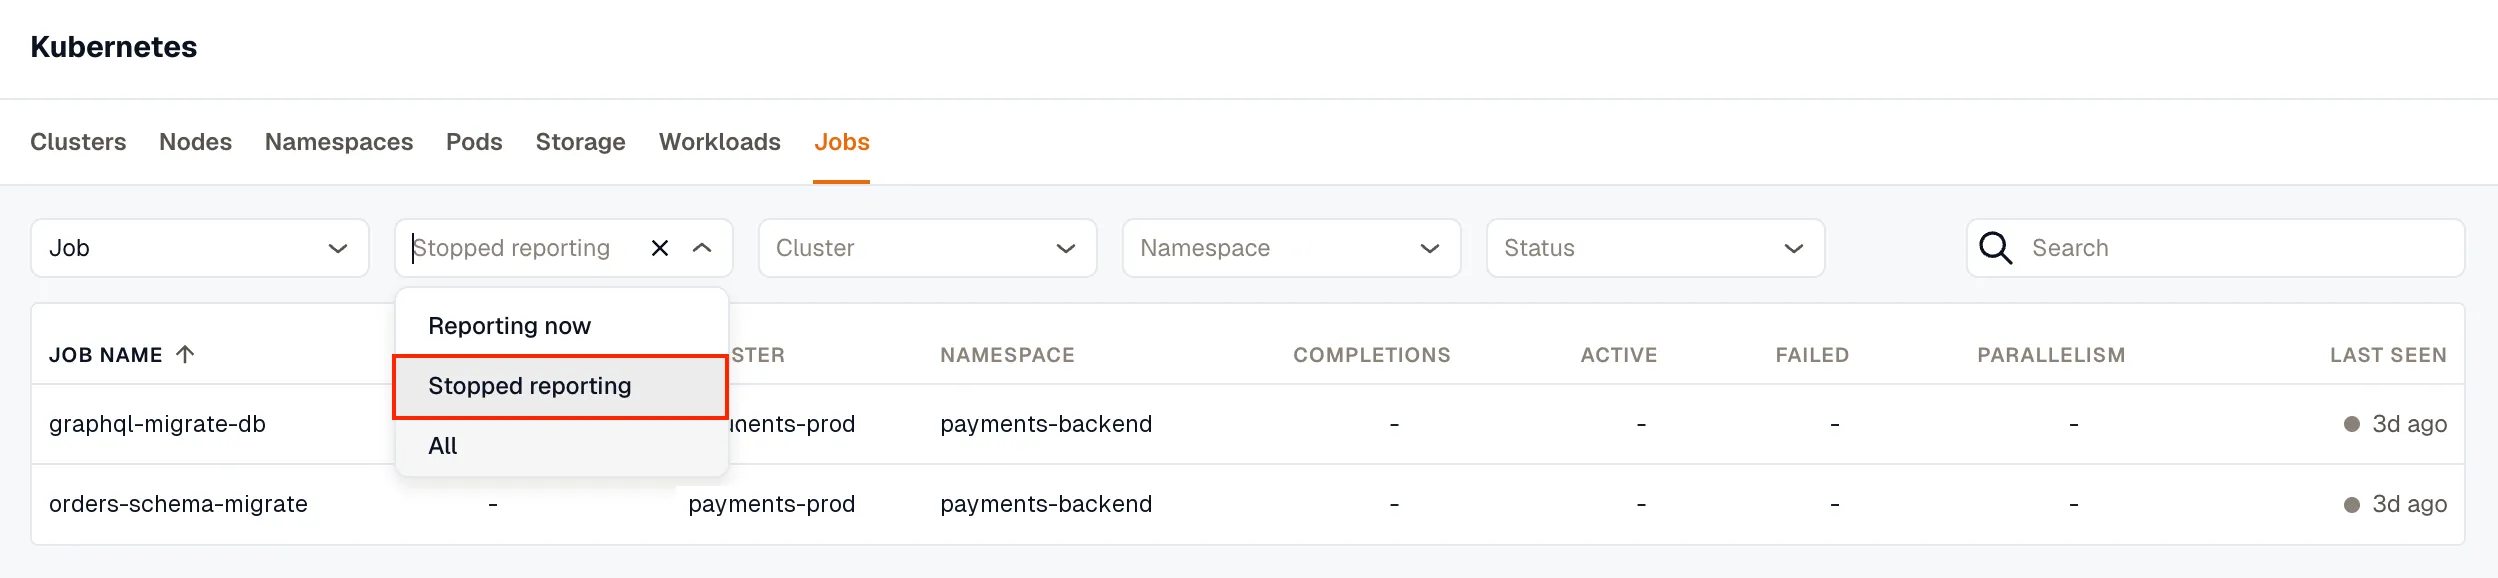
Section titled “Find resources that stopped reporting”Every tab includes a Last seen column. A resource stays in the list for seven days after it last reported, and its Last seen dot turns from green to gray once it has gone 15 minutes without reporting. If a resource reported nothing in the selected time range, its metric cells show a dash.
Set the Reporting filter to Reporting now to list only live resources, or to Stopped reporting to find resources that stopped sending data. When the filter is empty, the pod, ReplicaSet, and Job lists show only resources that are reporting now, and every other list shows everything seen in the last seven days.
Validation Checklist
Section titled “Validation Checklist”After the agent is installed:
- open the Kubernetes module in KloudMate
- confirm that clusters and nodes appear within a few minutes
- verify CPU and memory metrics for nodes, pods, and workloads
- validate logs and events in the related views if those features are enabled
KloudMate also provides prebuilt dashboard templates for common Kubernetes views. See Create a Dashboard for template usage.
Common Kubernetes Metrics
Section titled “Common Kubernetes Metrics”When Kubernetes Monitoring is enabled, KloudMate automatically collects a set of common Kubernetes metrics. No additional configuration is required.
Cluster and Workload Metrics
Section titled “Cluster and Workload Metrics”- k8s_container_cpu_limit
- k8s_container_cpu_request
- k8s_container_memory_limit
- k8s_container_memory_request
- k8s_container_ready
- k8s_container_restarts
- k8s_deployment_available
- k8s_deployment_desired
Node and Container Metrics
Section titled “Node and Container Metrics”- container_cpu_time
- container_cpu_usage
- container_memory_usage
- container_memory_working_set
- k8s_node_cpu_usage
- k8s_node_memory_usage
- k8s_node_network_io
These metrics are sourced from the upstream OpenTelemetry receivers: