

Kubernetes
Deploy the KloudMate Agent to Kubernetes with a DaemonSet and Deployment.
What the Kubernetes Agent Monitors
Once installed, the Kubernetes Agent collects:
- Cluster metrics: CPU, memory, disk, network usage
- Node metrics: Resource usage, health, availability
- Namespace metrics: Workloads, events per namespace
- Pod metrics: CPU, memory, restarts, and lifecycle events
- Workload metrics: Deployment and replica status, resource utilization
- Container logs: stdout/stderr from pods
- Cluster events: Pod failures, scaling events, and other events
- Optional APM metrics: Instrumented applications (Python, Node.js, Java, .NET, Go)
Accessing Your Data
Section titled “Accessing Your Data”View all Kubernetes data in these KloudMate sections:
1. Kubernetes Monitoring
- Explore metrics and events for your cluster, nodes, namespaces, pods, and workloads
- Track availability, resource usage, pod restarts, and workload health
2. Dashboards
- Use the following pre-built dashboards to visualize Kubernetes metrics:
- Build custom dashboards for specific workloads, namespaces, or pods
3. Log Explorer
- Search and filter pod logs and cluster events
- Correlate logs with metrics to troubleshoot container or application issues
Install Agent
Section titled “Install Agent”Step 1: Getting started
Section titled “Step 1: Getting started”Use the KloudMate Kubernetes Agent to monitor your Kubernetes infrastructure and optionally your applications (APM) without any code changes.
Pre-requisites
- Kubernetes version 1.24 or above
- Helm version 3.0 or above
- Cert Manager version v1.18.2 or above
- Network access and permissions from Before you start if your outbound traffic is restricted
Step 2: Install Cert Manager
Section titled “Step 2: Install Cert Manager”Skip this step if you already have Cert Manager installed.
Step 3: Enter cluster details
Section titled “Step 3: Enter cluster details”Provide a name for your Kubernetes cluster. This name identifies the cluster inside KloudMate.
Step 4: Set preferences
Section titled “Step 4: Set preferences”Configure how KloudMate should collect data from this cluster:
- Collect container logs: Turn this on to collect container logs from the cluster.
- Enable auto instrumentation for APM: Turn this on to install the APM components, including the OpenTelemetry Operator. After install, you choose per workload whether to trace it, and how — nothing is traced until you do. Supported SDK runtimes are Python, Node.js, Java, and .NET; Go and other runtimes are traced with eBPF.
- Monitored namespaces: Enter a comma‑separated list of namespaces to discover workloads in for APM (for example,
redis, kafka, prod-app).
Step 5: Run the installation command
Section titled “Step 5: Run the installation command”The UI generates a Helm command from your inputs. Run it in your terminal to install the KloudMate Agent in your Kubernetes cluster.
Installing the Agent on Tainted Nodes
Section titled “Installing the Agent on Tainted Nodes”If your Kubernetes cluster has nodes with taints, the agent pods need matching tolerations to be scheduled. By default, the agent includes no tolerations. You can add them during installation with Helm parameters.
Example Helm installation command with tolerations:
This example defines two tolerations to match the taints on the cluster nodes, so the agent pods can schedule on all the nodes they need.
APM Setup Instructions
Section titled “APM Setup Instructions”There are two ways to enable Application Performance Monitoring (APM) in your cluster:
1. Enable APM via Dashboard
Section titled “1. Enable APM via Dashboard”- After installing the agent, go to Settings → Agents, open the cluster’s actions menu (⋮), and select Configure to open its APM tab.
- The agent lists the workloads it discovered, grouped by namespace, with each workload’s detected language. Use the namespace filter or the search box to find one in a large cluster.
- For each workload, choose Off, eBPF, or SDK, then apply. eBPF starts tracing on the next check-in with no restart; SDK rolls that workload’s pods. Workloads with no SDK injector — Go, Ruby, or an unrecognized runtime — offer Off or eBPF only.
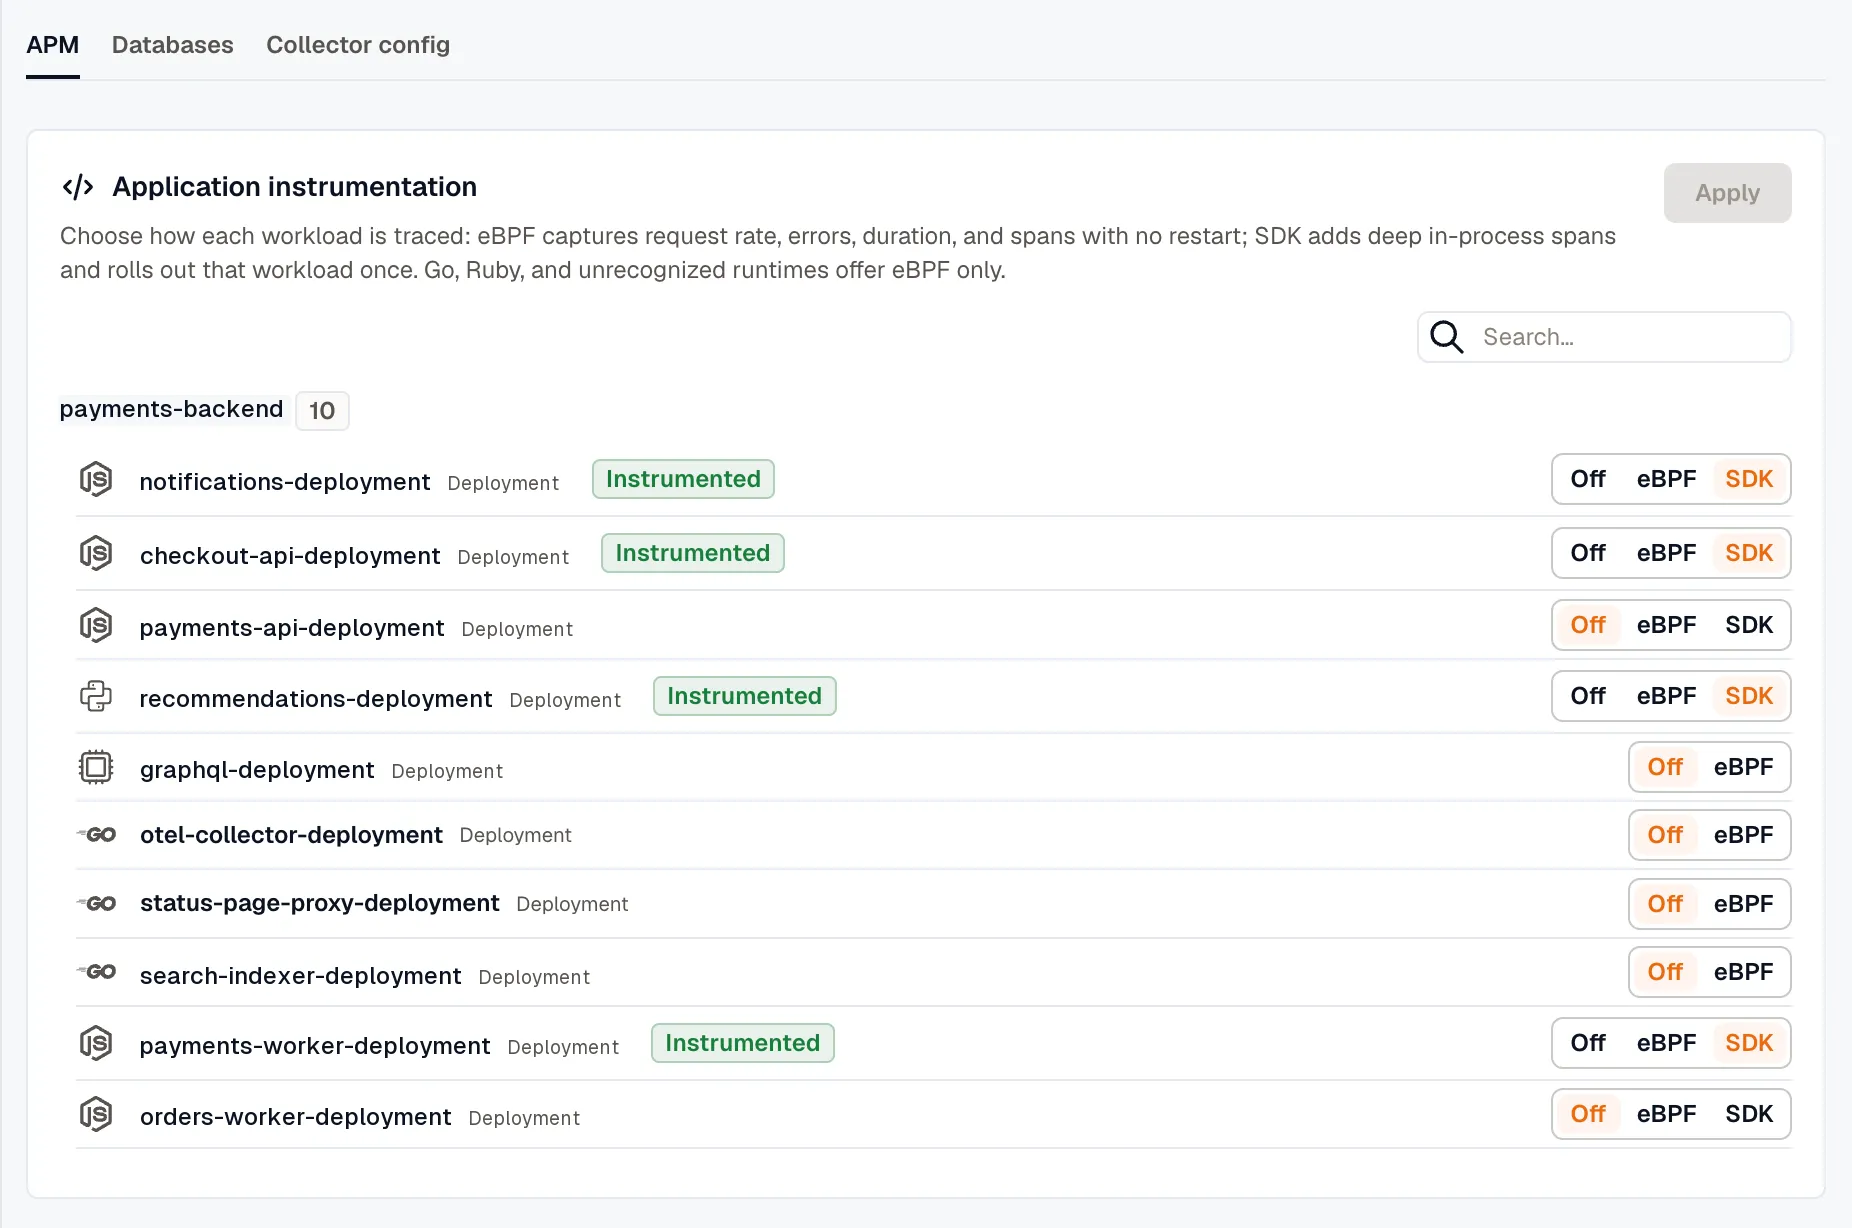
- After you turn a workload on, wait a few minutes for its traces to start, then verify them on the dashboard.
2. Enable SDK tracing via the Patch Method
Section titled “2. Enable SDK tracing via the Patch Method”Sometimes the agent doesn’t detect certain applications. When that happens, use deployment annotations to turn on SDK tracing for them. (This is the SDK path only; eBPF tracing is driven by the DaemonSet and has no annotation.)
Steps:
1. Identify each application that requires APM.
2. You can enable APM with either of these methods:
- Option 1 – Patch command
- Option 2 – Add annotation
Python:
Section titled “Python:”- Option 1 – Patch command
- Option 2 – Add annotation
Node.js:
Section titled “Node.js:”- Option 1 – Patch command
- Option 2 – Add annotation
- Option 1 – Patch command
- Option 2 – Add annotation
3. Restart the deployments after adding the annotations.
Configuration and next checks
Section titled “Configuration and next checks”On Kubernetes, one agent represents one cluster. A fleet-manager pod applies the configuration, and the DaemonSet and Deployment collector pods do the collecting. The Helm chart installs the cluster role-based access control (RBAC) the agent needs. See Kubernetes platform notes.
- Node, pod, and cluster telemetry starts flowing automatically. See Host metrics and logs.
- Where nodes run a supported kernel, eBPF monitoring turns on per node.
- Use the cluster’s APM tab to instrument workloads for APM, or enable auto-instrumentation as shown above. See Application APM on Kubernetes.
- To monitor in-cluster databases, provide credentials through a Kubernetes Secret referenced by the
dbMonitoring.secretNameHelm value. See Database monitoring on Kubernetes.
Next Steps
Section titled “Next Steps”- Open Kubernetes to view metrics and events for your cluster, nodes, namespaces, pods, and workloads
- Use Dashboards to create visualizations or view pre-built dashboards
- Use Logs to investigate logs and correlate them with metrics
- Configure alerts for any of these components based on thresholds