

AWS Lambda Monitoring
Open Serverless → Lambda to monitor Lambda functions connected through your AWS integration.
KloudMate collects and aggregates Lambda metrics such as:
- Invocations
- Errors
- Duration
- Cold starts
- Memory usage
Lambda Console Walkthrough
Section titled “Lambda Console Walkthrough”The Lambda tab lists the Lambda functions in the selected AWS account. Search by name to find a specific function.
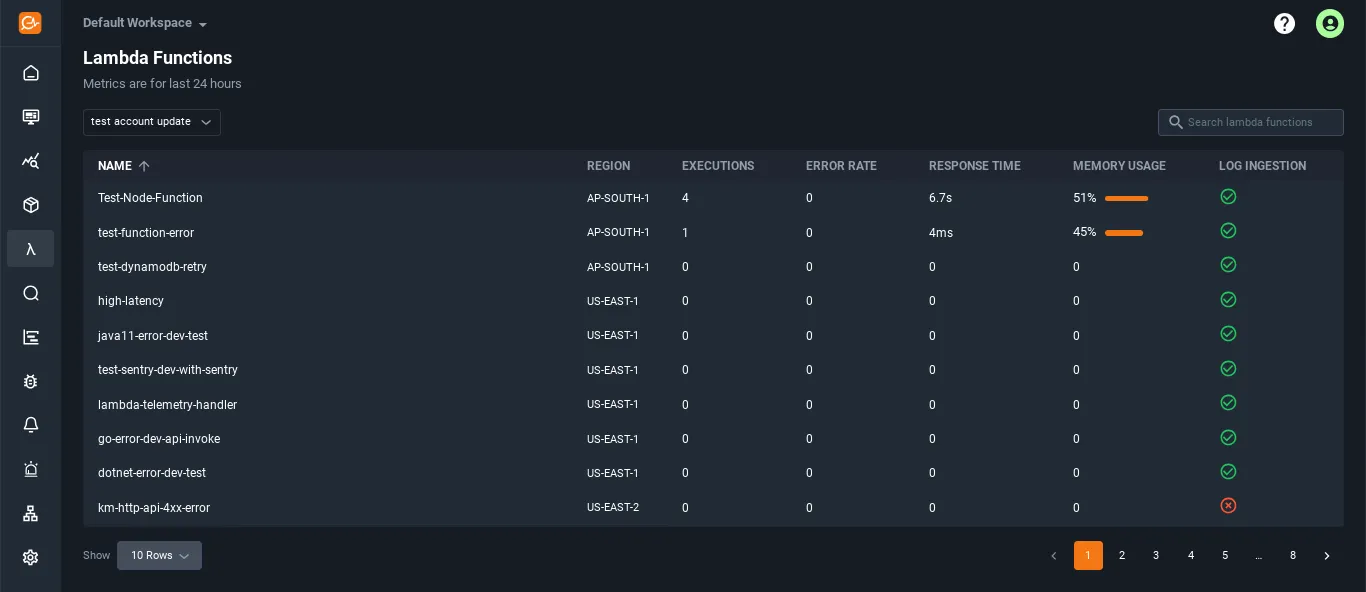
Each row in the list shows basic information such as the function name, region, executions, error rate, response time, memory usage, and log ingestion.
You can sort the list in ascending or descending order by clicking the arrow next to the column headers.

Invocations and Errors
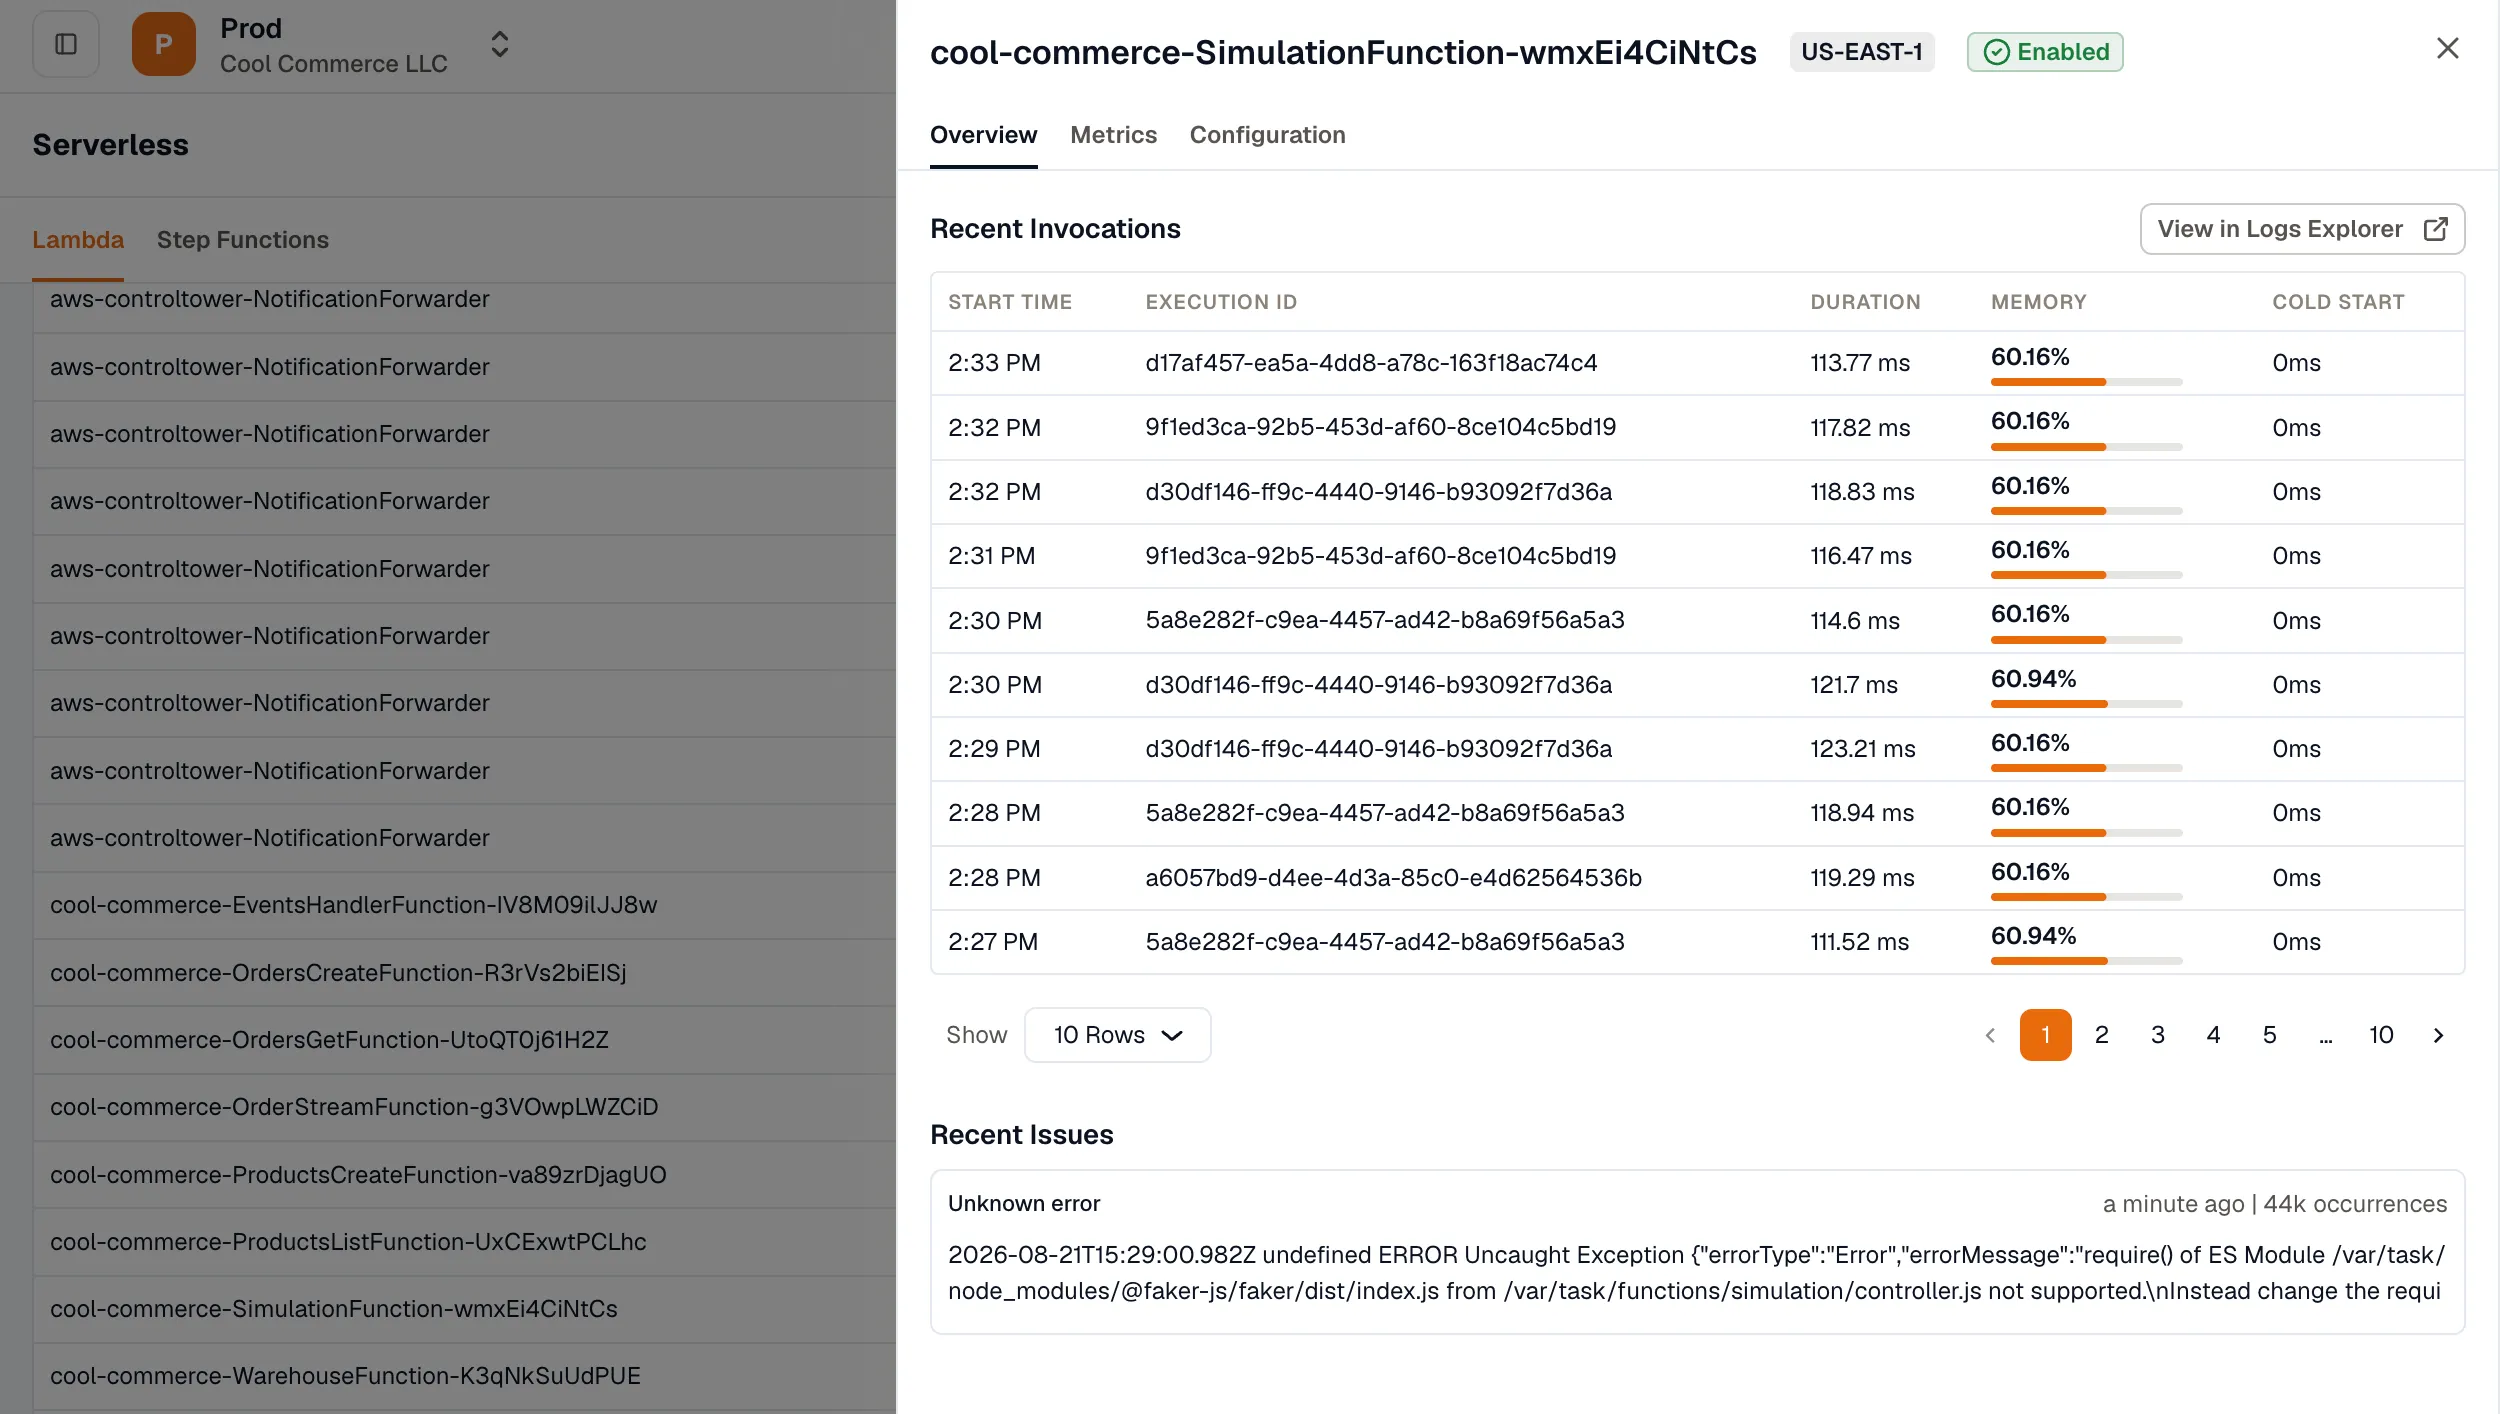
Section titled “Invocations and Errors”You can view additional details of any Lambda function by clicking on it in the list. The Overview tab includes Recent Invocations and Recent Issues for the selected function.
Visualizing Metrics
Section titled “Visualizing Metrics”The Metrics tab provides charts for the default Lambda metrics associated with the selected function.
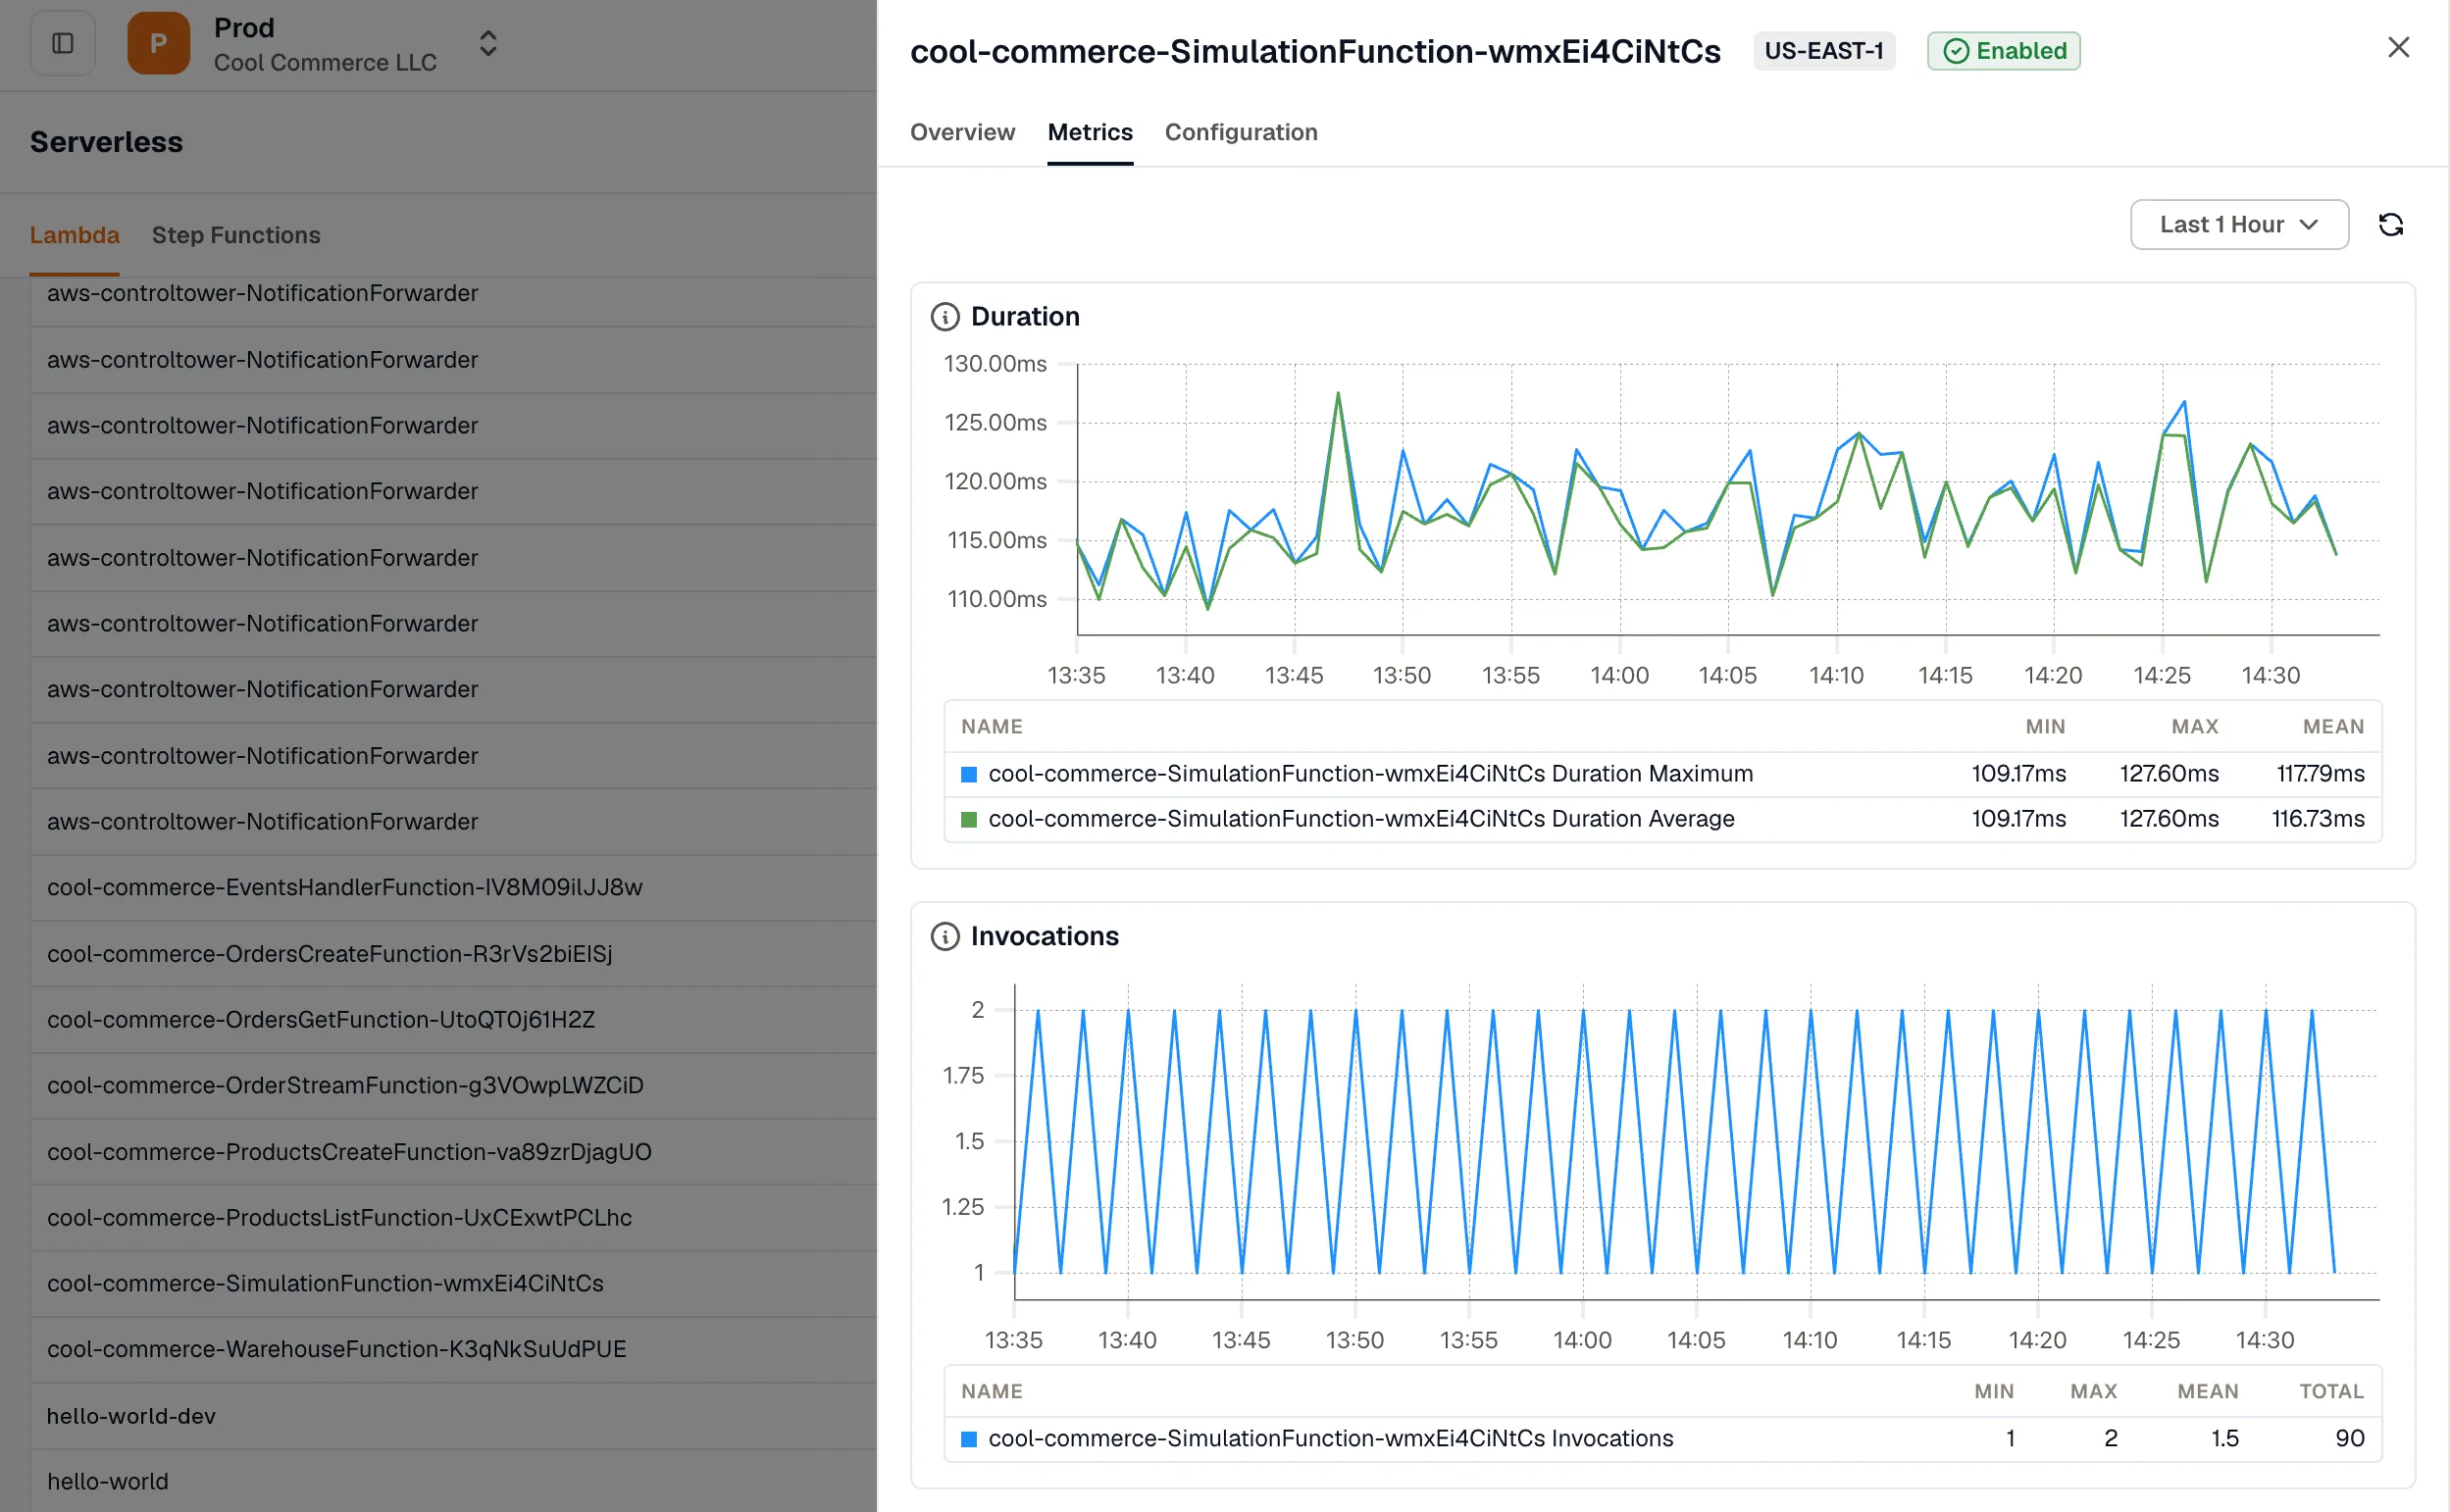
You can also adjust the time range from the time scale menu to inspect recent or historical behavior.