

Query performance
The Top queries and Query patterns tabs rank the statements your database runs by the time they cost. The queries at the top of the list are usually the ones worth tuning first. Open a query from Query patterns to read its execution plan and per-query metrics.
These tabs are available for PostgreSQL, MySQL, MariaDB, SQL Server, Oracle, and MongoDB. They need the Query performance (samples + top queries) coverage turned on for the instance in the agent’s database monitoring settings. See Engines and coverages.
Queries are grouped by their normalized form, with literal values replaced, so every execution of SELECT * FROM orders WHERE id = ? counts as one query no matter which ID it used.
Top queries
Section titled “Top queries”Top queries lists the queries that ran in the selected time range, sorted by total duration. Expand a row to read the full query text.
The columns depend on what the engine reports:
- Database shows the database the query ran in. MySQL doesn’t report it.
- Avg rows shows the rows returned or affected per execution, on PostgreSQL, SQL Server, and Oracle.
- Shared blocks hit ratio shows how many of the blocks a query read came from shared memory, on PostgreSQL.
Query patterns
Section titled “Query patterns”Query patterns adds a trend and a plan status to each query, and lets you filter for the queries that most likely need attention.
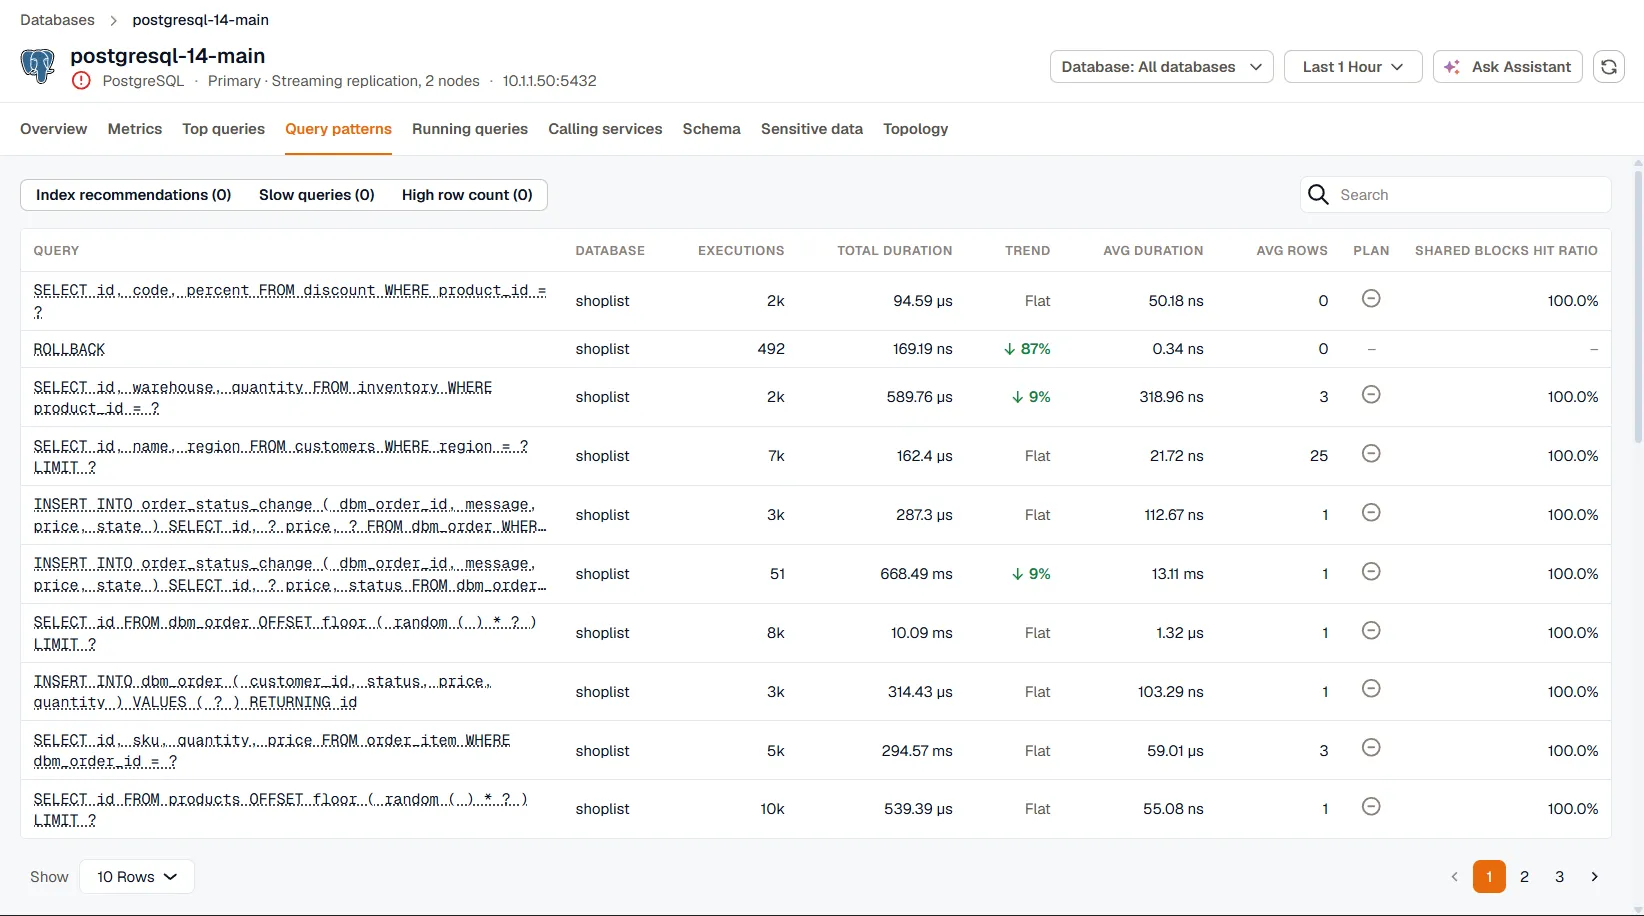
The Trend column compares the query’s total duration with the previous period of the same length. A change under 5% shows as Flat. An increase is marked in red and a decrease in green. Queries that didn’t run in the previous period have no trend.
The Plan column shows whether an execution plan was captured for the query in the time range. Plans are only kept when Collect execution plans is on for the instance, and they’re only checked for the 20 queries that took the most time.
Use the filters above the table to narrow the list:
- Index recommendations shows queries whose plan has a sequential scan over an estimated 10,000 rows or more, a common sign of a missing index. Only the plans of the 20 most time-consuming queries are checked.
- Slow queries shows queries that averaged one second or more per execution.
- High row count shows queries that returned or affected 10,000 rows or more per execution.
Below the table, Query Volume and Total Duration by Query chart the ten busiest queries over the range, and Load by calling service shows which services generated the load.
Query details
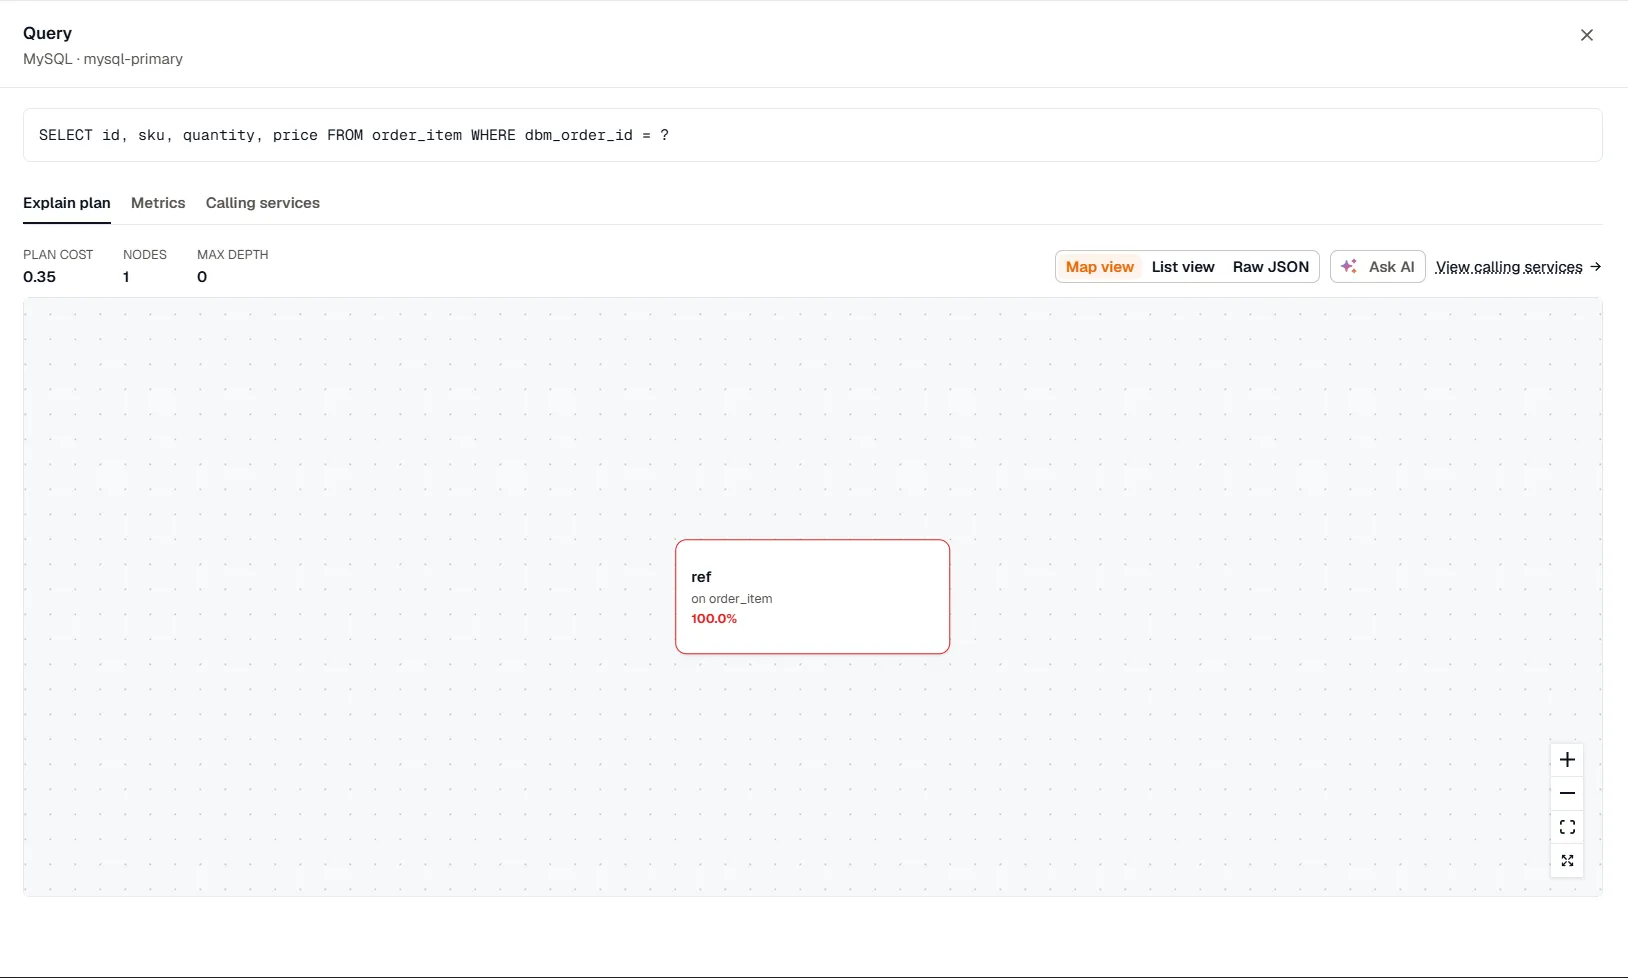
Section titled “Query details”Click a query in Query patterns to open its details in a side panel over the list. The panel shows the full query text and tabs for Explain plan, Metrics, and Calling services. To share a query with a teammate, copy the page URL while the panel is open.
Explain plan
Section titled “Explain plan”Execution plans are available for PostgreSQL, MySQL, MariaDB, SQL Server, and Oracle, when Collect execution plans is on for the instance. A new query can take a few collection intervals to get its first plan.
The tab shows the plan’s total cost, number of nodes, and depth, with three views of the plan:
- Map view draws the plan as a tree of operations. Click a node to see its costs, rows, row width, relation, filter, and join details.
- List view lists each operation with its share of the total cost.
- Raw JSON shows the plan exactly as the database returned it.
When the plan has a sequential scan over an estimated 10,000 rows or more, a warning suggests indexing the filtered or joined column.
If the query ran under more than one plan in the time range, Plan history lists each plan with the time it was first seen and how often it was captured. Select an older plan to compare it with the current one. A plan that changed is a common cause of a query that suddenly got slower.
Click Ask AI to ask the KloudMate Assistant about the plan.
Metrics
Section titled “Metrics”The Metrics tab charts the query on its own: executions, average and total duration, and rows per execution, plus the engine-specific panels the database reports. For example:
- PostgreSQL shows blocks accessed, buffer cache hit ratio, planning time, and temporary blocks written per execution.
- SQL Server shows logical reads, CPU versus wait time, and memory grants per execution.
- Oracle shows logical reads, CPU versus wait time, and wait time by class.
- MongoDB shows documents examined versus returned.
When session samples are collected, the tab also shows Active Sessions by Client and Sessions by Wait Type for sessions running the query.
Calling services
Section titled “Calling services”The Calling services tab lists the services that ran this query, from your traces. See Match a query to its traces.