

Service Map
The Service Map is a visual representation of the relationships and interdependencies between services in your workspace. It is built from your services’ distributed traces and gives you a topology-level view of your architecture.
You can use it to understand service dependencies, traffic flow, and operational health at a glance.
How the map is built
Section titled “How the map is built”The map is built from distributed traces, so both sources of tracing feed it:
- eBPF monitoring captures traces at the kernel level with no code change, so an eBPF-covered service appears on the map on its own — on VMs, hosts, and containers. (On Kubernetes, eBPF provides the network topology instead, and traces come from the SDK.)
- Auto-instrumentation and the OpenTelemetry SDK produce traces from inside the application.
Each service becomes a node under its service.name, and an edge is drawn wherever one service’s trace calls another. A service needs a distinct service.name to appear as its own node — the agent gives an eBPF-monitored service the same name it carries once auto-instrumented, so it keeps one identity whether eBPF or the SDK is tracing it.
Overview
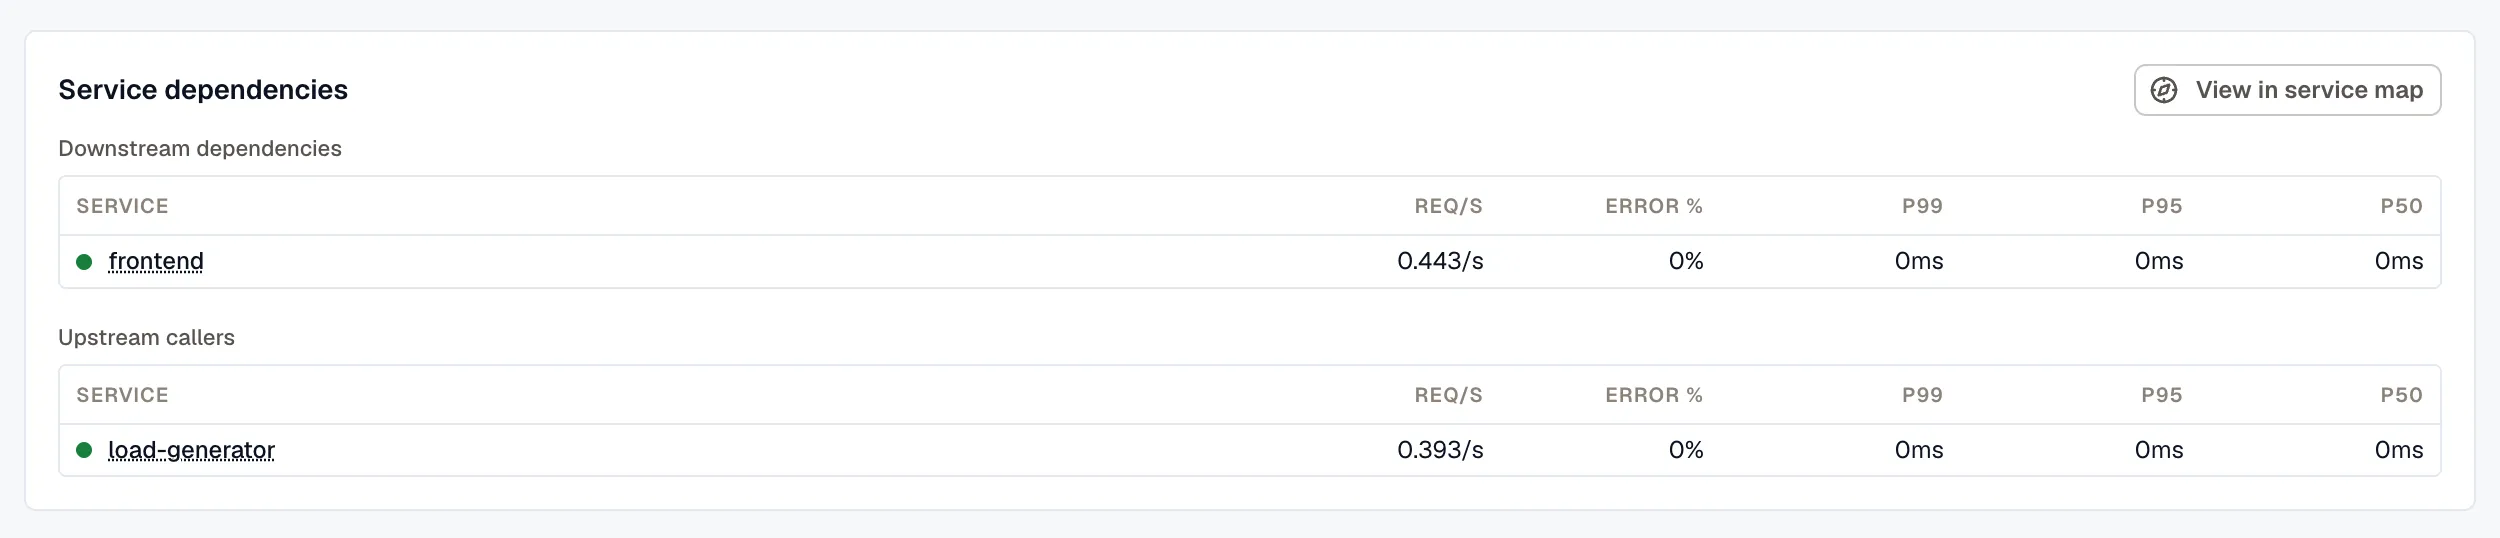
Section titled “Overview”Open APM & Services and select the Service map view. You can also open the map from a service’s page: click View in service map in the Service dependencies panel.
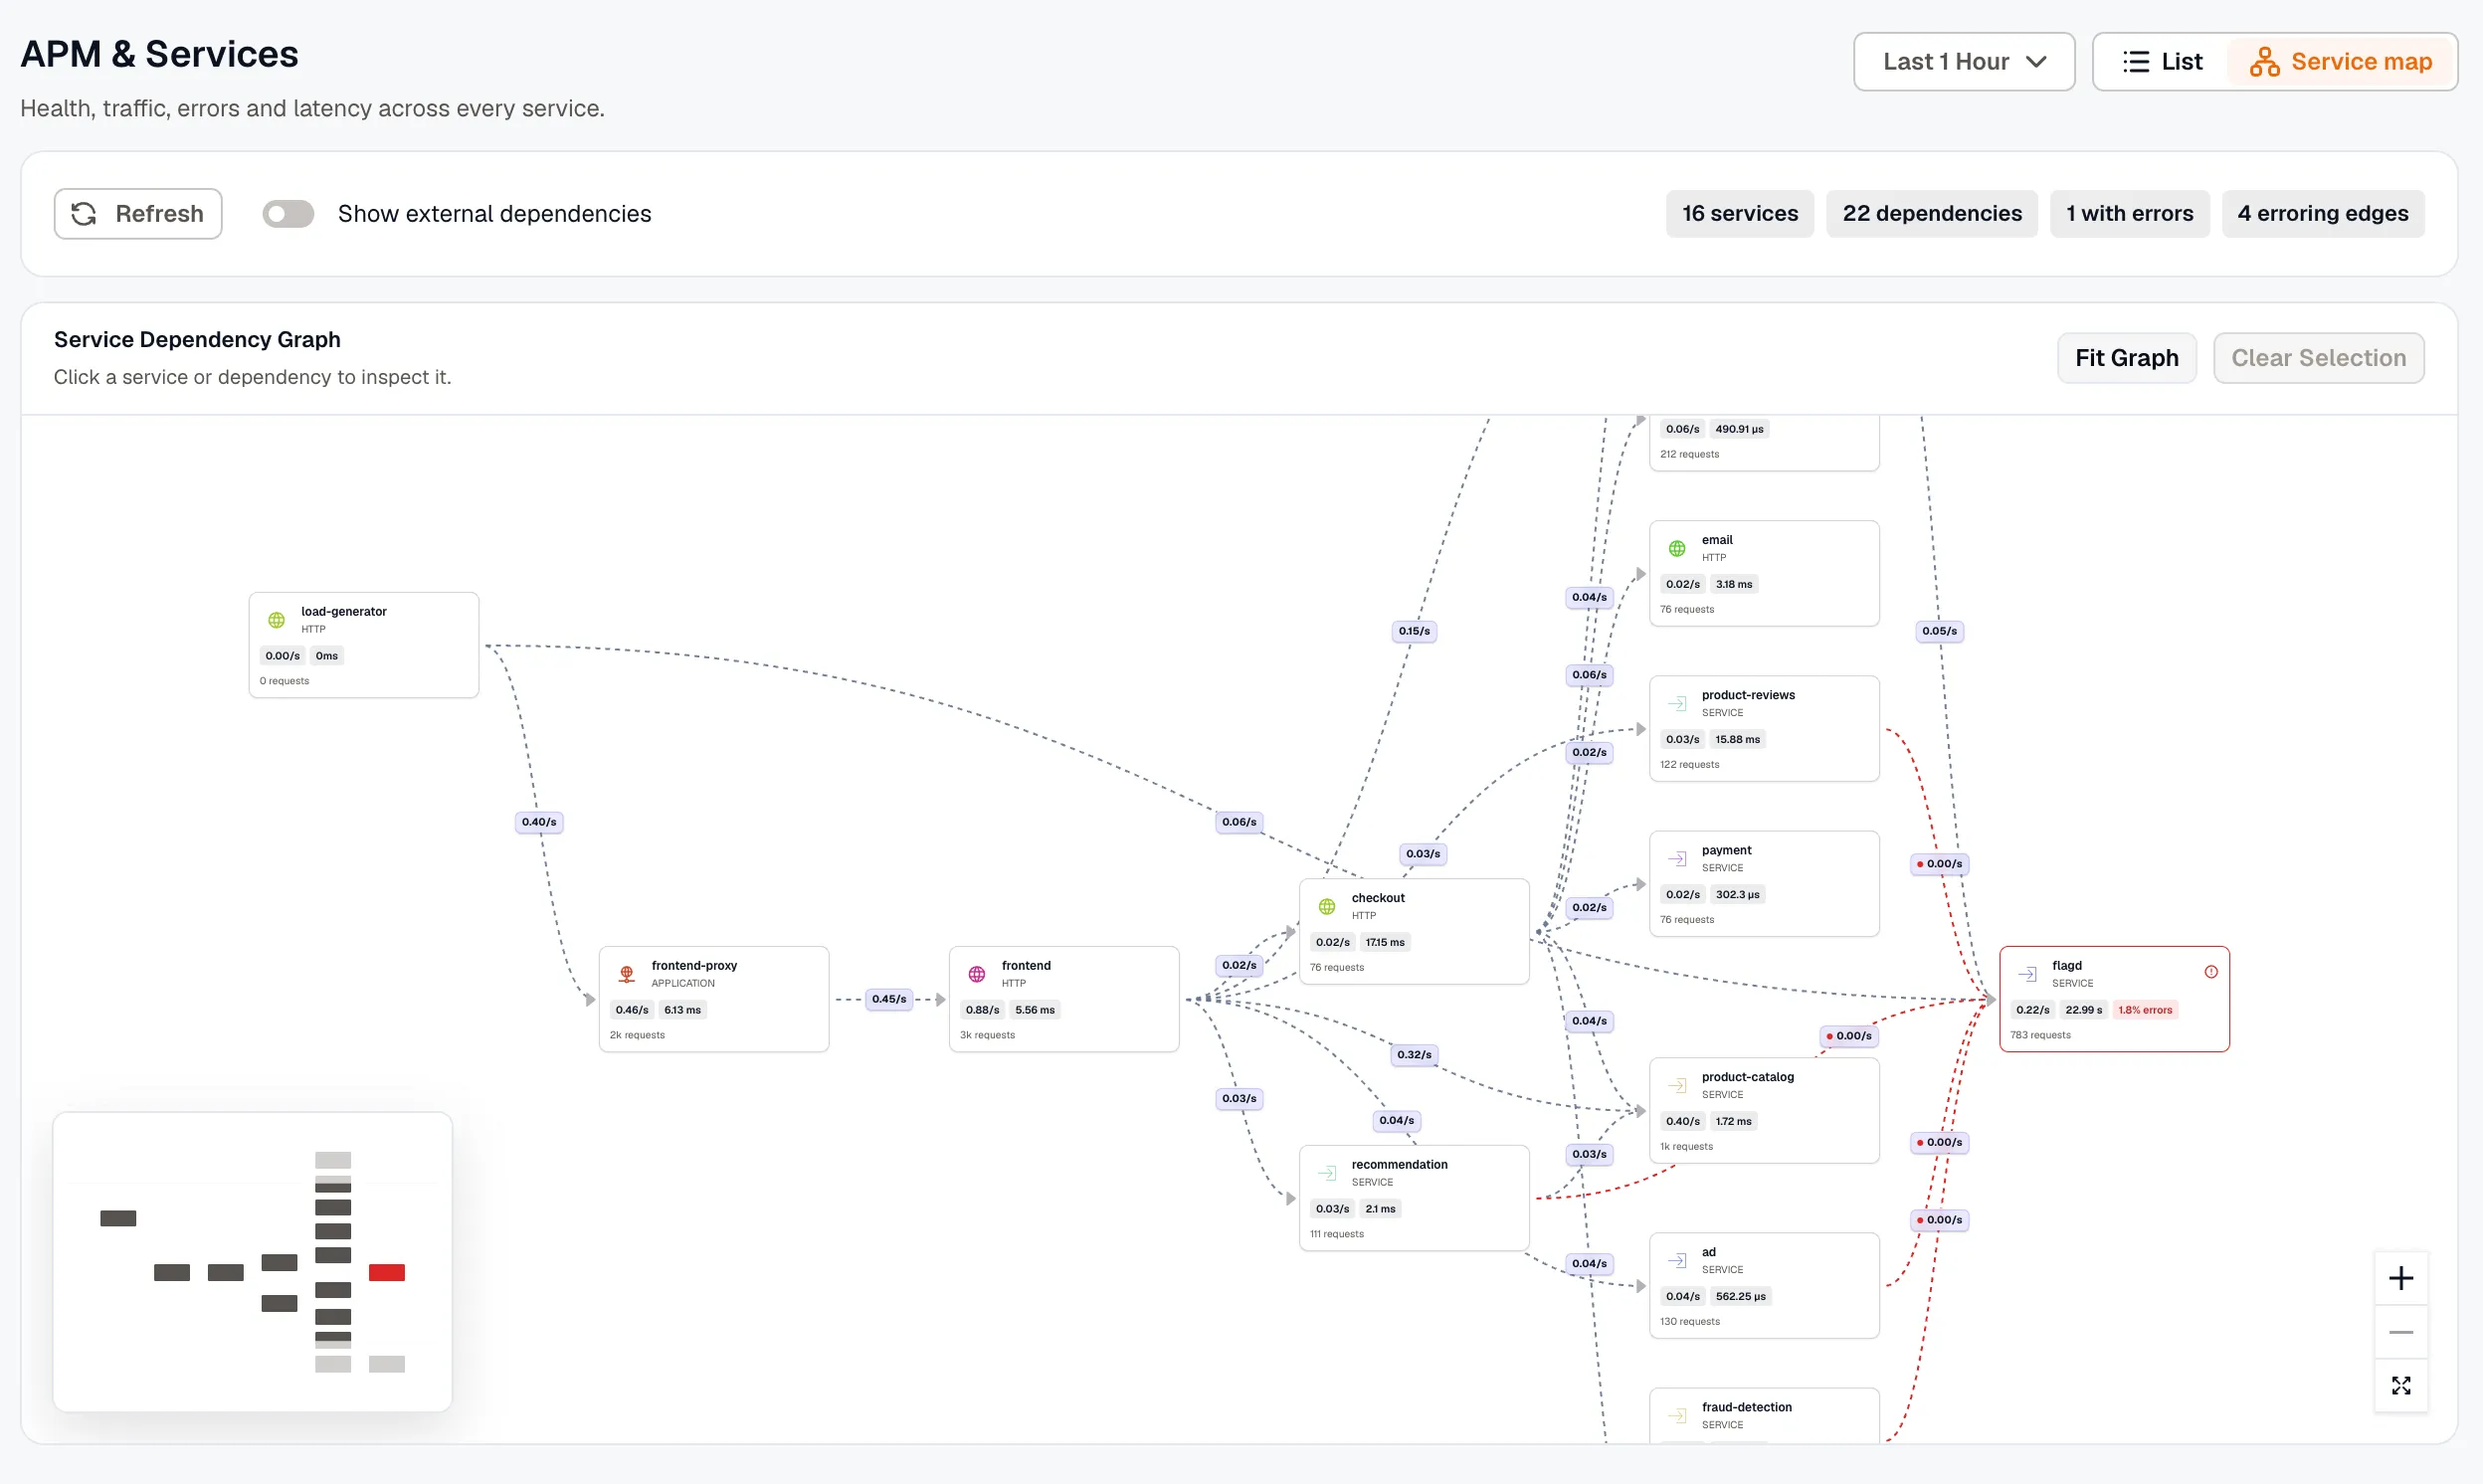
Summary chips count the services, external dependencies, dependencies, services with errors, and erroring edges in the selected time range. A service or dependency counts as erroring when its error rate is 0.05% or higher.
The Service map view uses the same time range as the List view. Click Refresh to reload the map with the latest data, and turn on Show external dependencies to add the uninstrumented dependencies your services call, such as databases, queues, and third-party hosts.
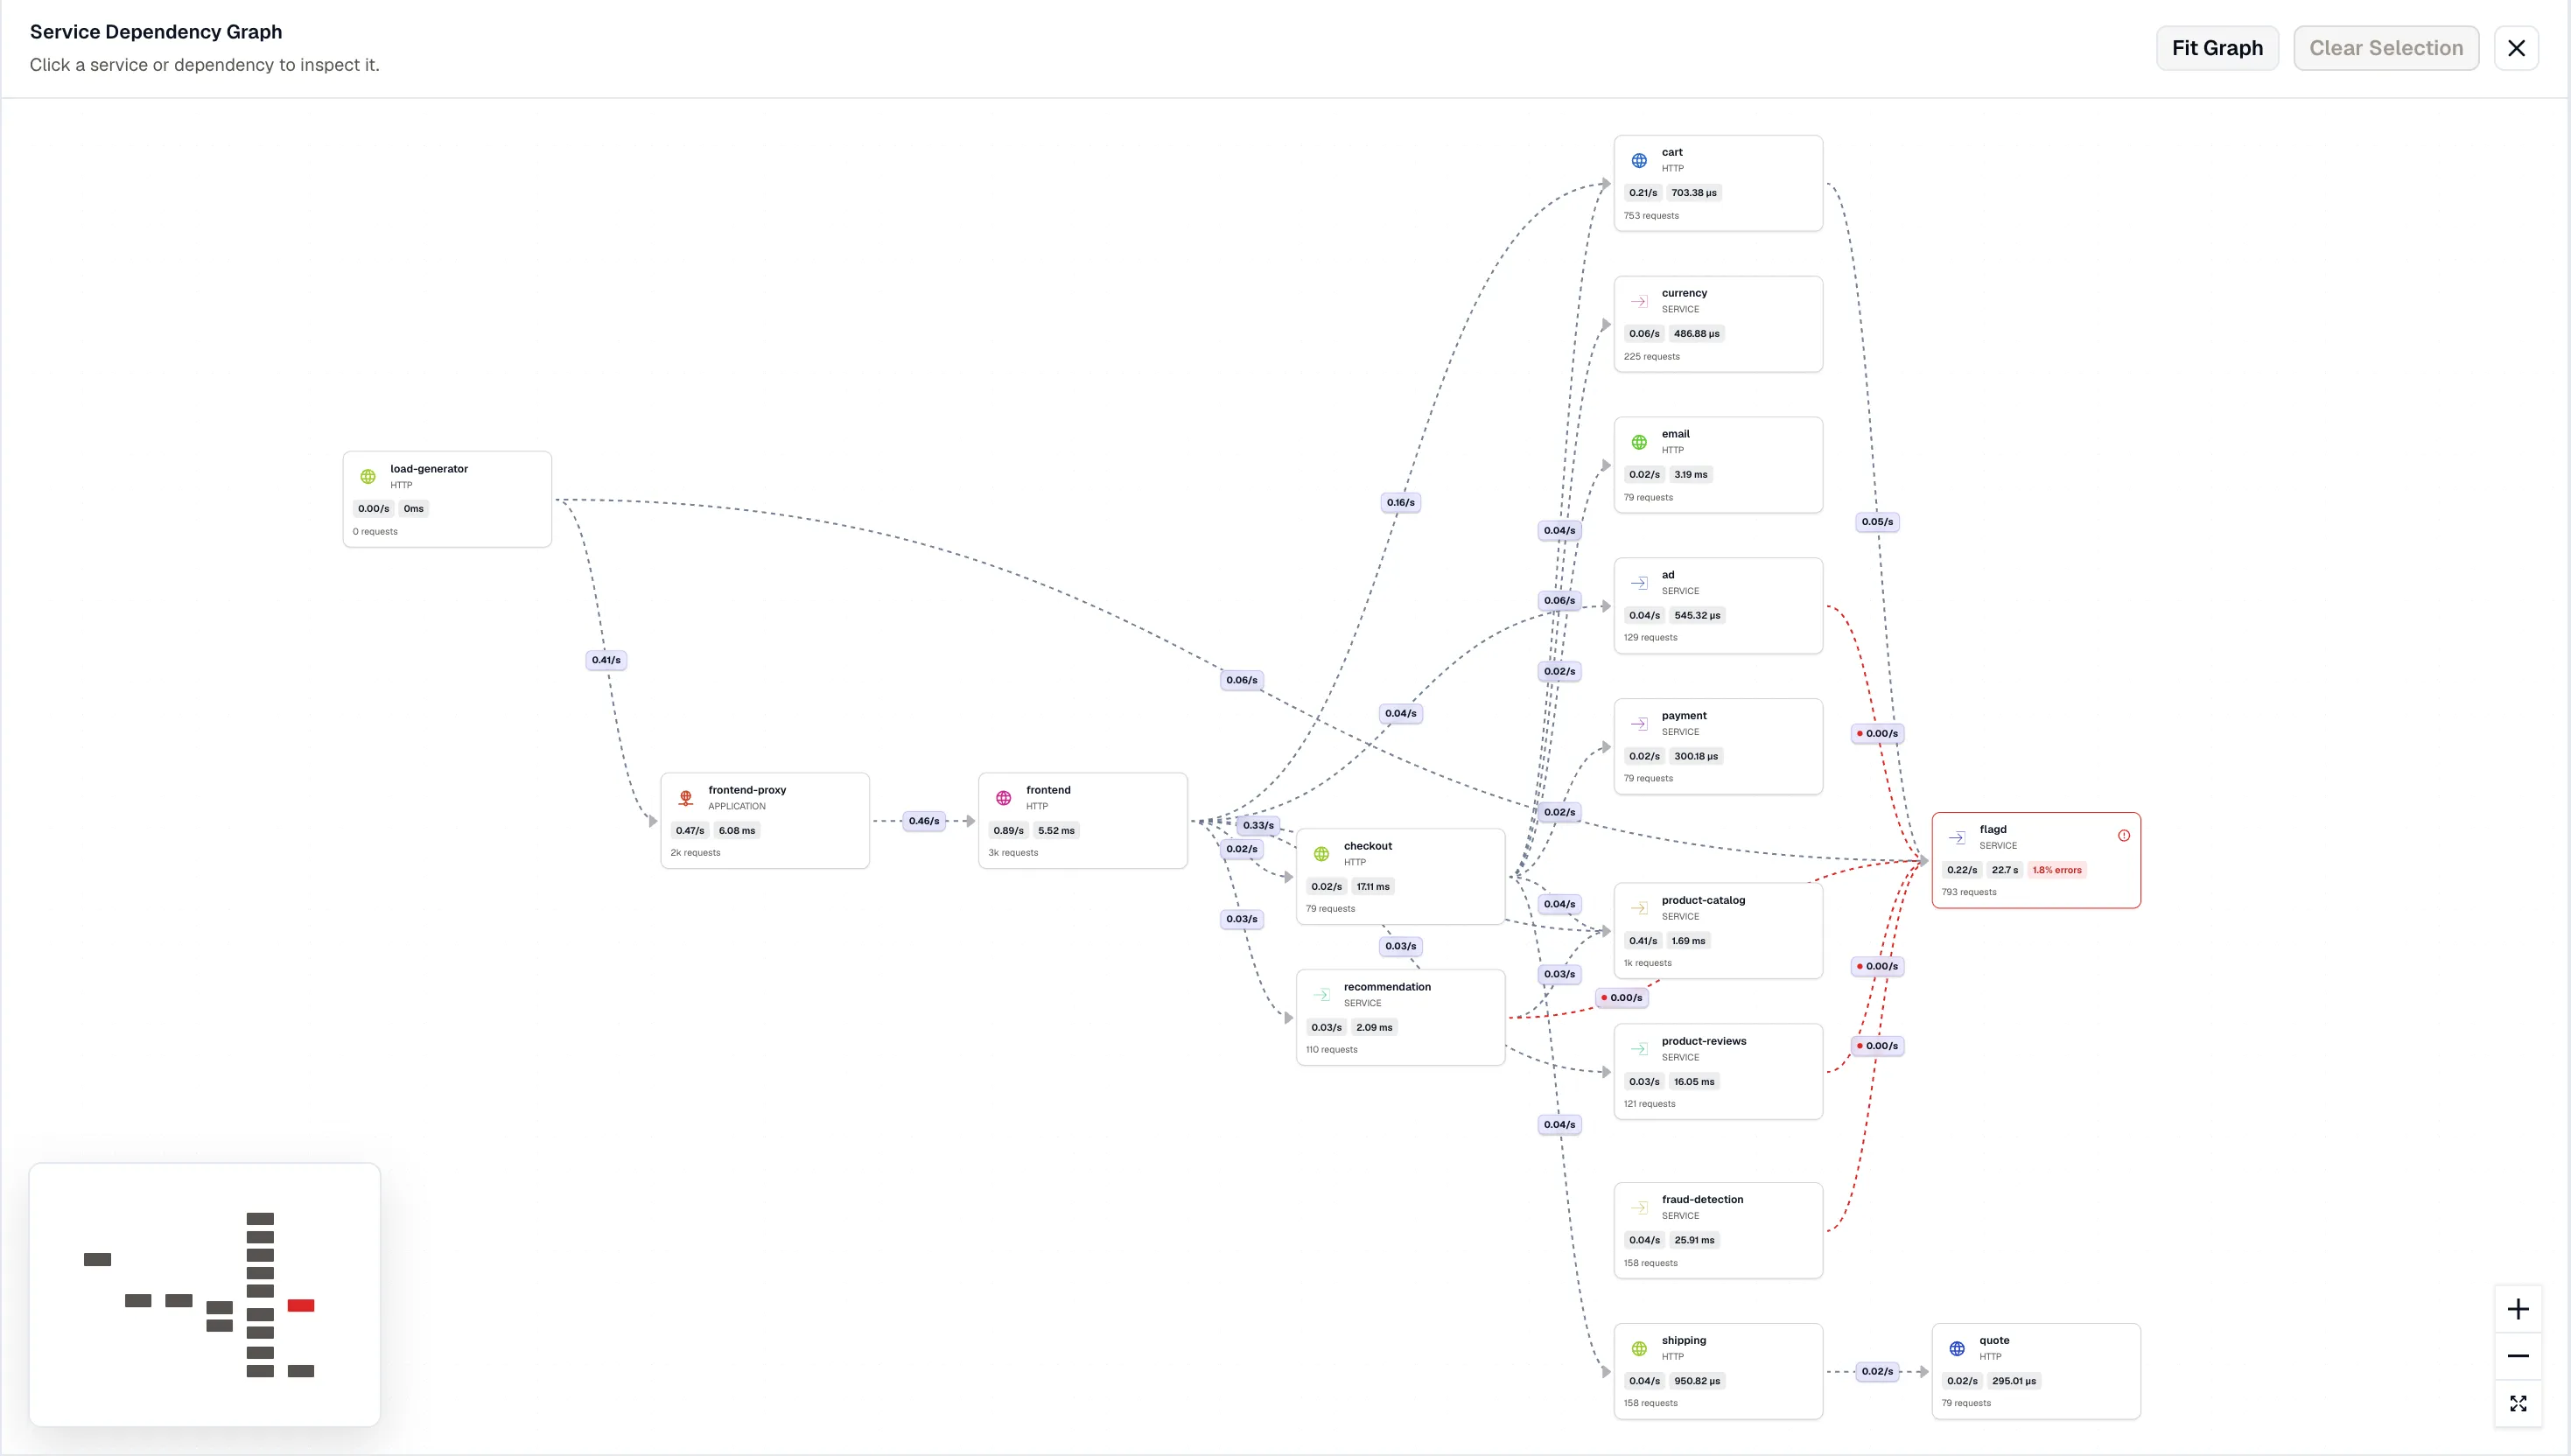
The main area displays the Service Dependency Graph. Each service is represented as a node showing its name, protocol, request rate, and average latency. The directed edges between nodes represent the call flow and dependencies between services.
Use the zoom controls on the bottom-right to zoom in and out, or click the expand icon to view the graph in full screen.
Inspecting a Service
Section titled “Inspecting a Service”Click any service node on the graph to open the service details panel on the right.
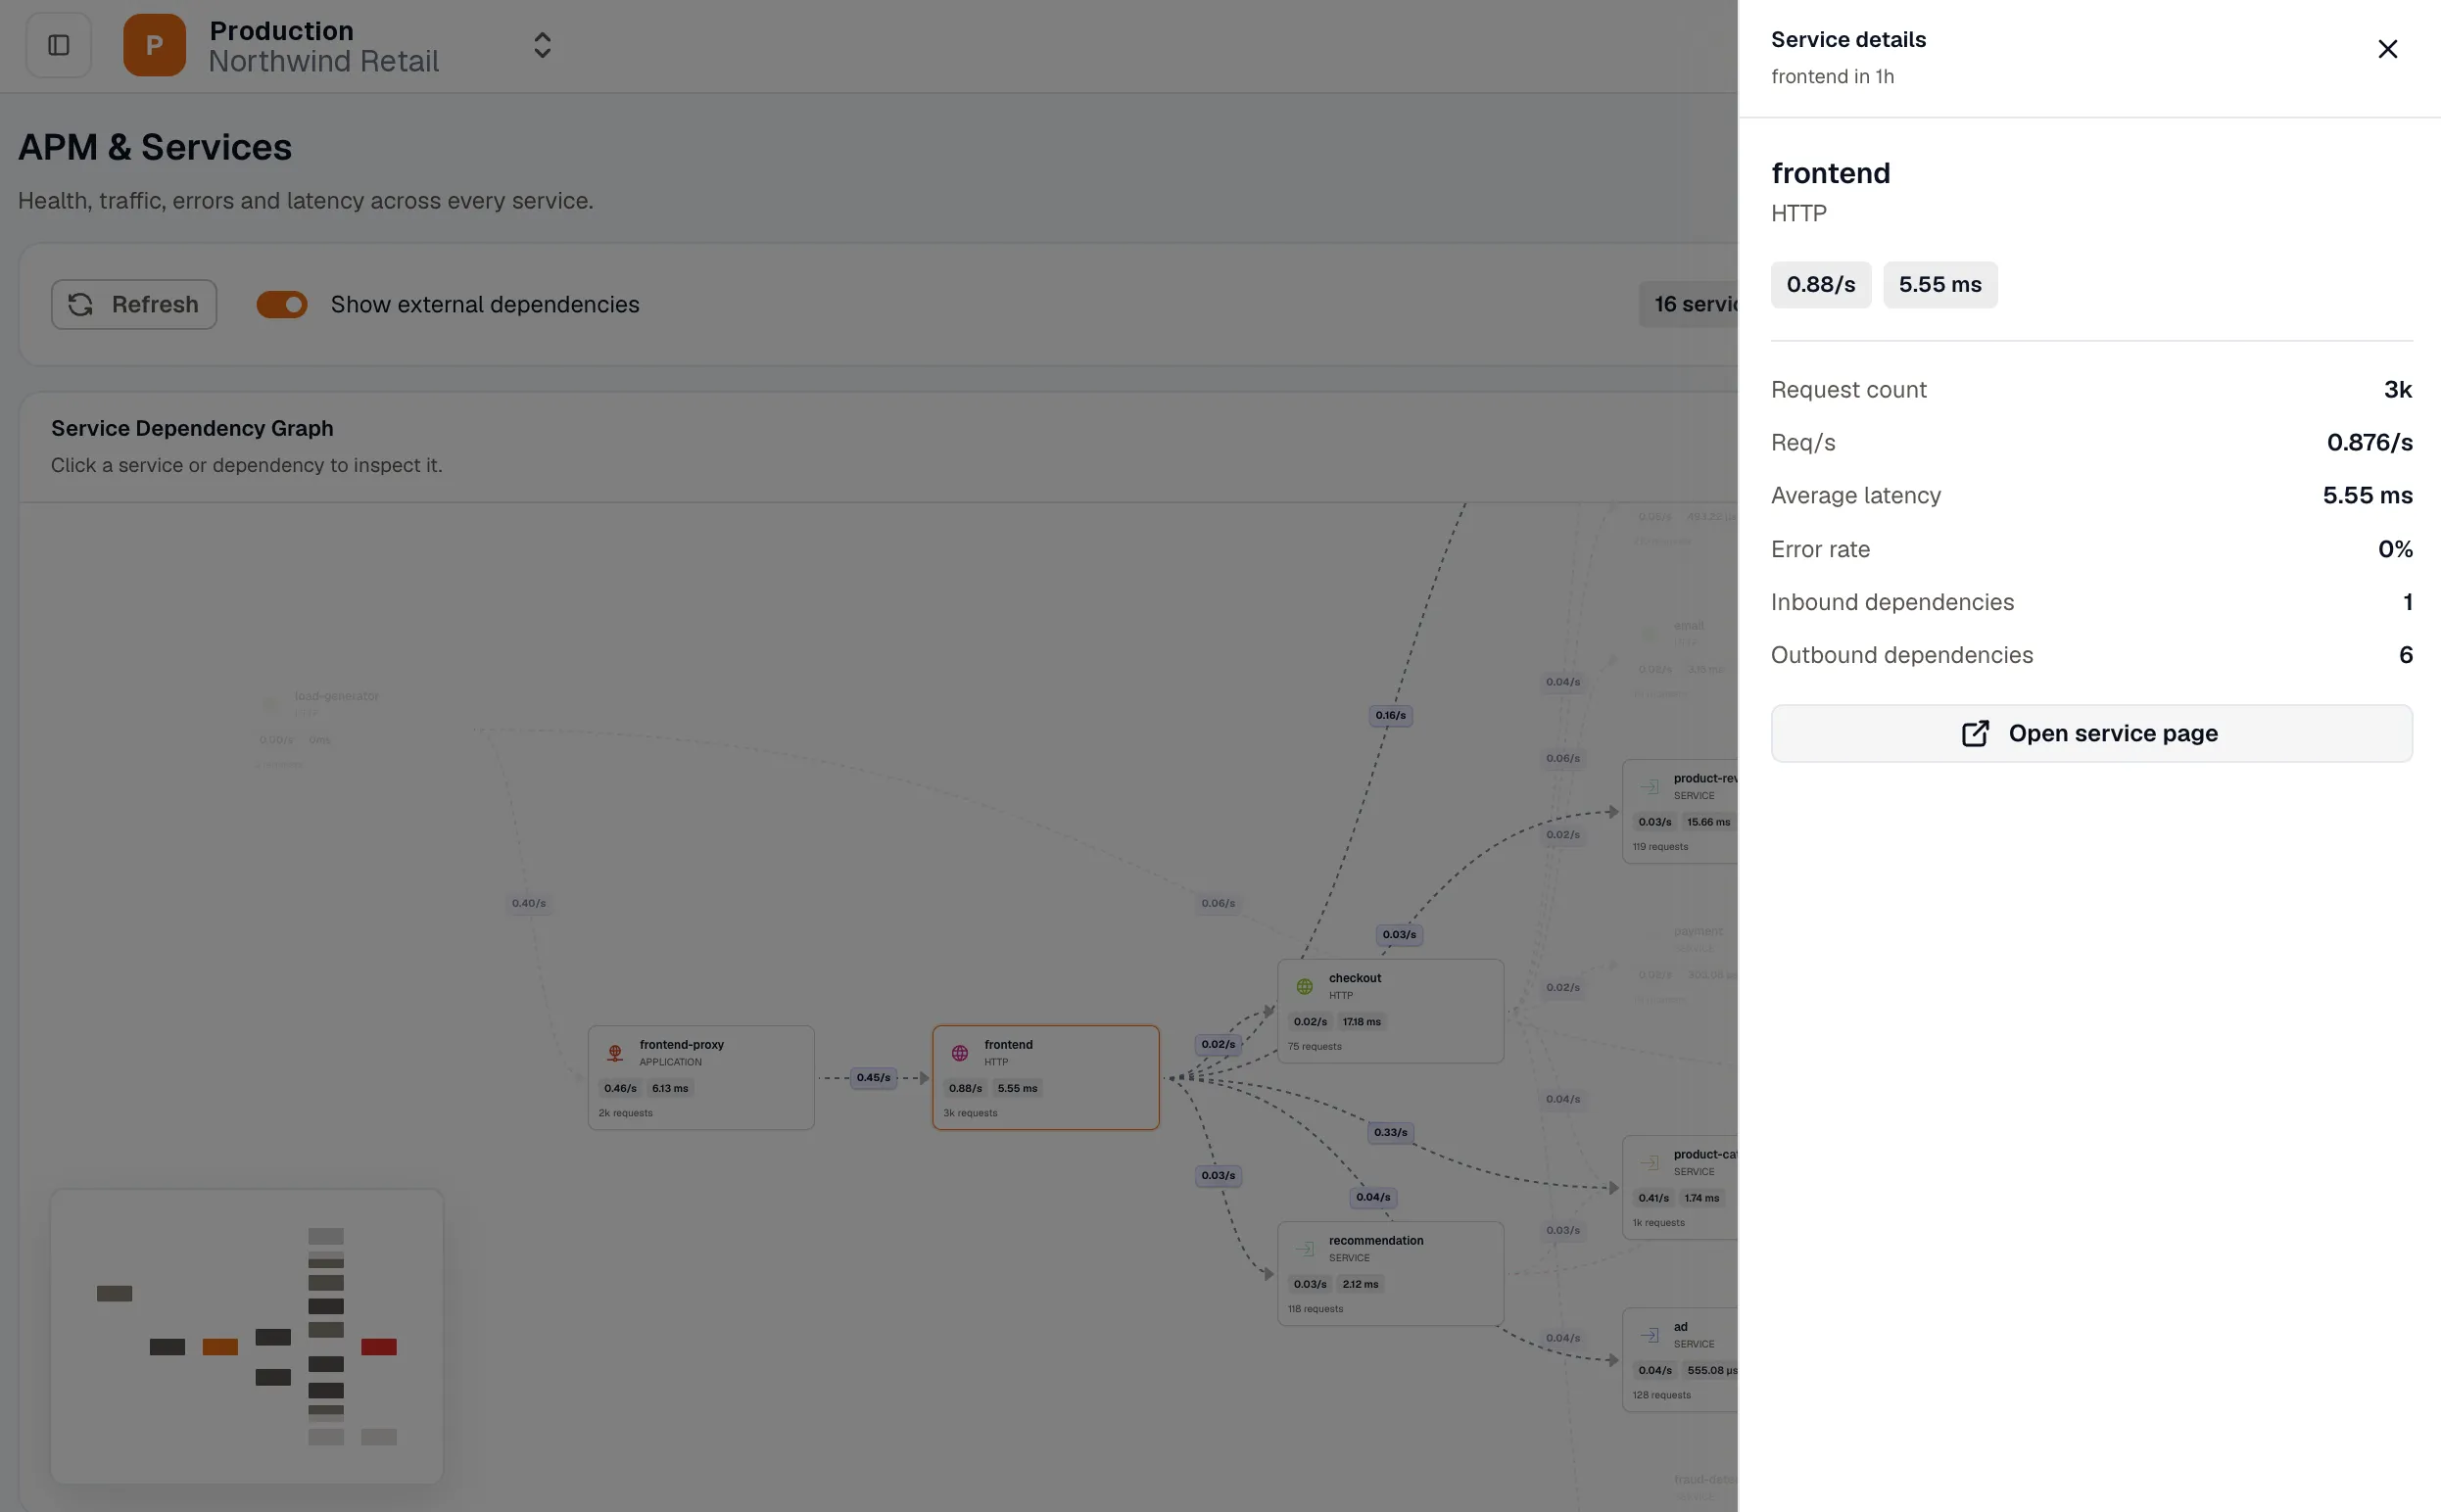
Click Open service page at the bottom of the panel to navigate to that service’s APM dashboard, where you can inspect request trends, latency percentiles, traces, issues, alerts, and dashboards in more detail.
Inspecting a Dependency
Section titled “Inspecting a Dependency”Click any edge between two service nodes to open the dependency details panel on the right.
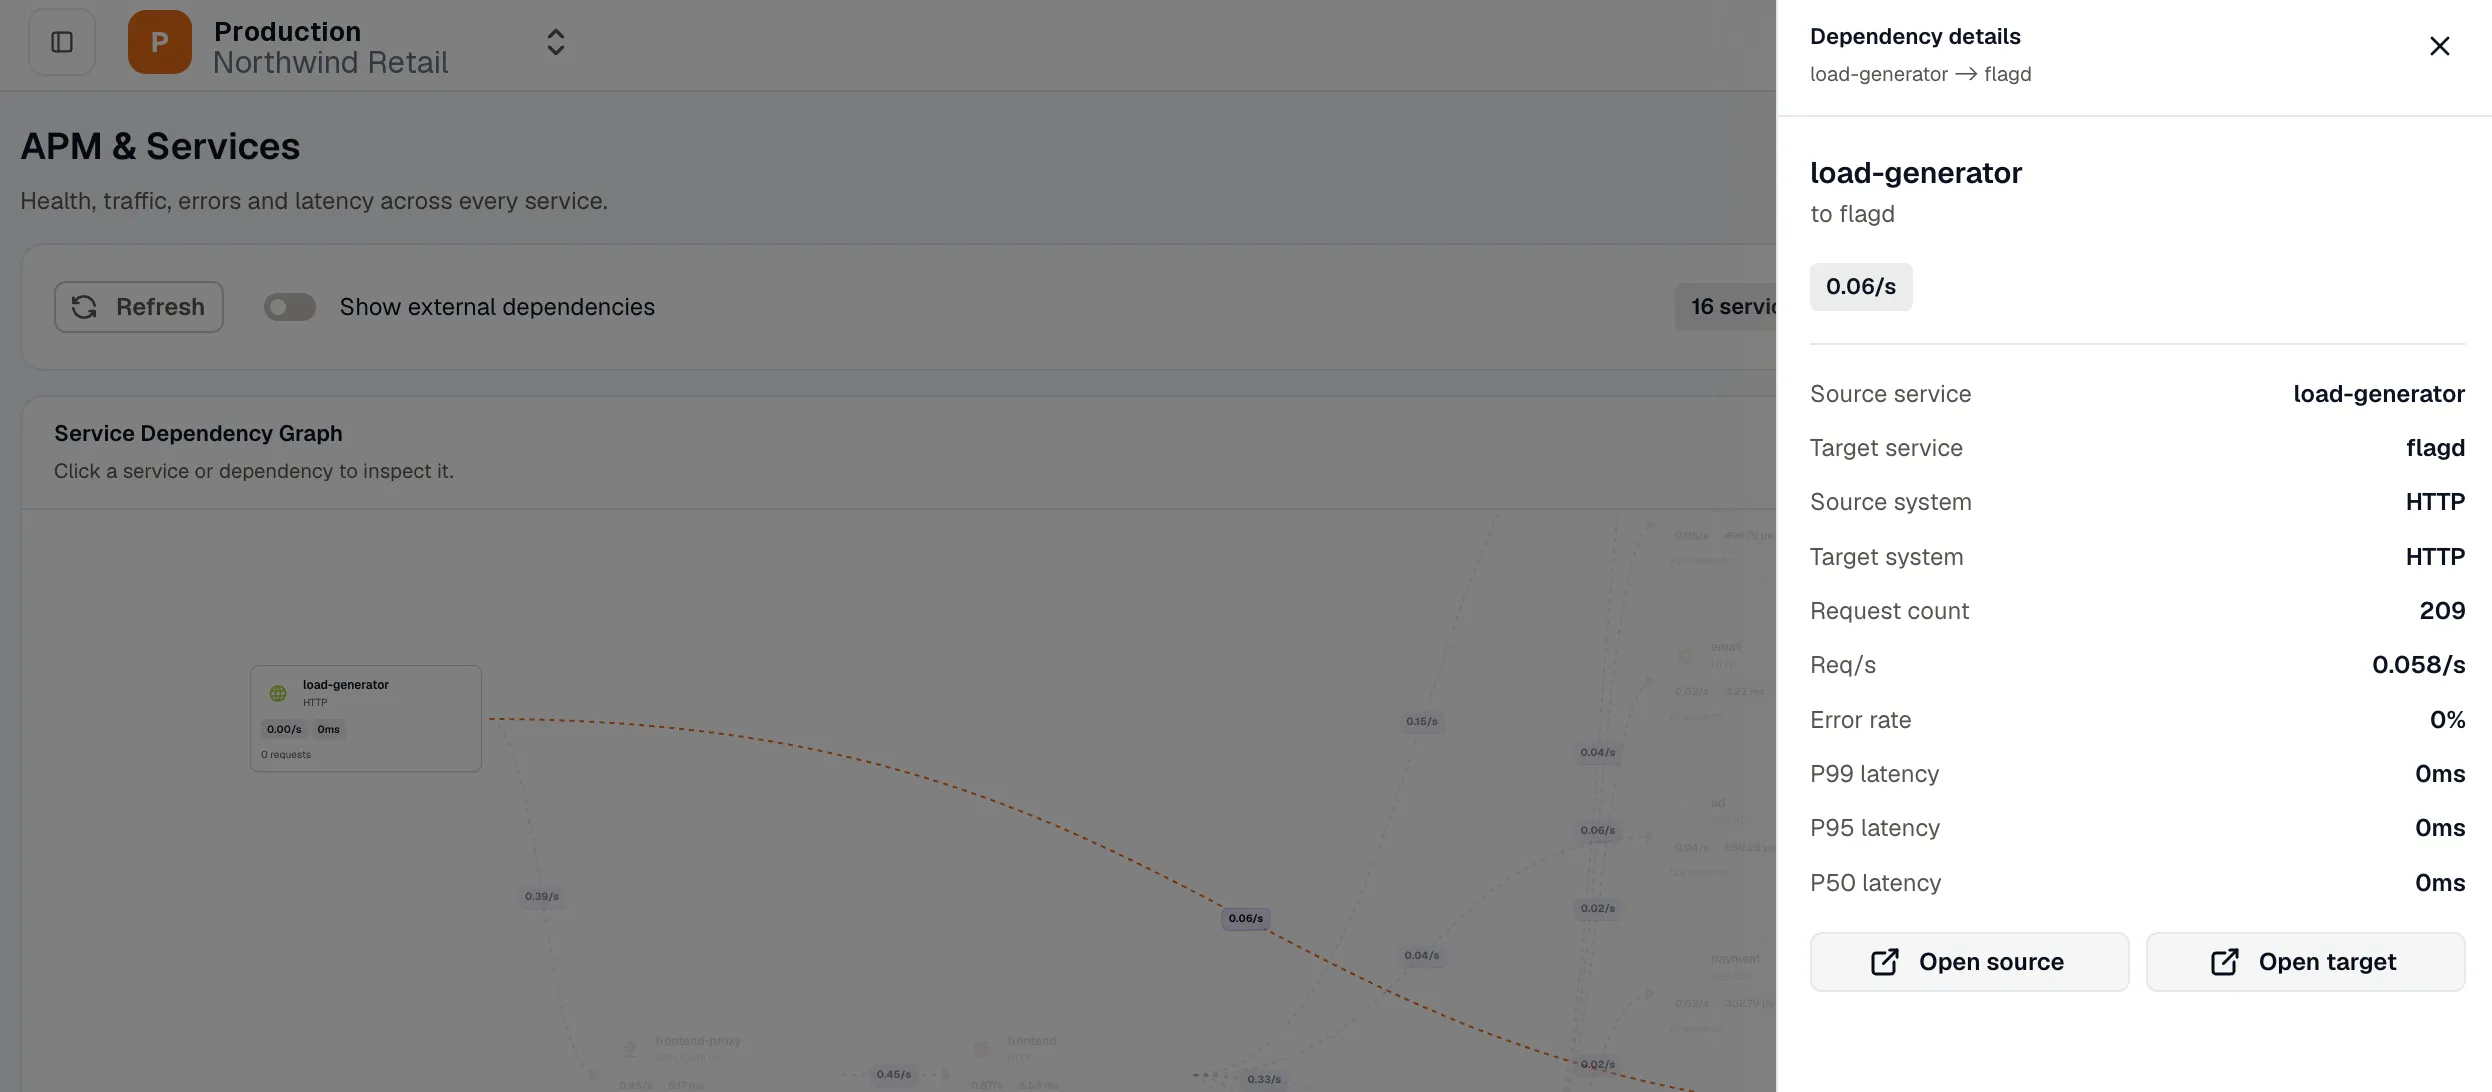
Use Open source or Open target to navigate directly to the APM dashboard of either service involved in the dependency.
Identifying Issues
Section titled “Identifying Issues”Nodes and edges with errors are highlighted in red, making it easy to spot problematic services and dependencies at a glance. Click a highlighted node or edge to review its error rate and latency details.