

Network Monitoring
Use Network Monitoring to watch the routers, switches, firewalls, access points, and PDUs that carry your traffic. You poll them over SNMP for health and interface metrics, check reachability for the sites that can’t speak SNMP, and read the application traffic mix from NetFlow or sFlow.
A Linux or Docker KloudMate Agent does the collecting. It polls devices over the network, so one agent can watch an entire site, and nothing gets installed on the devices themselves.
What you can monitor
Section titled “What you can monitor”- SNMP devices: interface throughput and errors, CPU, memory, uptime, and vendor-specific health. Built-in profiles cover Cisco, Juniper, Arista, HPE, Aruba, Dell, Fortinet, Palo Alto, MikroTik, F5, APC, and many more.
- Sites without SNMP: a gateway-and-internet ping pair that shows whether the local network is up and whether the ISP link is working.
- Traffic flow: the per-application byte and packet mix on a link, from NetFlow, IPFIX, or sFlow exporters.
- Routing and links: BGP peers, MPLS L3VPN VRFs, IP SLA probes, and LLDP/CDP topology, once you turn those capabilities on.
The Network Monitoring tabs
Section titled “The Network Monitoring tabs”Open Network Monitoring. You land on the Overview tab.
| Tab | What it shows |
|---|---|
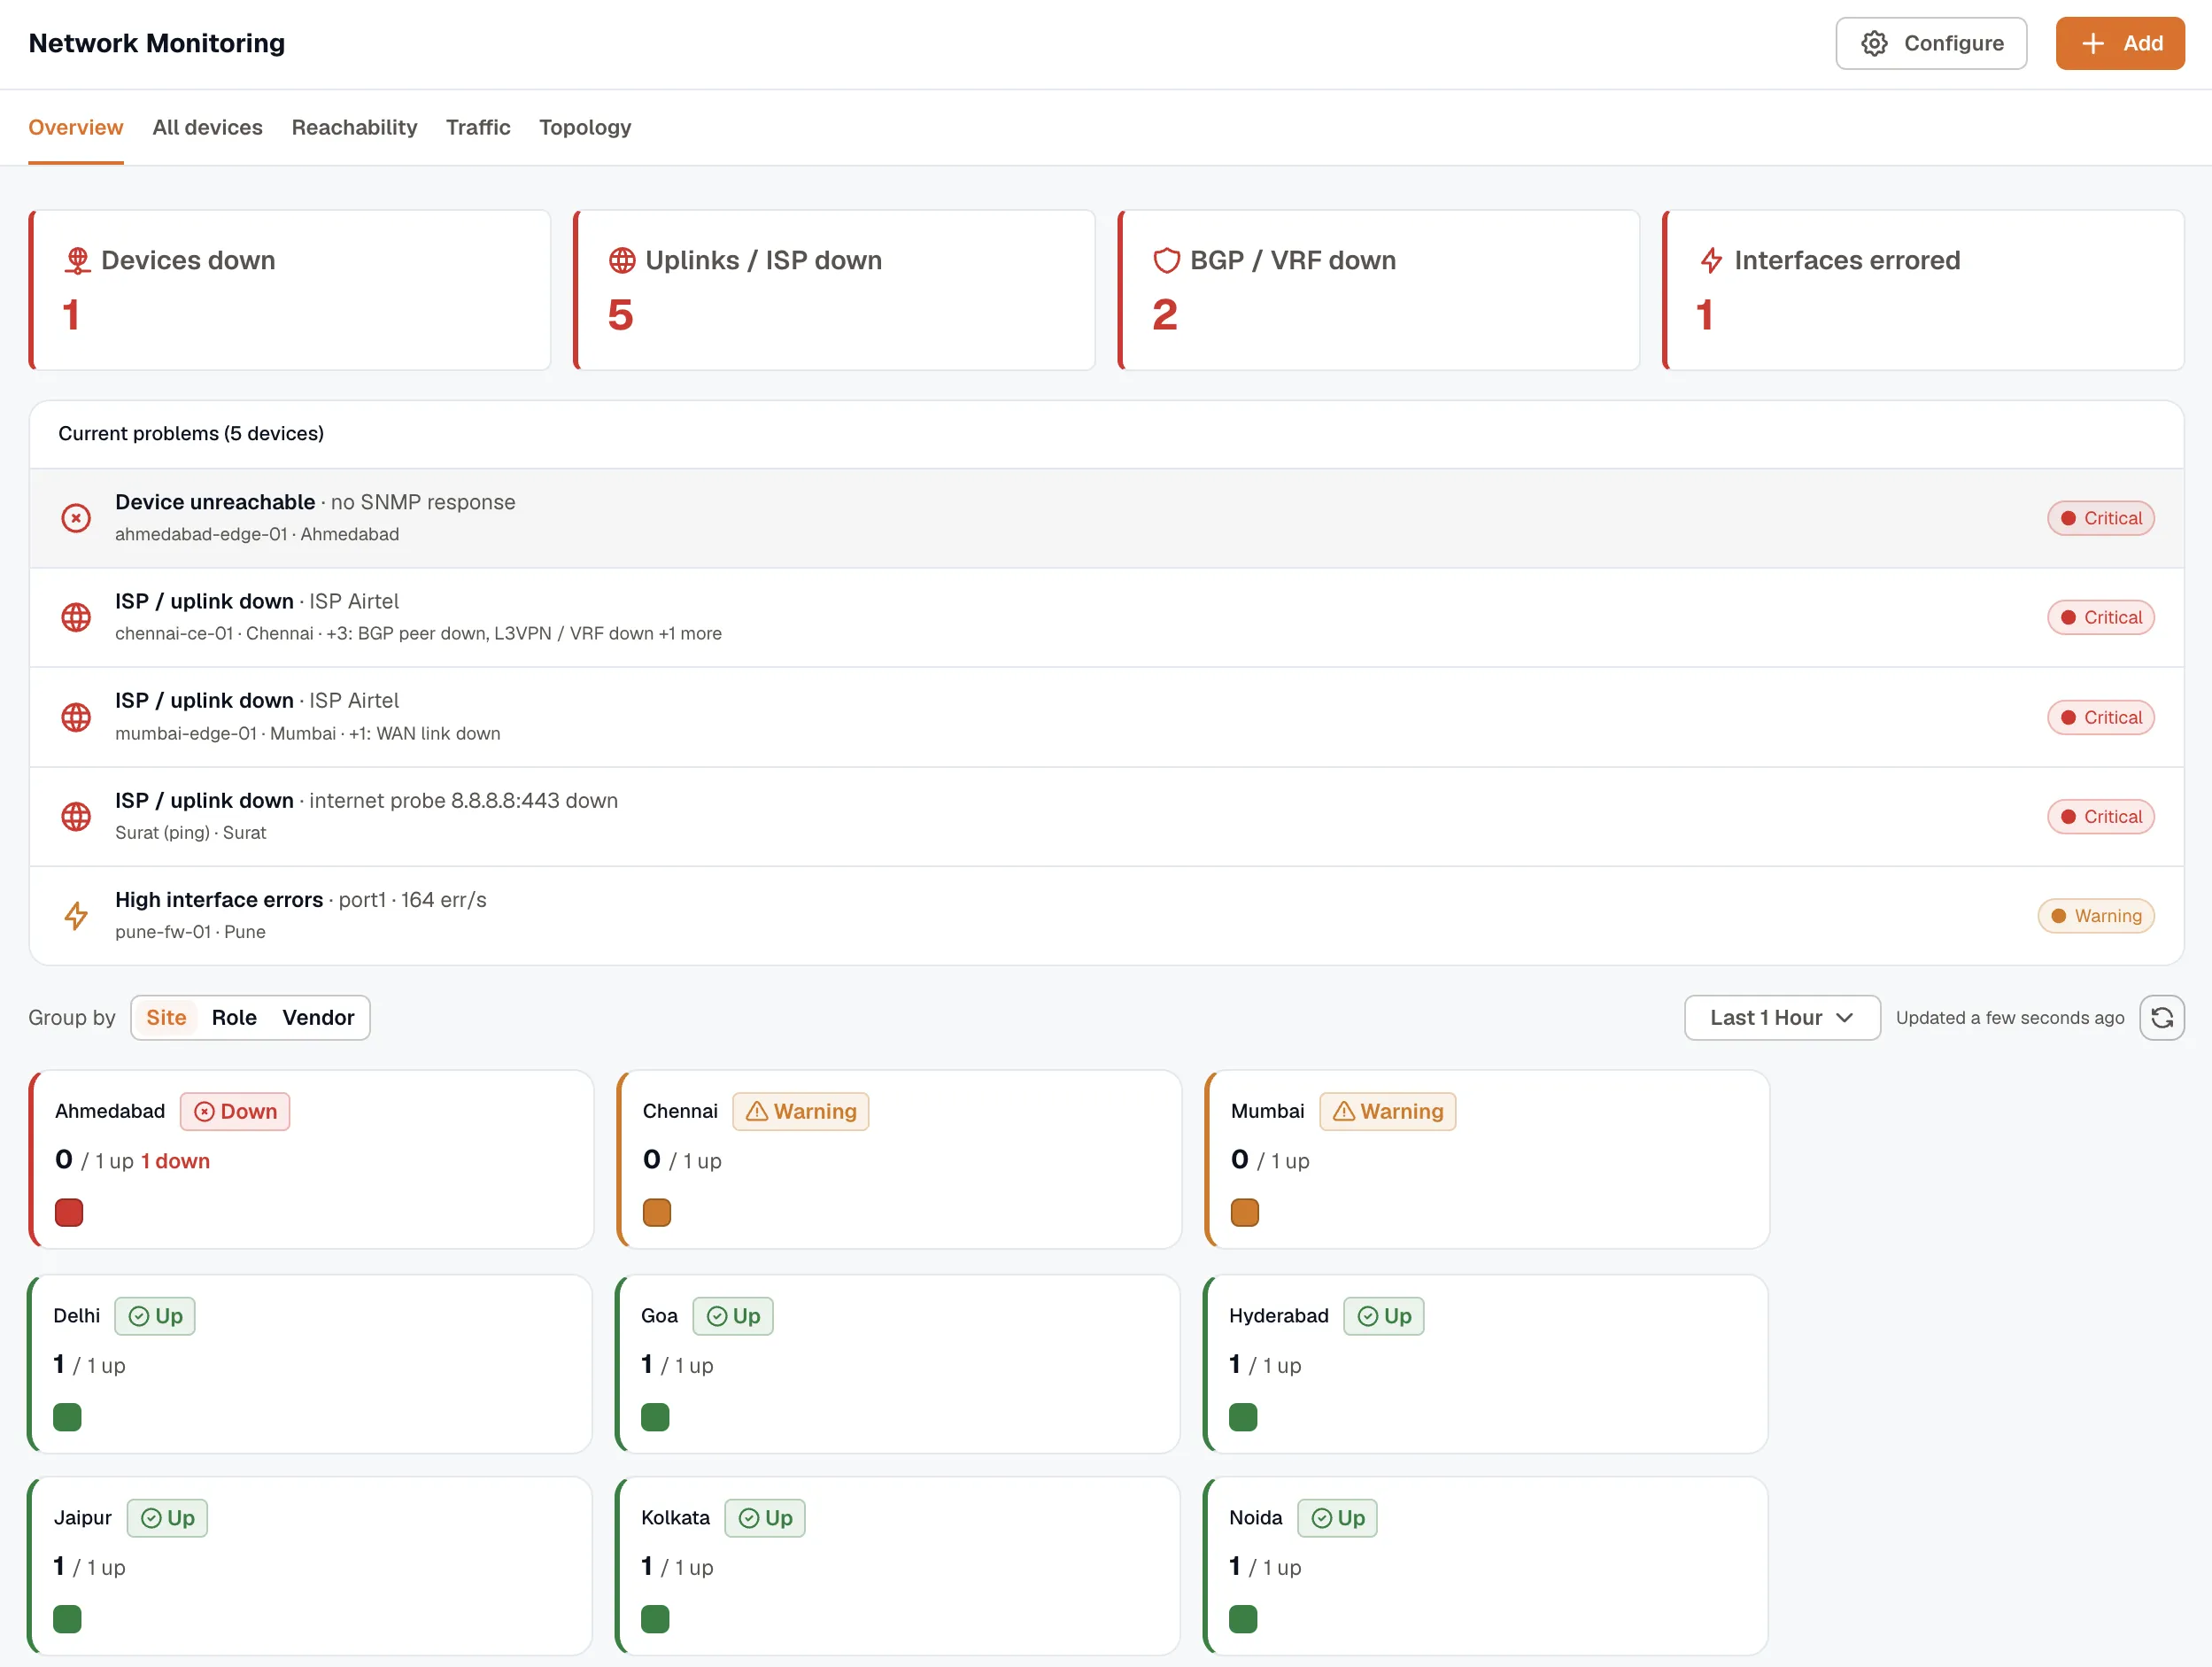
| Overview | Network-wide health: problem tiles, a live problems feed, and a status board grouped by site, role, or vendor. |
| All devices | The full, searchable table of SNMP devices with their current status and last-seen time. |
| Reachability | Ping results for sites monitored without SNMP. |
| Traffic | The application traffic mix from your flow listeners. |
| Topology | A link map drawn from LLDP and CDP neighbour data. |
For how to read each tab, see Using Network Monitoring.
Set it up
Section titled “Set it up”Everything is configured in Network Monitoring. There are no collector files to hand-edit. Use the Add menu:
- Add SNMP devices: poll known devices with the guided wizard.
- Discover devices: scan IP ranges and monitor what answers.
- Monitor sites without SNMP: add gateway and internet ping checks.
- Flow monitoring: listen for NetFlow, IPFIX, or sFlow.
To change or remove anything later, open Configure. See Manage and troubleshoot.
Before you start
Section titled “Before you start”- A KloudMate Agent running on a Linux host or in Docker, with network access to the devices or sites you want to watch. If you don’t have one yet, install the Linux agent or Docker agent.
- SNMP enabled on each device (v1, v2c, or v3), and the agent host’s IP address allowed in the device’s SNMP access list.
Once data starts flowing, use Explore for ad hoc queries, Dashboards for curated views, and Alerts to get notified when something goes down.