

Session Detail
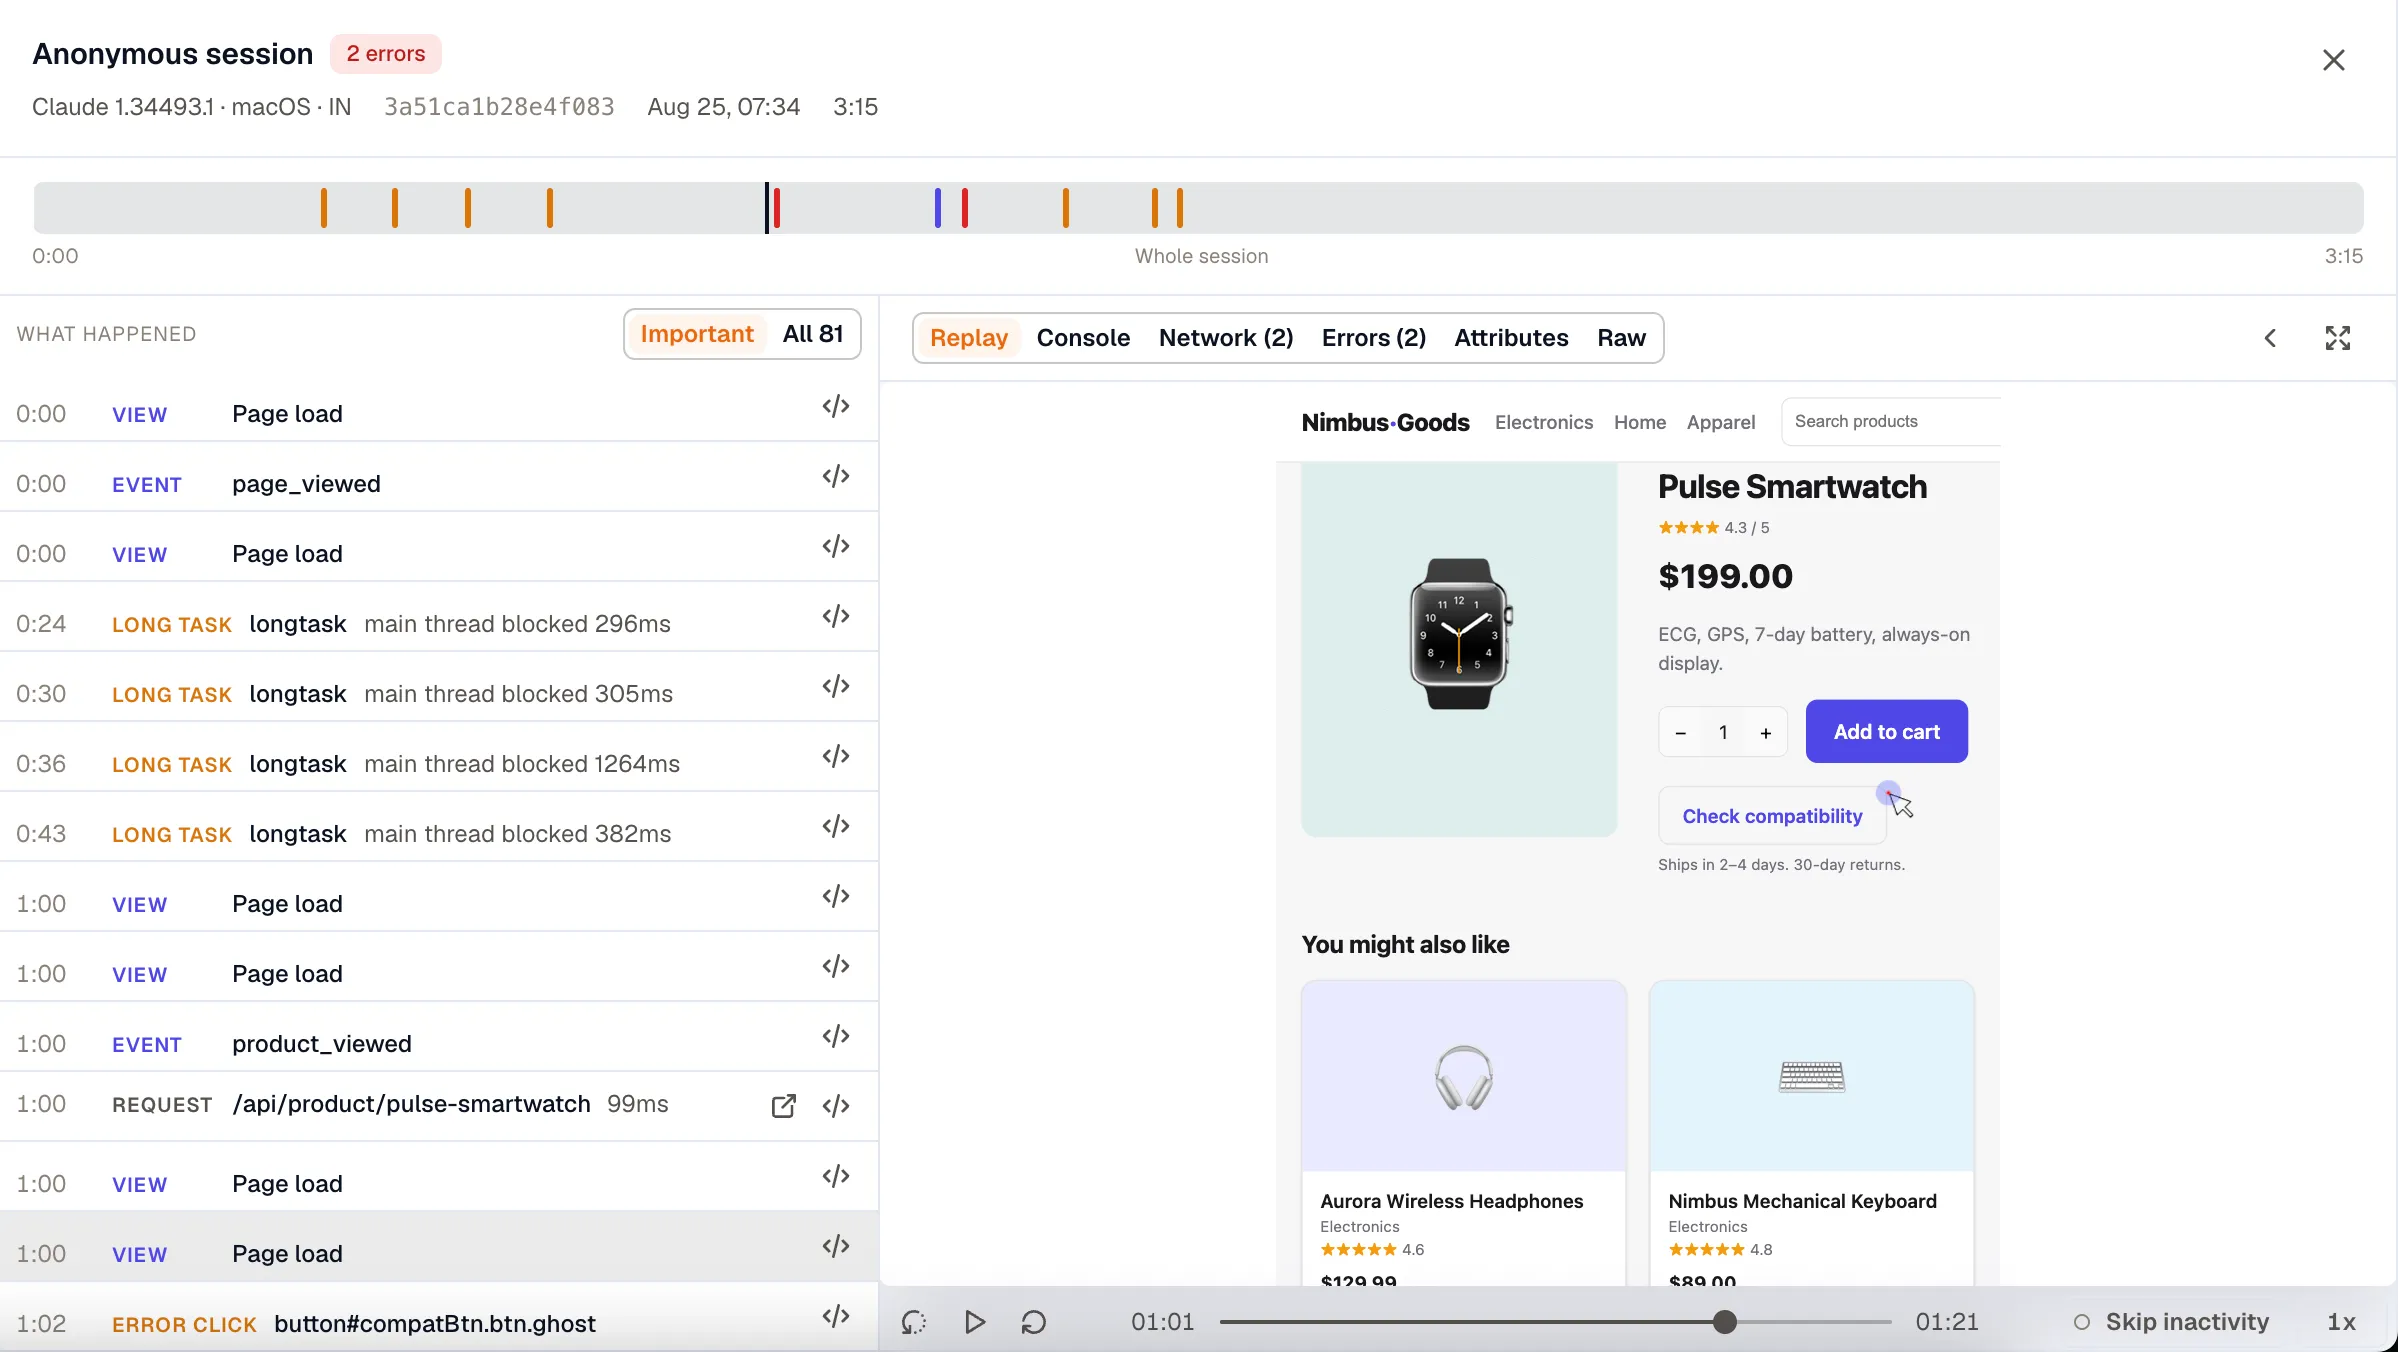
Opening a session gives you one timeline, with the replay on one side and the evidence on the other. Everything runs on the same clock, so clicking an error in the list moves the replay to the moment it happened, and playing the replay moves the list along with it.
Open a session
Section titled “Open a session”Click any row on the Sessions tab. A session link you share reopens on the same tab you shared it from. Sessions also open from outside RUM: from a drop-off table in Journeys, from an affected session on an issue, or from a browser span in Traces.
The session header
Section titled “The session header”The header names the visitor and the device and browser they were on, and badges the crashes, app hangs, errors, and rage clicks in the session. Sessions with no identity attached are labeled Anonymous session. See Identify the user to set one.
Under it, Entry page load gives the web vitals for the page the visitor arrived on: TTFB, FCP, LCP, INP, and CLS, colored good, needs-improvement, or poor. Mobile sessions get Start type and Time to first frame instead.
The timeline
Section titled “The timeline”The bar below the header runs from 0:00 to the end of the recorded activity, and everything else on the screen moves with it. Click anywhere on it to move the playhead.
Segments are the views the visitor was on, in order. Clicking one scopes What happened to that view, and clicking it again clears the scope.
Markers flag the moments worth finding: errors, crashes, app hangs, frustration clicks, and long tasks. Ordinary clicks and successful requests aren’t marked.
What happened
Section titled “What happened”The list on the left walks the session in order. Each row gives the time, the kind of event, and enough detail to recognize it. Clicking a row seeks the replay, and playing the replay highlights the row it has reached.
Important is the default. It keeps failures, frustration clicks, long tasks over 200 ms, views, requests, and custom events, and it leaves out ordinary clicks, which make up most of a real session. Switch to All to see every span the SDK sent.
Rows carry an action where there is one to take. An error opens its issue, a request opens its backend trace, and any row expands to show its raw attributes. For the backend trace to reach past the browser span, see Correlate RUM traces with OpenTelemetry backends.
Frustration signals
Section titled “Frustration signals”Rage, dead, and error clicks are events in their own right. They appear as badges on the sessions list, as markers on the timeline, and as rows in What happened, so you can open a session from a badge and go straight to the click behind it.
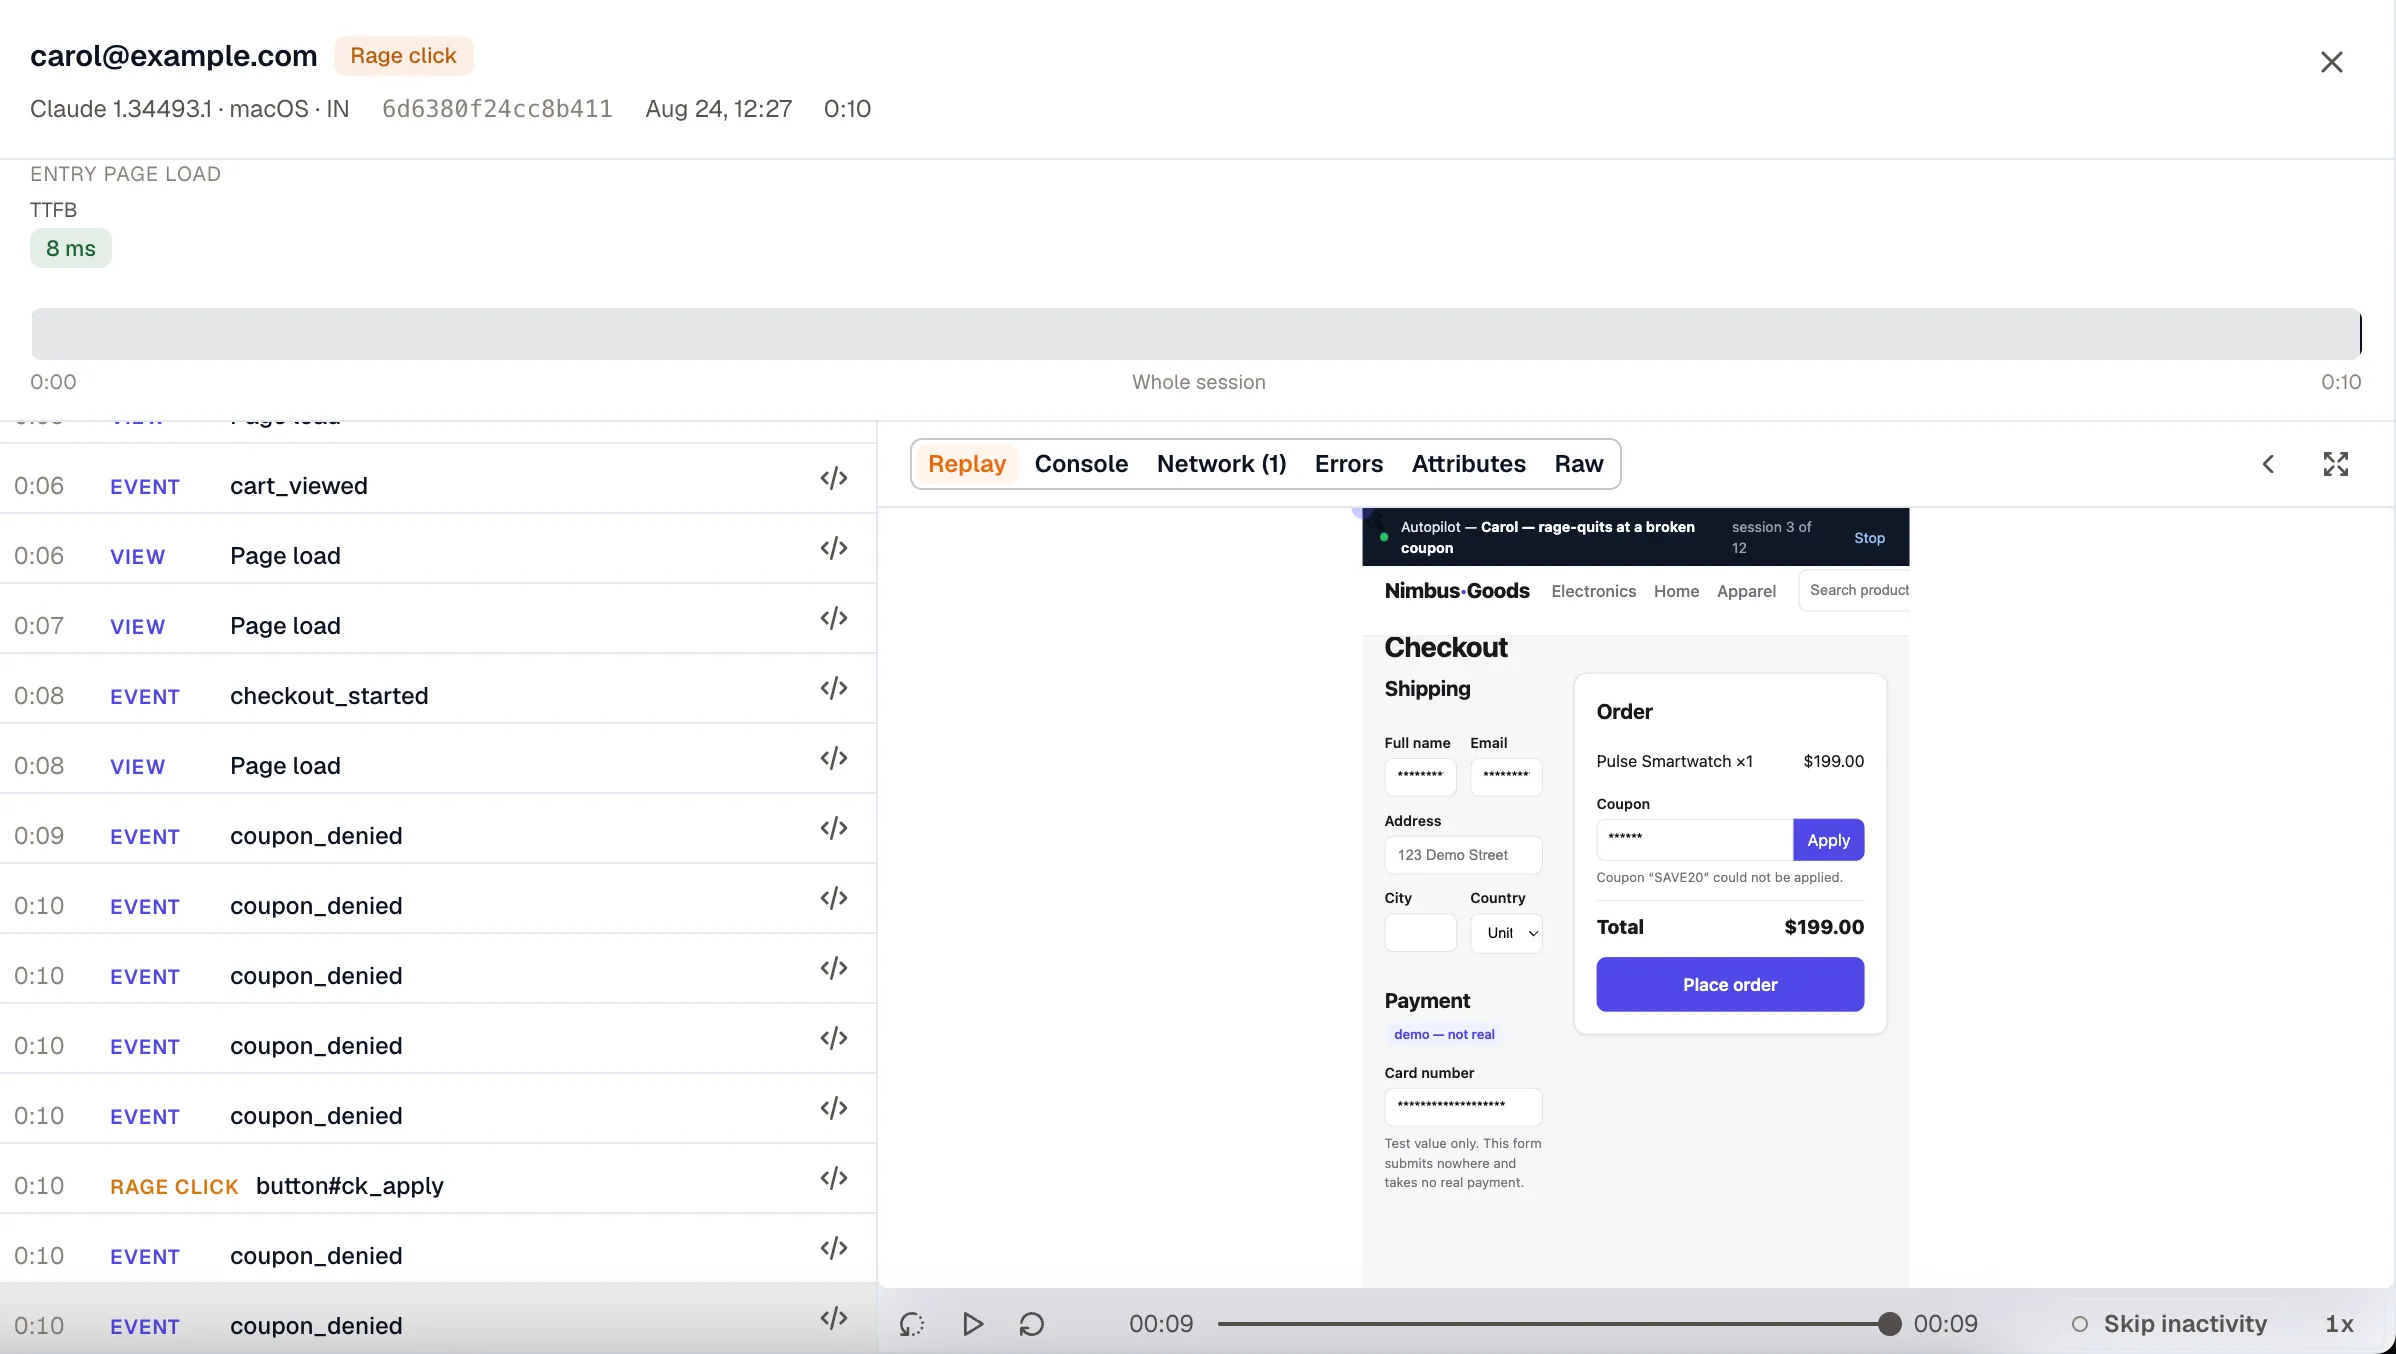
The example above is typical: a coupon that won’t apply, the same event firing over and over, and a rage click on the button that kept rejecting it.
| Signal | What it means |
|---|---|
| Rage click | Three or more clicks on the same element within one second. The row reports the full size of the burst, so ten clicks are counted as ten. |
| Dead click | A click that produced no DOM change and no navigation within 500 ms. Nothing visibly happened. |
| Error click | A click followed by a JavaScript error within one second. |
A frustration row is titled with the element that was clicked, so it names the button or link involved.
A click is only ever classified as one signal. When more than one applies, rage outranks error and error outranks dead, so a burst of clicks on a button that did nothing is reported as a rage click.
The evidence tabs
Section titled “The evidence tabs”The right-hand pane switches between views of the same session: Replay, Console, Network, Errors, Attributes, and Raw. Each tab carries its own count where it has one, such as Network (210) or Errors (14).
Replay
Section titled “Replay”The replay plays the session’s recording from wherever the timeline is positioned, on web and on mobile.
Most sessions have no recording, and their Play button in the sessions list is disabled. Raise sessionRecorder.sampleRate to record a larger share. See Record sessions for replay.
Playback runs at 1x through 8x, and Skip inactivity jumps the quiet stretches, which are most of a long session.
Seeking into a long session takes about a second, and how well that works depends on your SDK version. See Keep the SDK current.
Console
Section titled “Console”The browser console for this session. console.error and console.warn are captured by default. Set the events.console option to capture more levels, or none. See Choose what the SDK captures.
Network
Section titled “Network”Every fetch and XMLHttpRequest the session made, drawn as a waterfall, with a summary line giving the request count, how many failed, and the slowest.
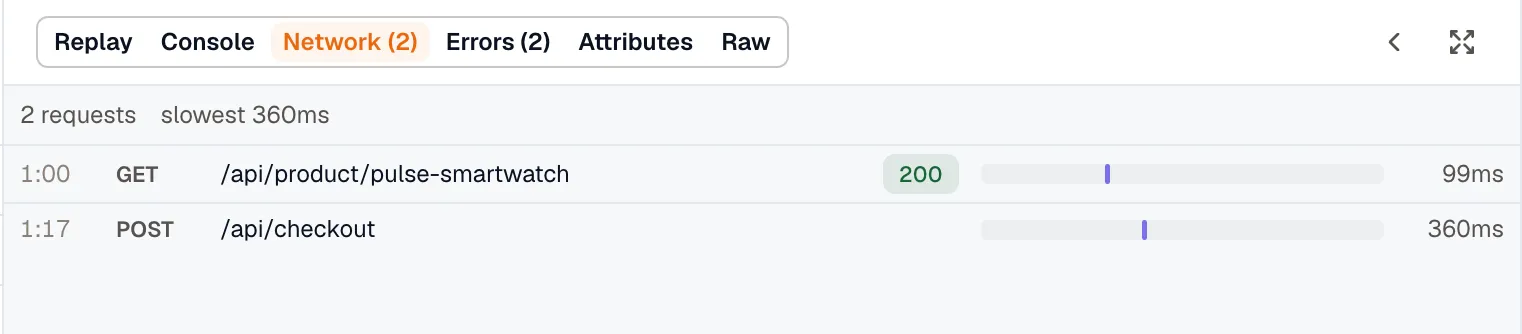
Each bar is placed against the whole session rather than sized on its own, so three calls stacked in the same second are easy to spot. Same-origin calls show the path alone and third-party calls show host and path, with the full URL on hover. Failed requests are red across the row.
Errors
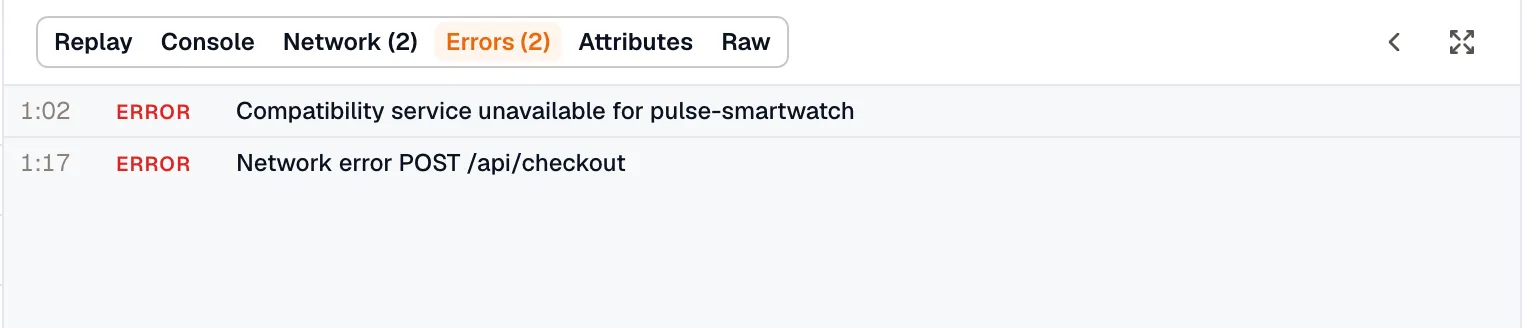
Section titled “Errors”The errors, crashes, and app hangs from this session, each with its type and message.
Attributes
Section titled “Attributes”The environment the session ran in: service, version, browser, OS, device, location, and referrer.
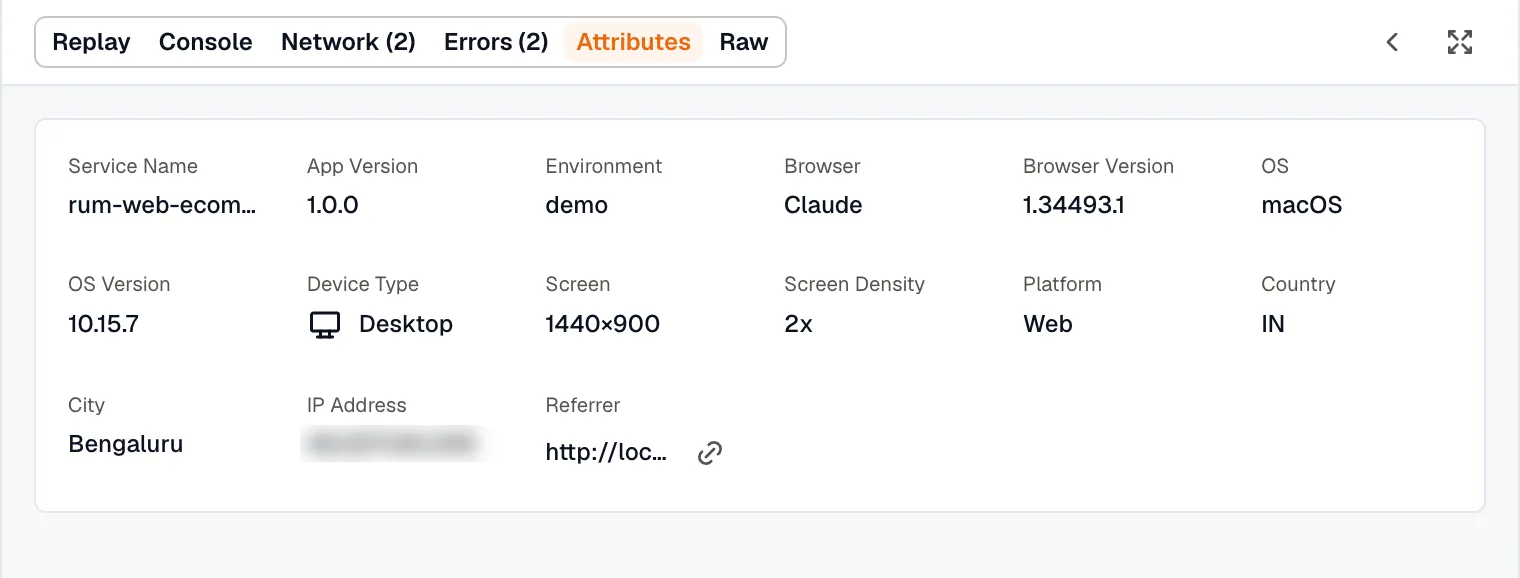
Screen is the device’s screen resolution and Screen Density is its scale factor. Both are reported on web and mobile, and the same measurement feeds the Screen resolution breakdown on Overview.
Every span the session produced, with its full JSON. Use it to check an attribute the other tabs don’t show.