

Hosts & Containers
The Hosts module provides a centralized view for monitoring the health, performance, and resource utilization of your infrastructure. This view automatically populates with data once the KloudMate Agent is installed on your Linux or Windows servers.
From this view, you can navigate from a fleet-wide overview down to the metrics and logs of an individual host or its associated containers.
Overview
Section titled “Overview”To access the Hosts module, open Hosts.
The view is divided into two primary resource types:
- Hosts: Physical or virtual machines running the KloudMate Agent.
- Containers: Docker or containerd instances running on the monitored hosts.
List View
Section titled “List View”The default table view provides a high-level summary of your active resources.
Host Metrics
Section titled “Host Metrics”For hosts, the following default metrics are displayed:
- Host Name: The detected name of the machine.
- OS: The operating system type and version (e.g., Linux, Windows).
- CPU: The percentage of CPU utilization.
- Memory: The percentage of memory used, along with total absolute usage.
- Disk Used: The absolute amount of filesystem storage used.
- Uptime: The duration the host has been running continuously.
Container Metrics
Section titled “Container Metrics”For containers, the following default metrics are displayed:
- Container Name: The name of the container.
- Image: The container image being run.
- Runtime: The runtime environment (e.g., docker, containerd).
- CPU: The percentage of CPU utilization.
- Memory: The percentage of memory used, along with total absolute usage.
Searching and Filtering
Section titled “Searching and Filtering”You can filter the list view to narrow down the resources you are monitoring:
- Search: Search for specific host names or container names.
- OS Filter: Filter the host list by Operating System (e.g., linux, windows, darwin).
- Time Range: Adjust the global time picker to view resource utilization averages over a specific period.
Drill-down View
Section titled “Drill-down View”Clicking on any Host or Container row opens a detailed drill-down drawer. This allows you to investigate the resource without leaving the context of your fleet view.
The drill-down drawer contains the following tabs depending on the resource type:
Metrics Tab
Section titled “Metrics Tab”Displays interactive time-series charts for the resource.
- Hosts: View detailed charts for CPU, Memory, Disk I/O, Network traffic, and System Load.
- Containers: View container-specific CPU and Memory utilization charts.
Logs Tab
Section titled “Logs Tab”Provides immediate access to the logs generated by the selected resource.
- You can search, filter, and analyze logs specific to that host or container directly within the drawer.
Containers Tab (Hosts Only)
Section titled “Containers Tab (Hosts Only)”When inspecting a Host, this tab lists all the active containers running on that specific machine, displaying their individual CPU, Memory, Image, and Runtime metrics. Clicking a container in this list updates the drawer to show the details for that container.
Topology Tab (Hosts Only)
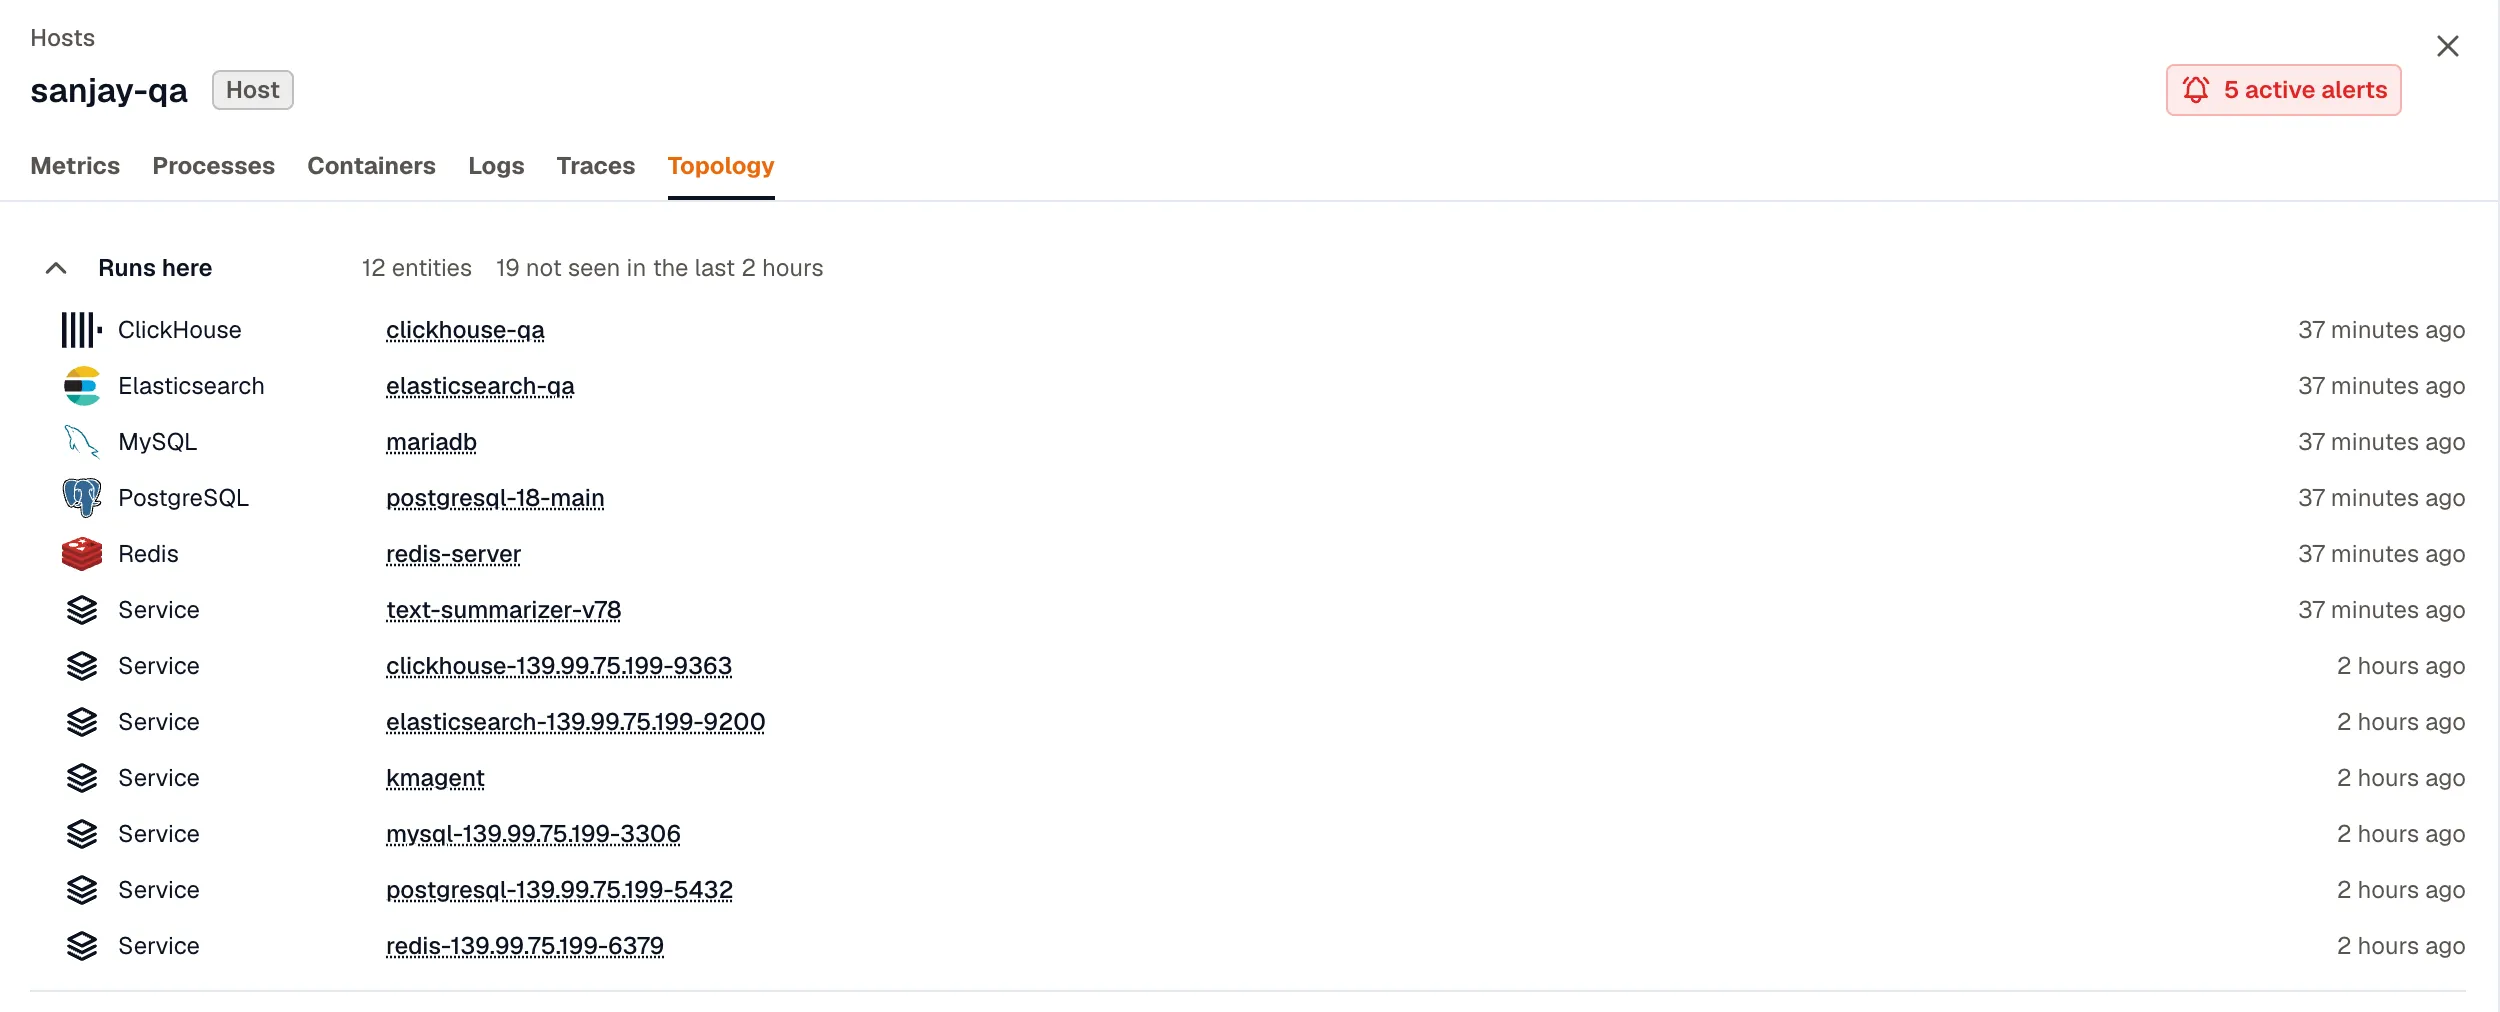
Section titled “Topology Tab (Hosts Only)”The last tab in the host drawer lists the services and databases that run on the host, what it talks with, and the EC2 instance it runs on. When the host runs on an EC2 instance, the tab also lists that instance’s security groups, subnet, volumes, and target groups.
Each group shows how many of its resources are alerting. Hover over a resource’s firing count to see its alerts, and click an alert to open its rule in a new tab.
Linking a host to its EC2 instance needs KloudMate agent 2.2.0 or later. If an AWS account is connected and the host runs an older agent, the tab asks you to update the agent.
Getting Started
Section titled “Getting Started”Host metrics are collected automatically, with no configuration, once you deploy the agent.
- Install the KloudMate Agent on your servers.
- The agent forwards core metrics (CPU, Memory, Filesystem, Uptime) and system logs to KloudMate.
- Your servers appear in the Hosts view within a few minutes.
For instructions on adding custom cloud metadata (like AWS EC2 or Azure tags) or capturing advanced process-level metrics, see the Advanced Host Metrics Collection guide.