

Linux
Install the KloudMate Agent on a Linux machine.
Supported Platforms: Debian/Ubuntu, RHEL/CentOS.
If your outbound traffic is restricted, see Before you start for the URLs and permissions to allow first.
What the Linux Agent Monitors
Section titled “What the Linux Agent Monitors”After installation, the agent sends telemetry to KloudMate. From there you can monitor system health and investigate issues.
Key capabilities:
- Monitoring CPU, memory, disk, and network usage
- Tracking performance trends over time
- Detecting resource bottlenecks
- Collecting and analyzing system and application logs
- Monitoring Docker containers on the host, when Docker is present
- Visualizing data with dashboards
- Creating alerts for critical conditions
Accessing Your Data
Section titled “Accessing Your Data”View all data in these KloudMate sections:
1. Infrastructure Monitoring
- View connected Linux hosts
- Monitor real-time and historical resource usage
- Track host availability and uptime
2. Dashboards
- Use the pre-built Host Metrics – Linux dashboard template to visualize server performance
- Build custom dashboards based on your monitoring needs
3. Log Explorer
- Search and filter logs
- Correlate logs with metrics
- Troubleshoot issues
Install Agent
Section titled “Install Agent”Step 1: Navigate to the Settings → Agents section in your KloudMate account.
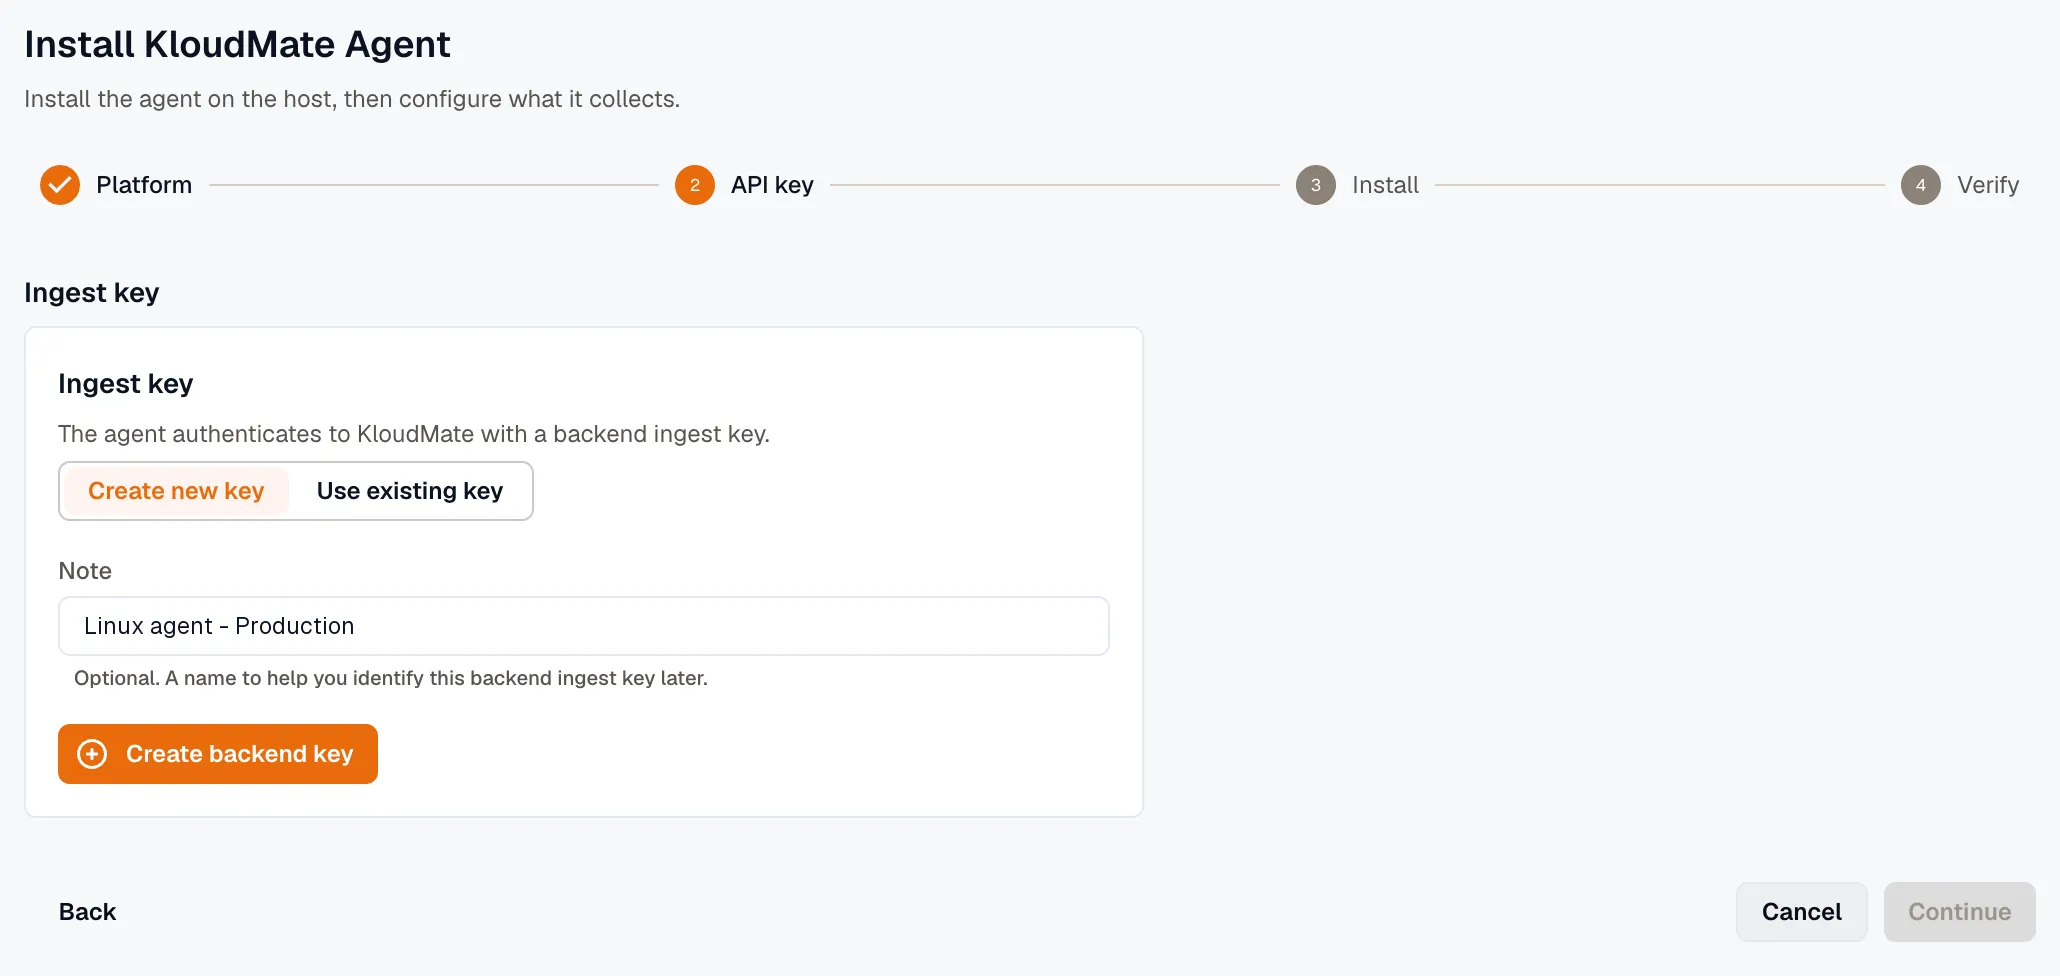
Step 2: Click Add Agent, select Linux, and click Continue. On the API key step, click Create backend key, or select Use existing key and paste your backend ingest key. Then click Continue.
Step 3: Copy and run the Linux agent install command in your terminal to download and install the agent.

Step 4: Run the agent status command to check if the agent is active.

Step 5: Execute the “Check Logs” command to confirm the agent is functioning correctly.

Log Integration
Section titled “Log Integration”By default, the KloudMate Agent collects host metrics. It does not collect system logs on Linux — to collect the systemd journal, add it with a custom config override.
To collect your own application log files, use log monitoring. In the agent’s Logs tab, point the agent at a folder and file-name pattern, then choose how to parse each line: plain text, JSON, or a regular expression. Multiline grouping, for stack traces or pretty-printed JSON, works on top of any format. You can preview the parsed records before you save. See Log monitoring.
For a hand-written filelog receiver in manual mode, see Collect File Logs with KloudMate Agent.
Monitor Docker containers on the host
Section titled “Monitor Docker containers on the host”If the host runs Docker, the agent finds the Docker socket and starts collecting container metrics and container logs on its own, the same telemetry a Docker-mode agent collects. This happens as soon as the agent starts, before and independent of application tracing. To turn it off, set KM_DOCKER_STATS=false for metrics or KM_DOCKER_LOGS=false for logs.
Each container also shows up in the Application instrumentation card on the agent’s APM tab, where you can turn on per-container tracing. Most containers offer Off or eBPF: eBPF captures RED metrics and trace spans in the kernel, with no code change and no restart. There’s no in-process SDK option for them, because the agent can’t change a running container’s start-time environment. Host processes that aren’t containerized still offer Off, eBPF, or SDK.
PHP containers are the exception: they can take an SDK option that injects the tracer and reloads the web server (Apache or php-fpm), with no redeploy and no container restart. On a Linux host this is opt-in. Set KM_CONTAINER_INSTRUMENT_ENABLED=true, and PHP containers start offering SDK on the agent’s APM tab. In Docker mode that option is on by default.
For monitoring containers, a Linux service and a Docker-mode agent are equivalent. Choose between them by how you want to run the agent, not by what they can see. See Docker mode vs the Linux agent.
Configuration and next checks
Section titled “Configuration and next checks”New agents start in managed mode, with a default of host metrics and eBPF monitoring. You review and change what is collected from the web interface, without editing files on the host. See the configuration model.
The agent’s own settings, such as the API key, host name, and self-health reporting, live in agent.yaml on the host. See the configuration reference for the full list of settings and their environment-variable equivalents.
After the agent is running, confirm what it collects and explore what it found:
- Host metrics and logs start flowing automatically. See Host metrics and logs.
- On a supported Linux kernel (4.14 or newer), eBPF monitoring turns on automatically and adds RED metrics and a service map.
- To see what the agent found and instrument a service, go to Settings → Agents, open the agent’s actions menu (⋮), and select Configure. See Discovery.
Next Steps
Section titled “Next Steps”- Open Hosts to confirm your Linux hosts are visible
- Go to Dashboards to review system performance
- Use Logs to start investigating logs
- Set up alerts and notifications for critical events
Uninstall Agent
Section titled “Uninstall Agent”Run the provided uninstall command to remove the agent.
