

Setting Up KloudMate
This page is your starting point. You’ll sign up, run through onboarding, send your first telemetry event, and determine what to set up next — based on what you want to monitor: infrastructure, applications, databases, cloud services, or something else.
Already have an account and just want to send data? Jump to Sending Data to KloudMate.
1. Sign up
Section titled “1. Sign up”-
Open the KloudMate signup page.
-
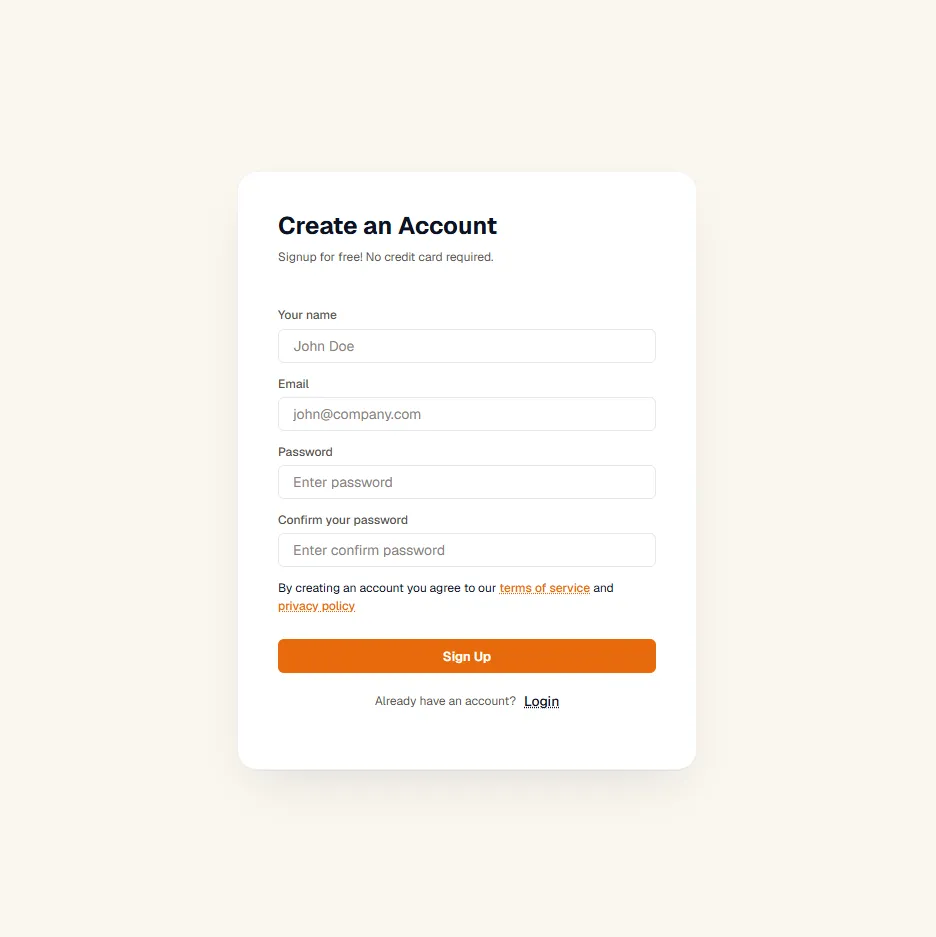
Fill in the form with a work email address.
-
Check your inbox for a verification code from
noreply@kloudmate.com. Check your spam folder if it doesn’t arrive. -
Enter the code on the next screen and click Next.
2. Walk through the onboarding wizard
Section titled “2. Walk through the onboarding wizard”Onboarding is a five-step wizard. Most steps take seconds; the only one with real work is the data-source step.
Step 1 — Create your organization
Section titled “Step 1 — Create your organization”Pick a name for your organization. Your browser timezone is captured as the org-wide default for alert schedules and report cadences — change it later under Settings → Organization.
Step 2 — Tell us about your stack
Section titled “Step 2 — Tell us about your stack”Three quick picks that tailor the next step to your setup:
- Your role — Developer, SRE, Platform, or Eng. Manager.
- Primary language — Node, Python, Java, Go, .NET, Ruby, PHP, or Other.
- Where you run your services — Kubernetes, VMs, Serverless (AWS), or Mixed.
These drive the install-method recommendation in Step 4 and pre-tune the snippets you’ll see. Change any of them later under Settings.
Step 3 — Name your workspace
Section titled “Step 3 — Name your workspace”Workspaces separate environments, teams, or products inside one organization — for example, prod, staging, and dev as three workspaces sharing the same org. Pick a name; add more workspaces later under Settings → Workspaces.
Step 4 — Send your first event
Section titled “Step 4 — Send your first event”Two options appear, with one marked Recommended for your stack based on the deployment you picked in Step 2:
| If you picked… | Recommended path |
|---|---|
| Kubernetes, VMs, or Mixed | OpenTelemetry — install the KloudMate agent (Helm chart for K8s, Linux/Windows binary for VMs). Auto-instruments Node, Python, Java, .NET, and Go pods on K8s with no code changes. |
| Serverless (AWS) | AWS Integration — connect your AWS account; Lambda, EC2, RDS metrics and CloudWatch logs flow in without an agent install. |
Select the recommended option unless your setup requires otherwise. The other option is still available — connect AWS even from a Kubernetes deployment if you want both. The next section covers less common cases.
The OpenTelemetry path opens install instructions in a new tab and advances the wizard to Step 5. The AWS path runs the AWS onboarding flow inline.
Step 5 — Verify ingestion
Section titled “Step 5 — Verify ingestion”The verify step waits for any signal — trace, log, metric, RUM event — to land in the workspace. As soon as the first one arrives, the step ticks complete and the wizard finishes. To continue later, click Skip for now — the home-page checklist picks up where you left off.
3. Pick the right ingestion path for your goal
Section titled “3. Pick the right ingestion path for your goal”The Step 4 recommendation is a good default, but the right path depends on what you’re actually monitoring. Use this table to match your goal to the page that has the install instructions.
| What you want to monitor | Best path | Notes |
|---|---|---|
| Hosts, VMs, or Kubernetes infra (CPU, memory, disk, network, pod health) | KloudMate Agent | One agent install. eBPF-powered, low overhead, zero code changes. |
| Application traces and latency (APM) | OpenTelemetry SDK — or the KloudMate Agent on K8s for auto-instrumentation | On Kubernetes the agent auto-instruments Node, Python, Java, .NET, and Go pods. Outside K8s, install the OTel SDK directly in your app. |
| Application logs | KloudMate Agent — or push directly via OpenTelemetry | The agent tails common log paths automatically. The OTel logs SDK gives you finer control over structured logging. |
| Databases (Postgres, MySQL, Mongo, Redis, etc.) | Database Monitoring | Connect the database; query stats, slow logs, and connection health stream in. |
| AWS services (Lambda, EC2, RDS, ECS, DynamoDB, …) | AWS Integration | Agentless cloud-platform pull via the AWS API. |
| Azure services | Azure Integration | Azure Monitor + Event Hub. |
| Existing Prometheus metrics | Prometheus Integration | Forward your Prometheus metrics via the OTel-based remote-write path. |
| Existing OpenTelemetry pipelines | OpenTelemetry Collector | Add an OTLP exporter — no changes to your collector-first architecture. |
| Synthetic monitoring (uptime, browser checks) | Synthetics | Set up checks from the UI; no agent or SDK required. |
| Real-User Monitoring (RUM) | RUM | Drop the browser SDK into your frontend to capture session, performance, and error data. |
For a side-by-side decision walkthrough and a phased rollout pattern, see Sending Data to KloudMate.
4. What to do next
Section titled “4. What to do next”When the wizard finishes, you land on the home page with a Setup checklist drawer open. It lists the next steps worth completing — instrument an application, build a dashboard, create an alert, wire a notification channel, invite a teammate. Each row jumps you straight to the right page, with the option to ask the assistant if you’d rather be walked through.
Re-open it any time from the Setup pill in the header.
Where to go from here
Section titled “Where to go from here”Related resources
Section titled “Related resources”- What is KloudMate? — concepts and platform overview.
- Core concepts — signals, OpenTelemetry, eBPF, SLOs.
- Get help — support and community.