

Configuration & Management
The KloudMate Agent is managed centrally from the web UI, so there is no need to SSH into servers or edit local YAML files. Changes made in the dashboard are pushed to the agents automatically.
Agents Overview
Section titled “Agents Overview”The KloudMate agent’s landing page lets you view, add, and manage agents. After an agent is integrated, it appears in the table:
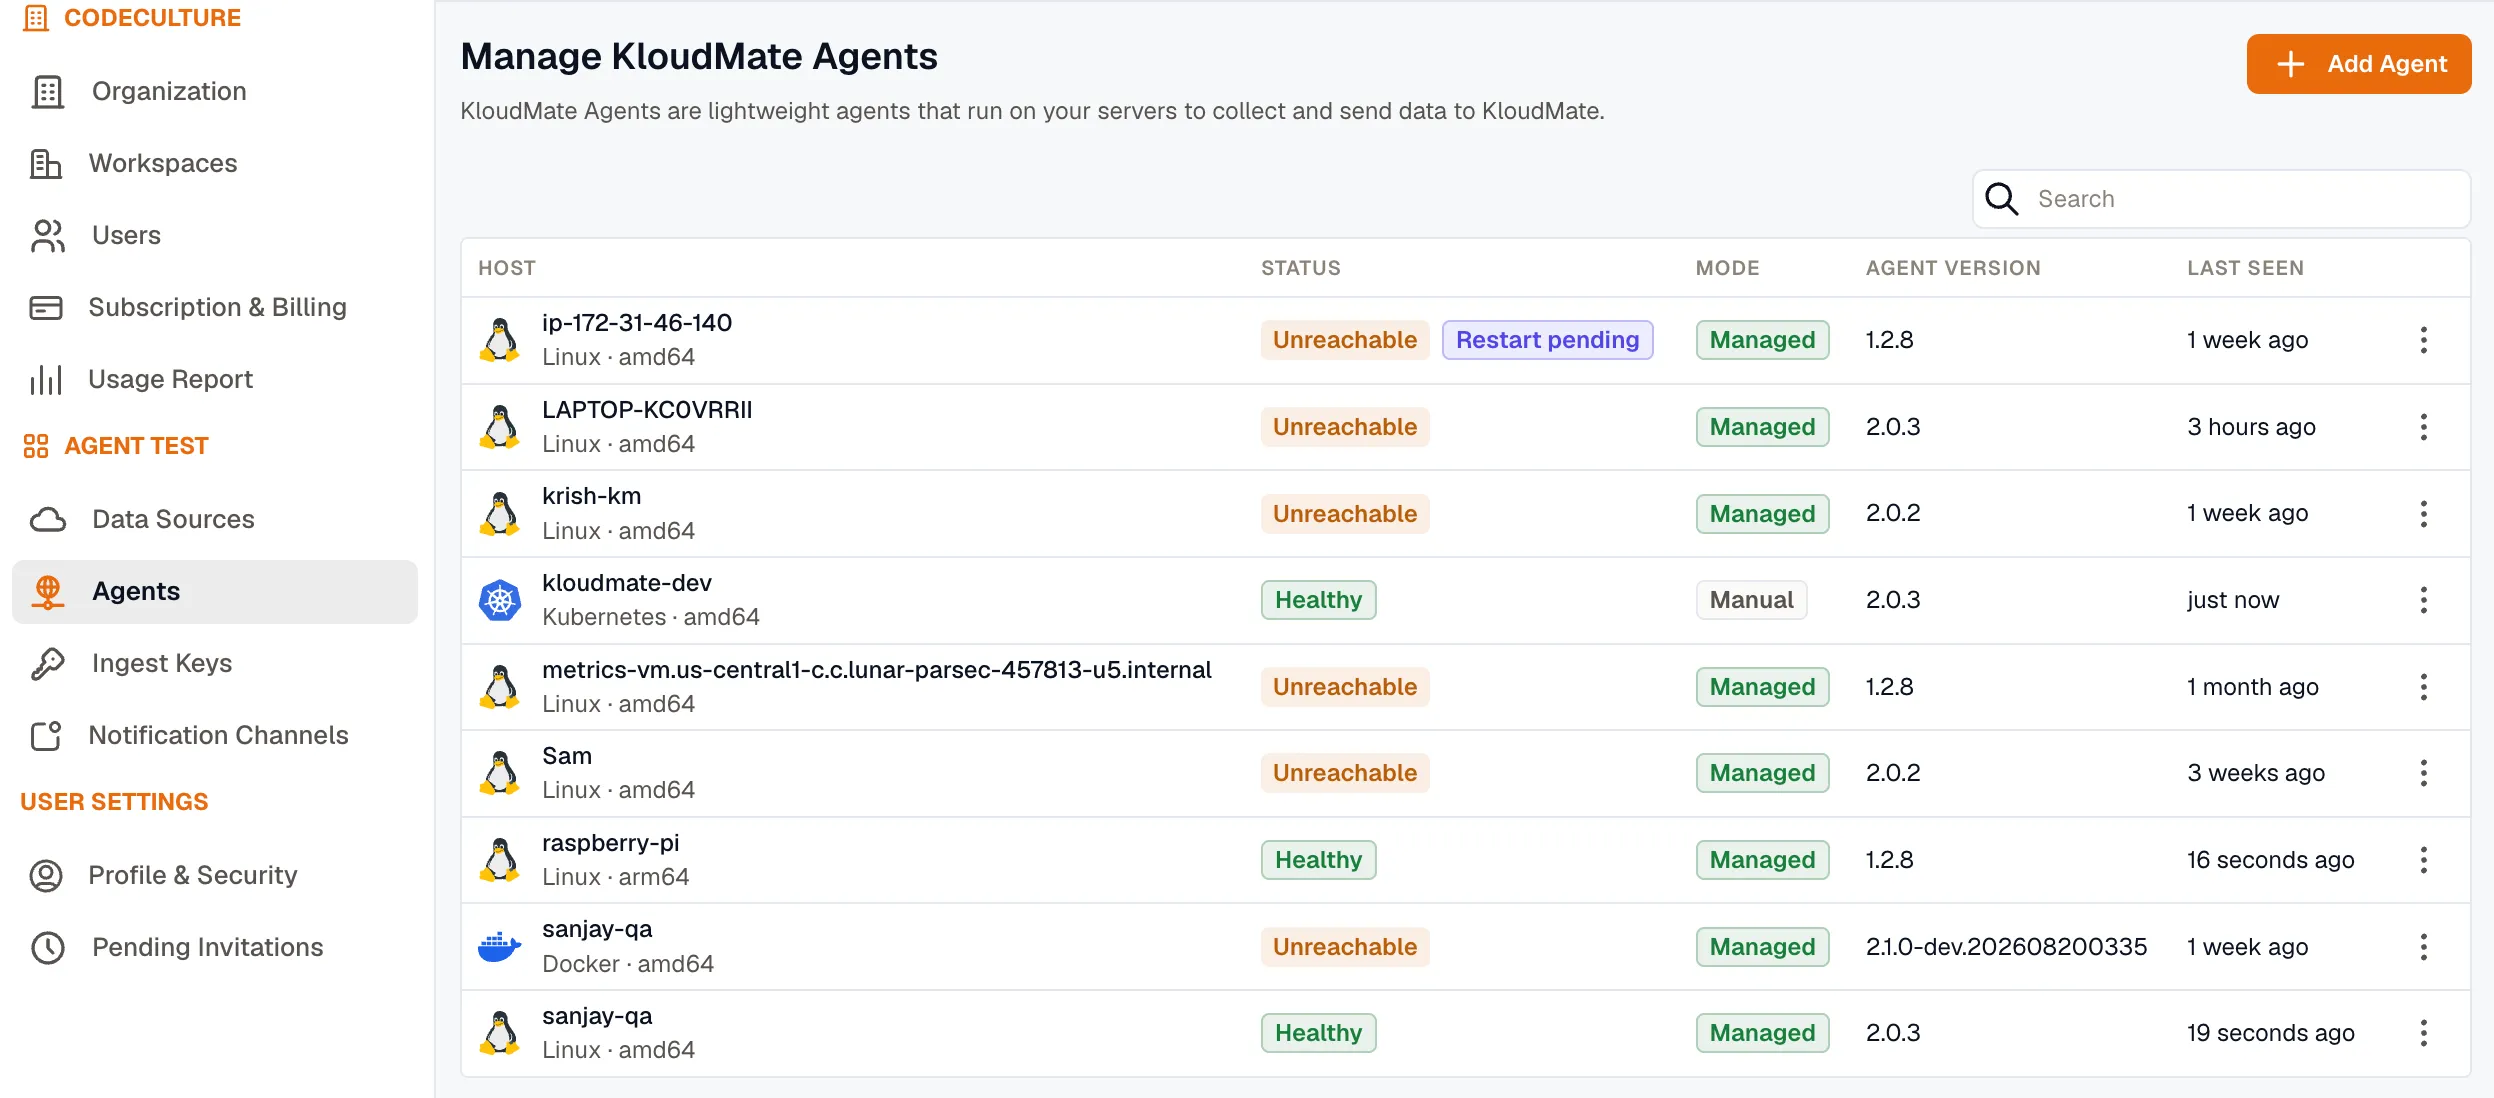
- Host: The agent’s host machine name, with its platform and architecture underneath (for example,
Linux · amd64). - Status: The agent’s current reachability, such as Healthy or Unreachable, plus a Restart pending tag while a restart is in progress.
- Mode: Whether the agent is in Managed or Manual configuration mode. See Managed and manual mode.
- Agent Version: Version of the KloudMate agent used during integration.
- Last Seen: How long ago the agent last checked in.
Adding a New Agent
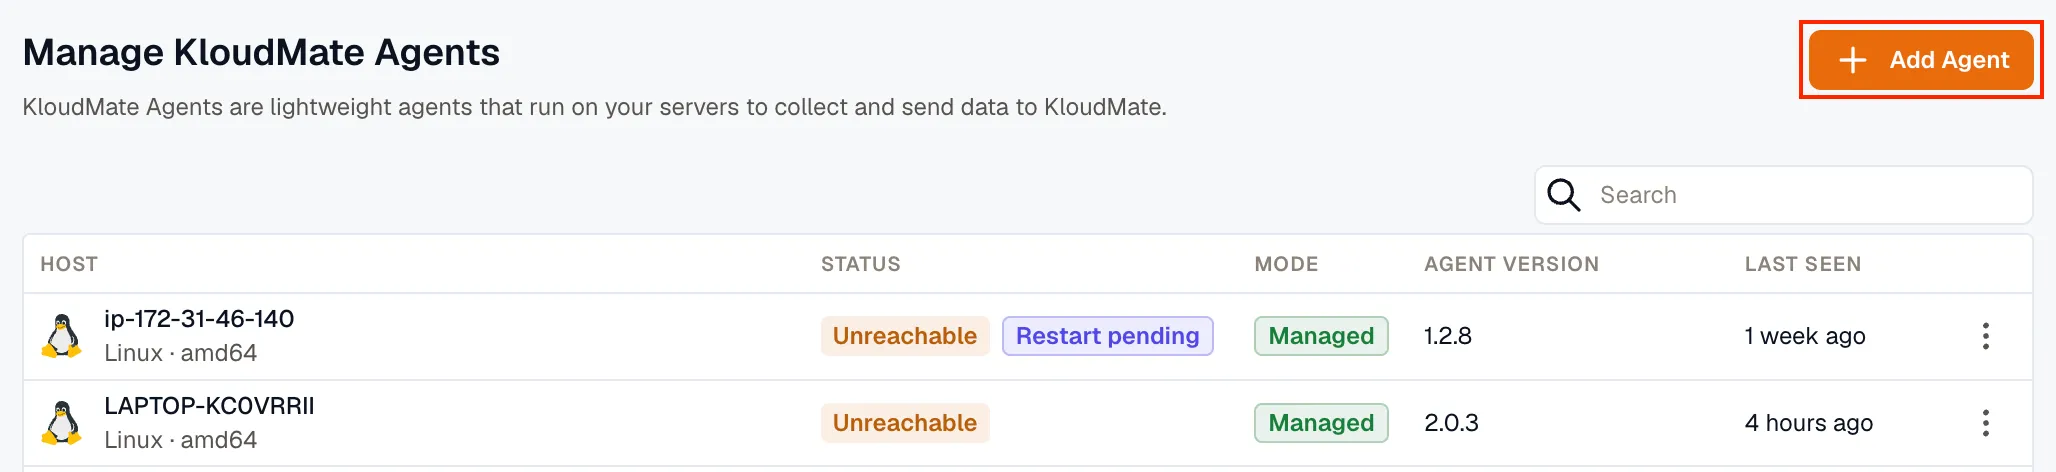
Section titled “Adding a New Agent”- Click the Add Agent button located at the top-right corner of the page.
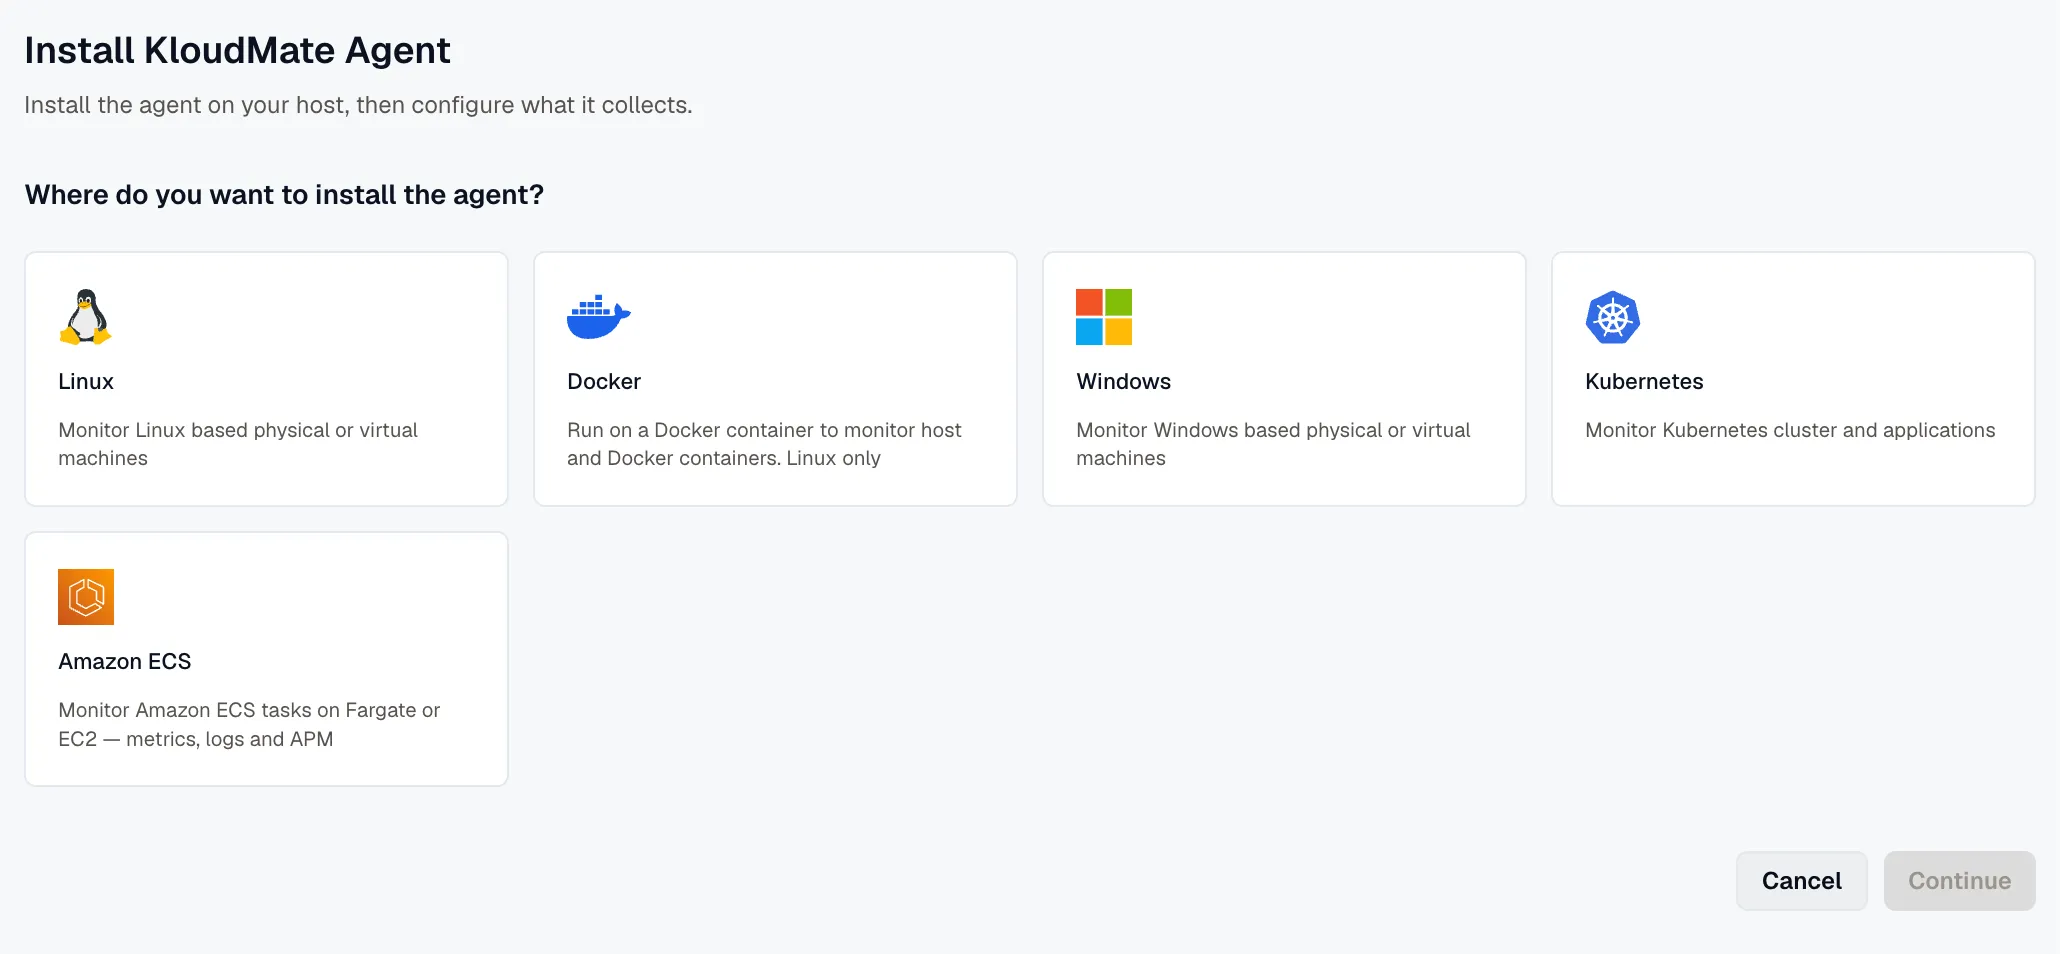
- Choose where you want to install the agent.
Configuring an Agent
Section titled “Configuring an Agent”The agent watches for remote configuration changes over a secure connection and updates itself automatically.
Open the actions menu (⋮) for an agent to manage it:
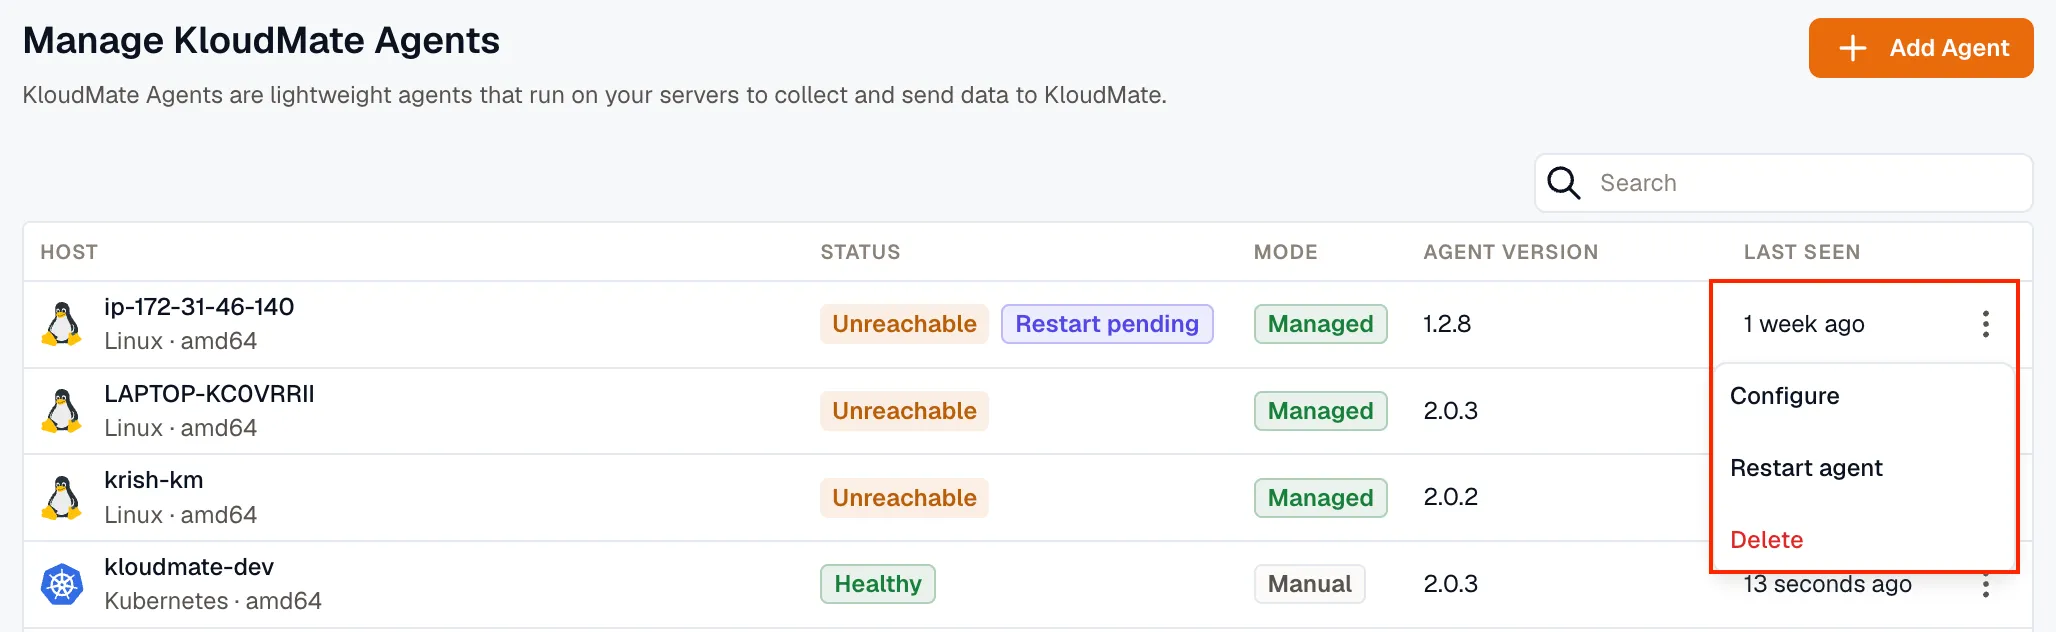
- Configure: Opens the agent’s Configuration page, with tabs for APM, Databases, Logs, Processes, Runbook scripts, and Collector config. Updates apply automatically wherever the agent is installed.
- Restart agent: Restart the agent when needed.
- Delete: Remove the agent from the KloudMate Agent landing page and clear all of its configuration.
Managed and manual mode
Section titled “Managed and manual mode”Each agent runs in one of two configuration modes:
- Managed mode (the default for new agents): KloudMate generates the collector configuration from the features and integrations you toggle, and the YAML editor shows a read-only preview. This is the recommended way to configure an agent.
- Manual mode: the raw YAML is edited directly, and the feature toggles are disabled. This is for advanced, hand-tuned setups.
You can switch an agent between modes. Switching from manual to managed replaces the hand-edited YAML with generated configuration, so review the change first. For the full model, see the configuration model.
Rolling back a change
Section titled “Rolling back a change”To undo a managed change, turn the toggle back. There is no separate history or rollback button. Switching an agent from manual to managed mode saves your hand-edited YAML first, so you never lose it. See the configuration model.
Runbook scripts
Section titled “Runbook scripts”The Runbook scripts tab decides whether a workflow can run commands on this host with the Run Command on Host step. Scripts are off until someone with the Developer role turns on Allow runbook scripts on this host. The agent picks up the change within a minute. Only Linux host agents have this setting.
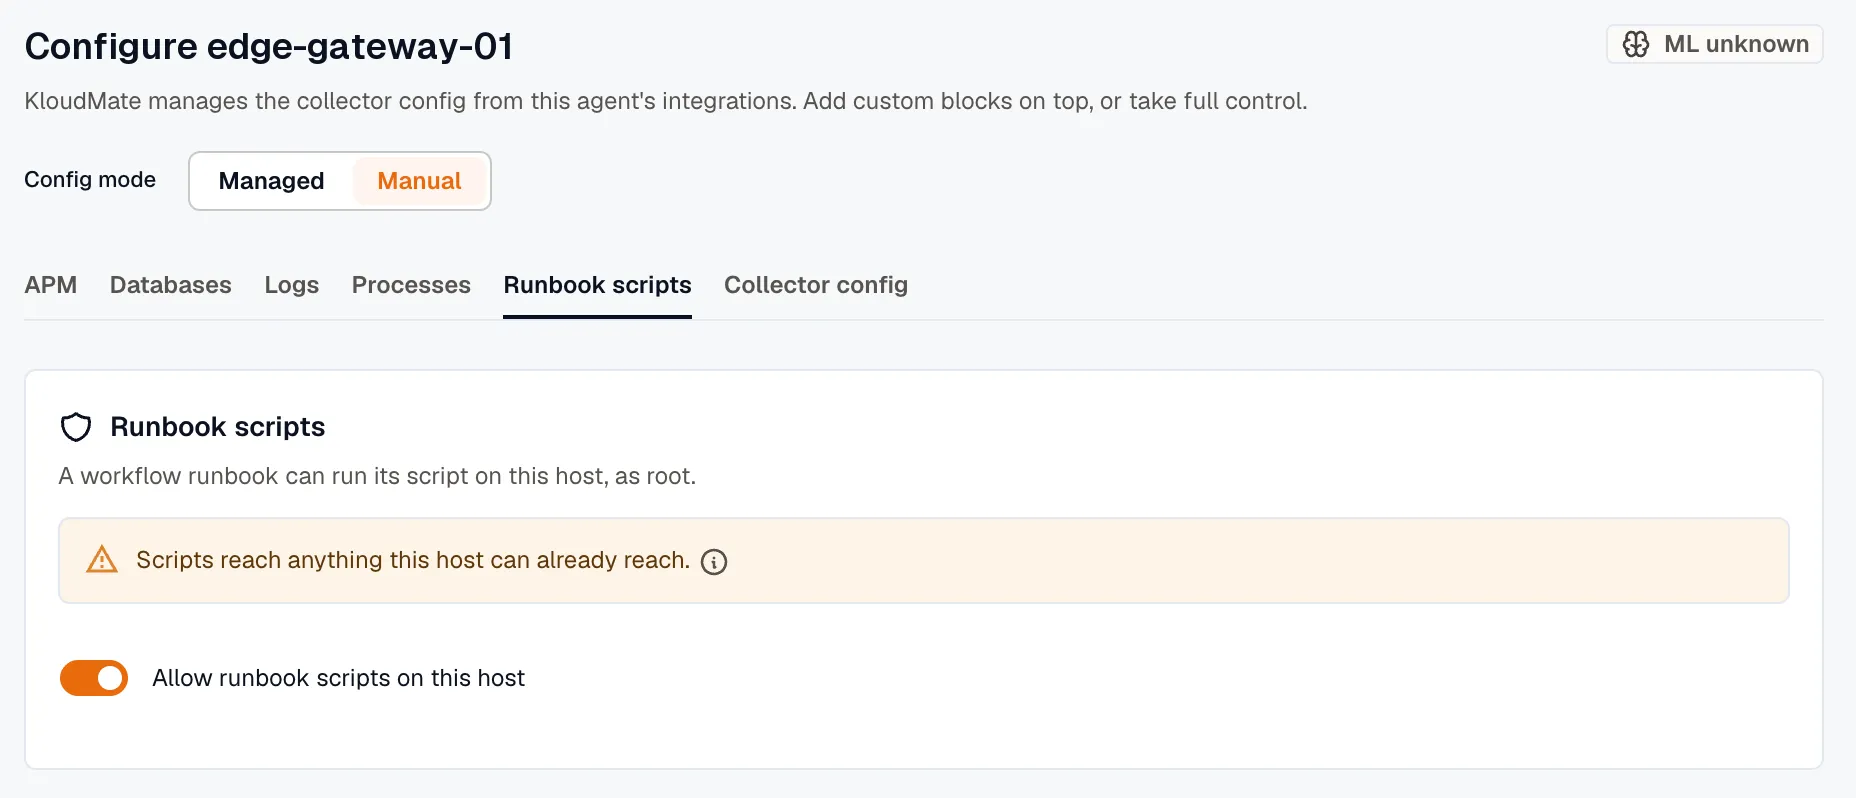
Scripts run as root and can access anything the host can already access, such as a kubeconfig, a cloud instance profile, or an SSH key on disk. Allow them only on hosts where that’s acceptable.
To block scripts on a host regardless of this setting, set job-types to none in the host’s agent.yaml. See Runbook scripts in the agent configuration reference.
Common Configurations
Section titled “Common Configurations”Feature Flags
Section titled “Feature Flags”You can control which telemetry signals the agent collects by updating the feature flags in the configuration:
| Flag | Default | Description |
|---|---|---|
| featuresEnabled.metrics | true | Enables metrics collection |
| featuresEnabled.traces | true | Enables trace collection |
| featuresEnabled.apm | false | Enables application performance monitoring |
| featuresEnabled.logs | false | Enables log collection |
eBPF Configuration
Section titled “eBPF Configuration”To configure the eBPF receiver in your config.yaml, use a snippet like this:
Database Monitoring Configuration
Section titled “Database Monitoring Configuration”Enable heuristic SQL detection and tune caches for high-load environments to capture database query performance:
See the agent’s own errors
Section titled “See the agent’s own errors”When an agent shows as Unreachable or Degraded in Settings → Agents, you’ll usually want its logs. Each agent sends its own ERROR-level logs to your workspace, so you can read them in Log Explorer without SSHing into the host or running docker logs or kubectl logs.
These logs are sent independently of the collector, so they still arrive even when the collector fails to start on an invalid config. Both the agent and its collector log this way, so a failure in either one appears in the same place.
Find them in Log Explorer
Section titled “Find them in Log Explorer”Open Log Explorer and filter on the agent’s service name:
service.name = kmagent: the agent’s logs are a distinct service, separate from your application telemetry- Add a
host.namefilter to narrow to a single agent
Every entry includes a few attributes for context:
host.name: links the agent’s errors to the rest of that host’s dataagent.versionandcollector.version: which build reported the error- On Kubernetes, also
k8s.cluster.name,k8s.node.name,k8s.pod.name, andkmagent.role
Turn it off
Section titled “Turn it off”Error-log shipping is on by default. It reuses the same KM_API_KEY and KM_COLLECTOR_ENDPOINT as the rest of the agent, so there’s nothing extra to set up. To disable it, set KM_AGENT_ERROR_LOGS=false (every agent reads this), or pass --agent-error-logs=false to the Linux/host agent.
Agent health and status
Section titled “Agent health and status”Beyond the status shown on the landing page, each agent reports on its own health so you can confirm it is running and see when something goes wrong:
- Health metrics tell you whether the agent and its collector are up, and classify why the collector is down if it is. See Agent health metrics.
- Self-logs bring the agent’s own error messages into KloudMate, so you can diagnose a failure without logging in to the host. See Agent self-logs.
After a configuration change, confirm it applied by checking that telemetry is still flowing and that the agent’s health metrics report a clean apply.
Resource usage
Section titled “Resource usage”The agent is light. On a virtual machine or host, it runs as a single process and typically uses around 185 MiB of memory and under 2% of one CPU core. Usage grows with the amount of telemetry it handles and the number of services it watches.
On Kubernetes, usage is split across the per-node collector and a few cluster-wide components. See Resource usage and sizing for per-component figures and suggested CPU and memory requests and limits.
Updating the agent
Section titled “Updating the agent”Update the agent by upgrading its package on the host or the Helm release on Kubernetes, the same way you installed it. The bundled instrumentation agents are versioned with the KloudMate agent, so they update together. See the installation guides.
Best Practices
Section titled “Best Practices”- Use filters and search on the Agents landing page to quickly locate agents by host, platform, or status.
- For clusters with multiple agents, consider bulk restarting or updating collectors where supported.
- Always confirm that agent configurations have applied successfully by checking your dashboards.