Explore
Explore is the ad hoc query workspace in KloudMate. Build and validate a query — metrics, logs, or traces — before you commit it to a dashboard.
This walkthrough focuses on metrics.
Explore Walkthrough
Section titled “Explore Walkthrough”-
Navigate to Explore Open the Explore section from the left-hand navigation menu. A new untitled panel opens immediately.
-
Configure the Visualization Use the Panel Type dropdown to choose how results are displayed:
TimeSeries,Stats,Table,Pie Chart,Bar Chart,Histogram,Logs List,Spans List,Alerts List,Issues List, orText.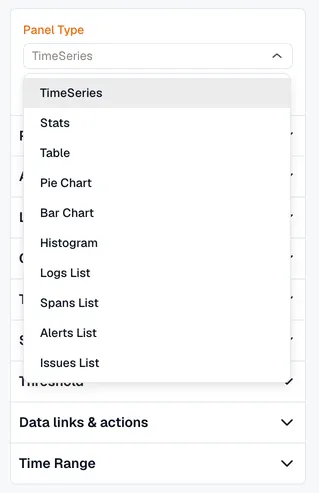
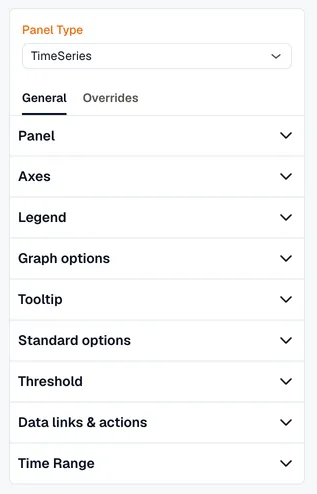
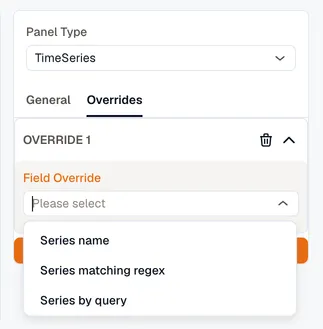
Below it, the settings panel splits into tabs:
- General controls panel appearance and behavior — axes, legend, graph options, thresholds.
- Overrides applies a field-level customization to one series, by name, a matching regex, or a query.
-
Choose the Data Source and Signal Type At the top of the query editor, select the data source and set the signal type to
Metrics. Keep the query interval onAutounless you need a specific rollup interval. -
Build the Query In the Query Builder, select a metric name and choose an aggregation function such as
Avg,Sum,Min, orMax.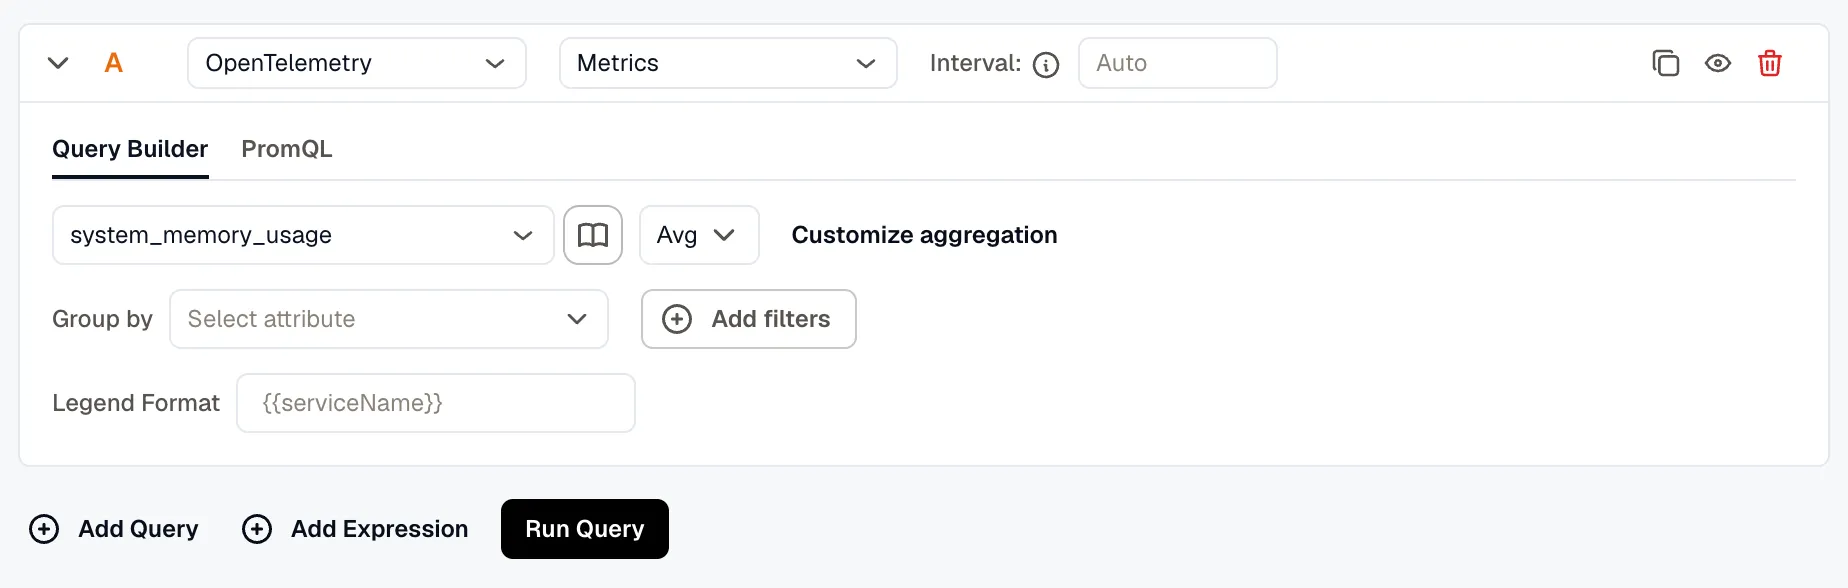
- Click Customize aggregation to access advanced temporal and spatial aggregation controls. See Metrics Aggregations for details.
- Use Group by to break down the metric by one or more attributes, such as
host_idorhost_name.
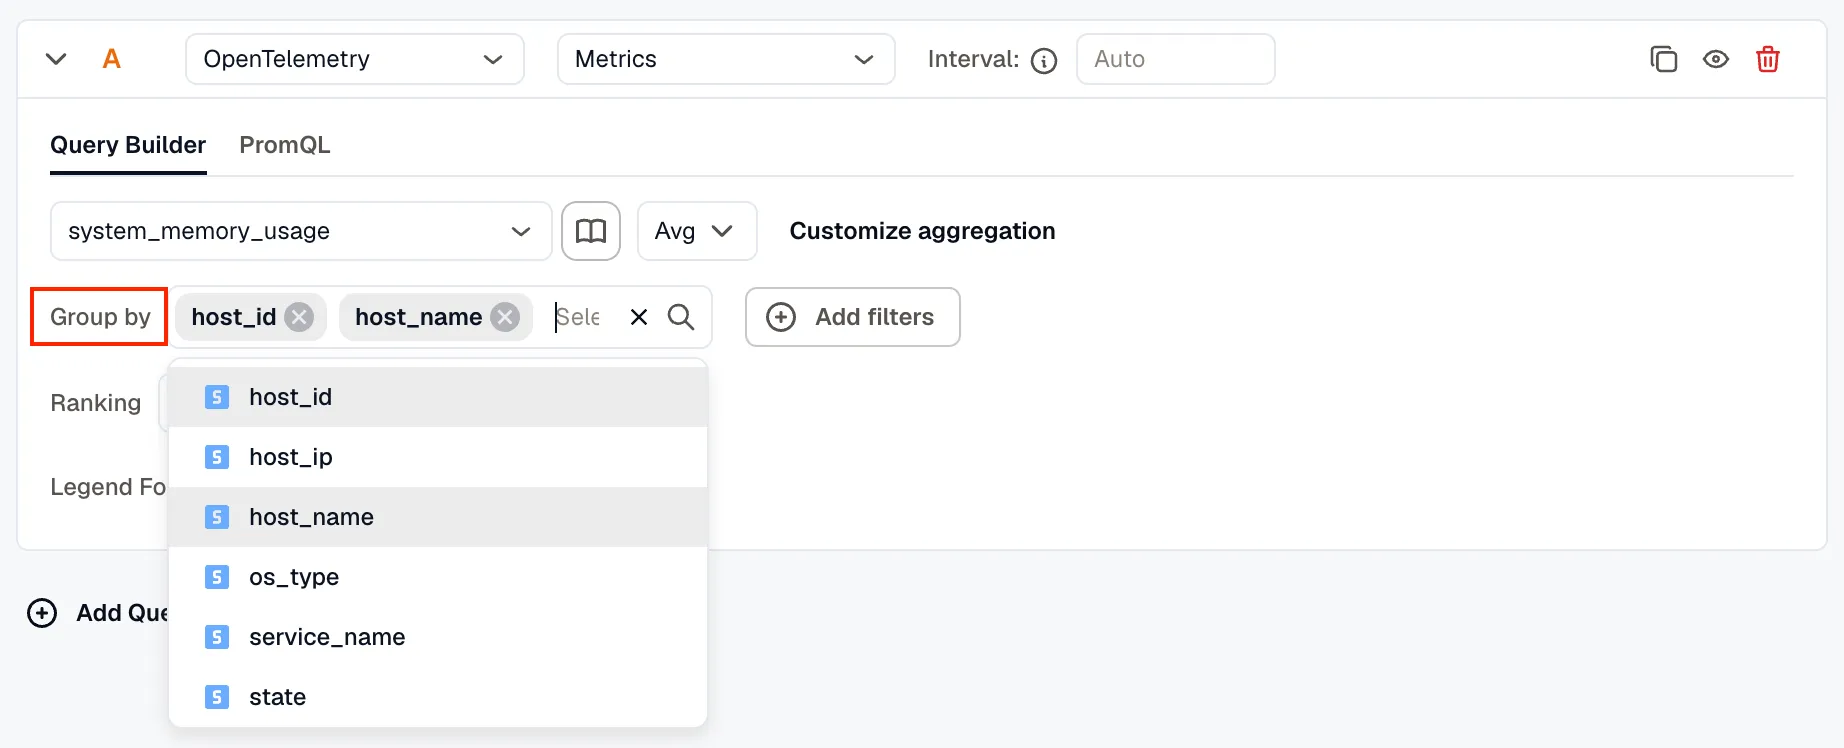
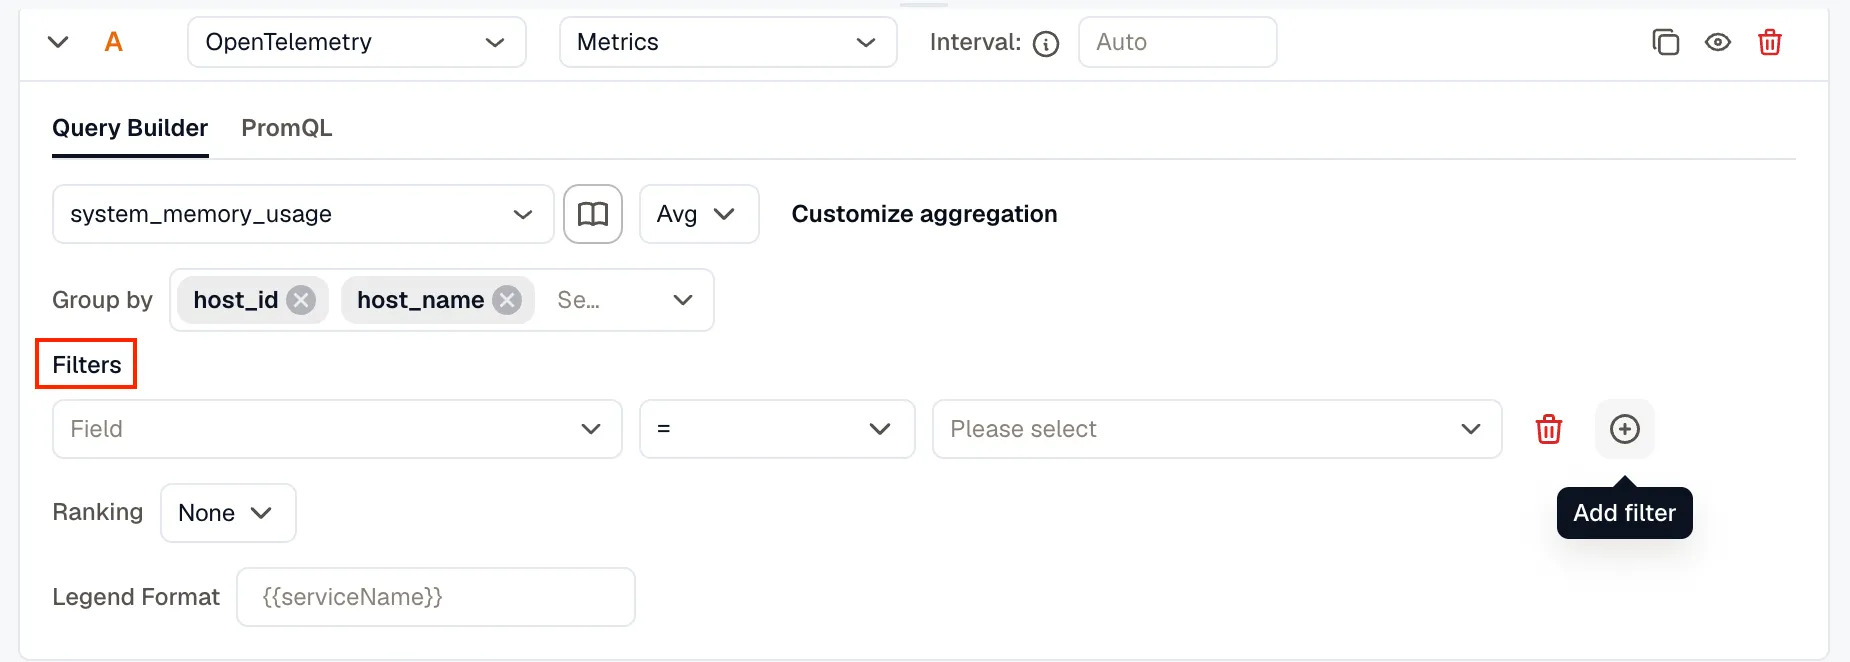
- Use Add filters to narrow the results by attributes. Each filter needs a field, an operator, and a value, for example
service_name = raspberry-pi.
- Use Ranking to control how series are ordered.

- Use Legend Format to customize series labels.
- Switch to the PromQL tab to write a raw query expression instead. Its search bar makes it easy to jump to a keyword in a long query.
-
Add Queries and Expressions Use Add Query to compare multiple metric series in one panel.
Use Add Expression to derive values from existing queries, including math, reduce, and condition expressions. See Alert Expressions for the full expression syntax.
-
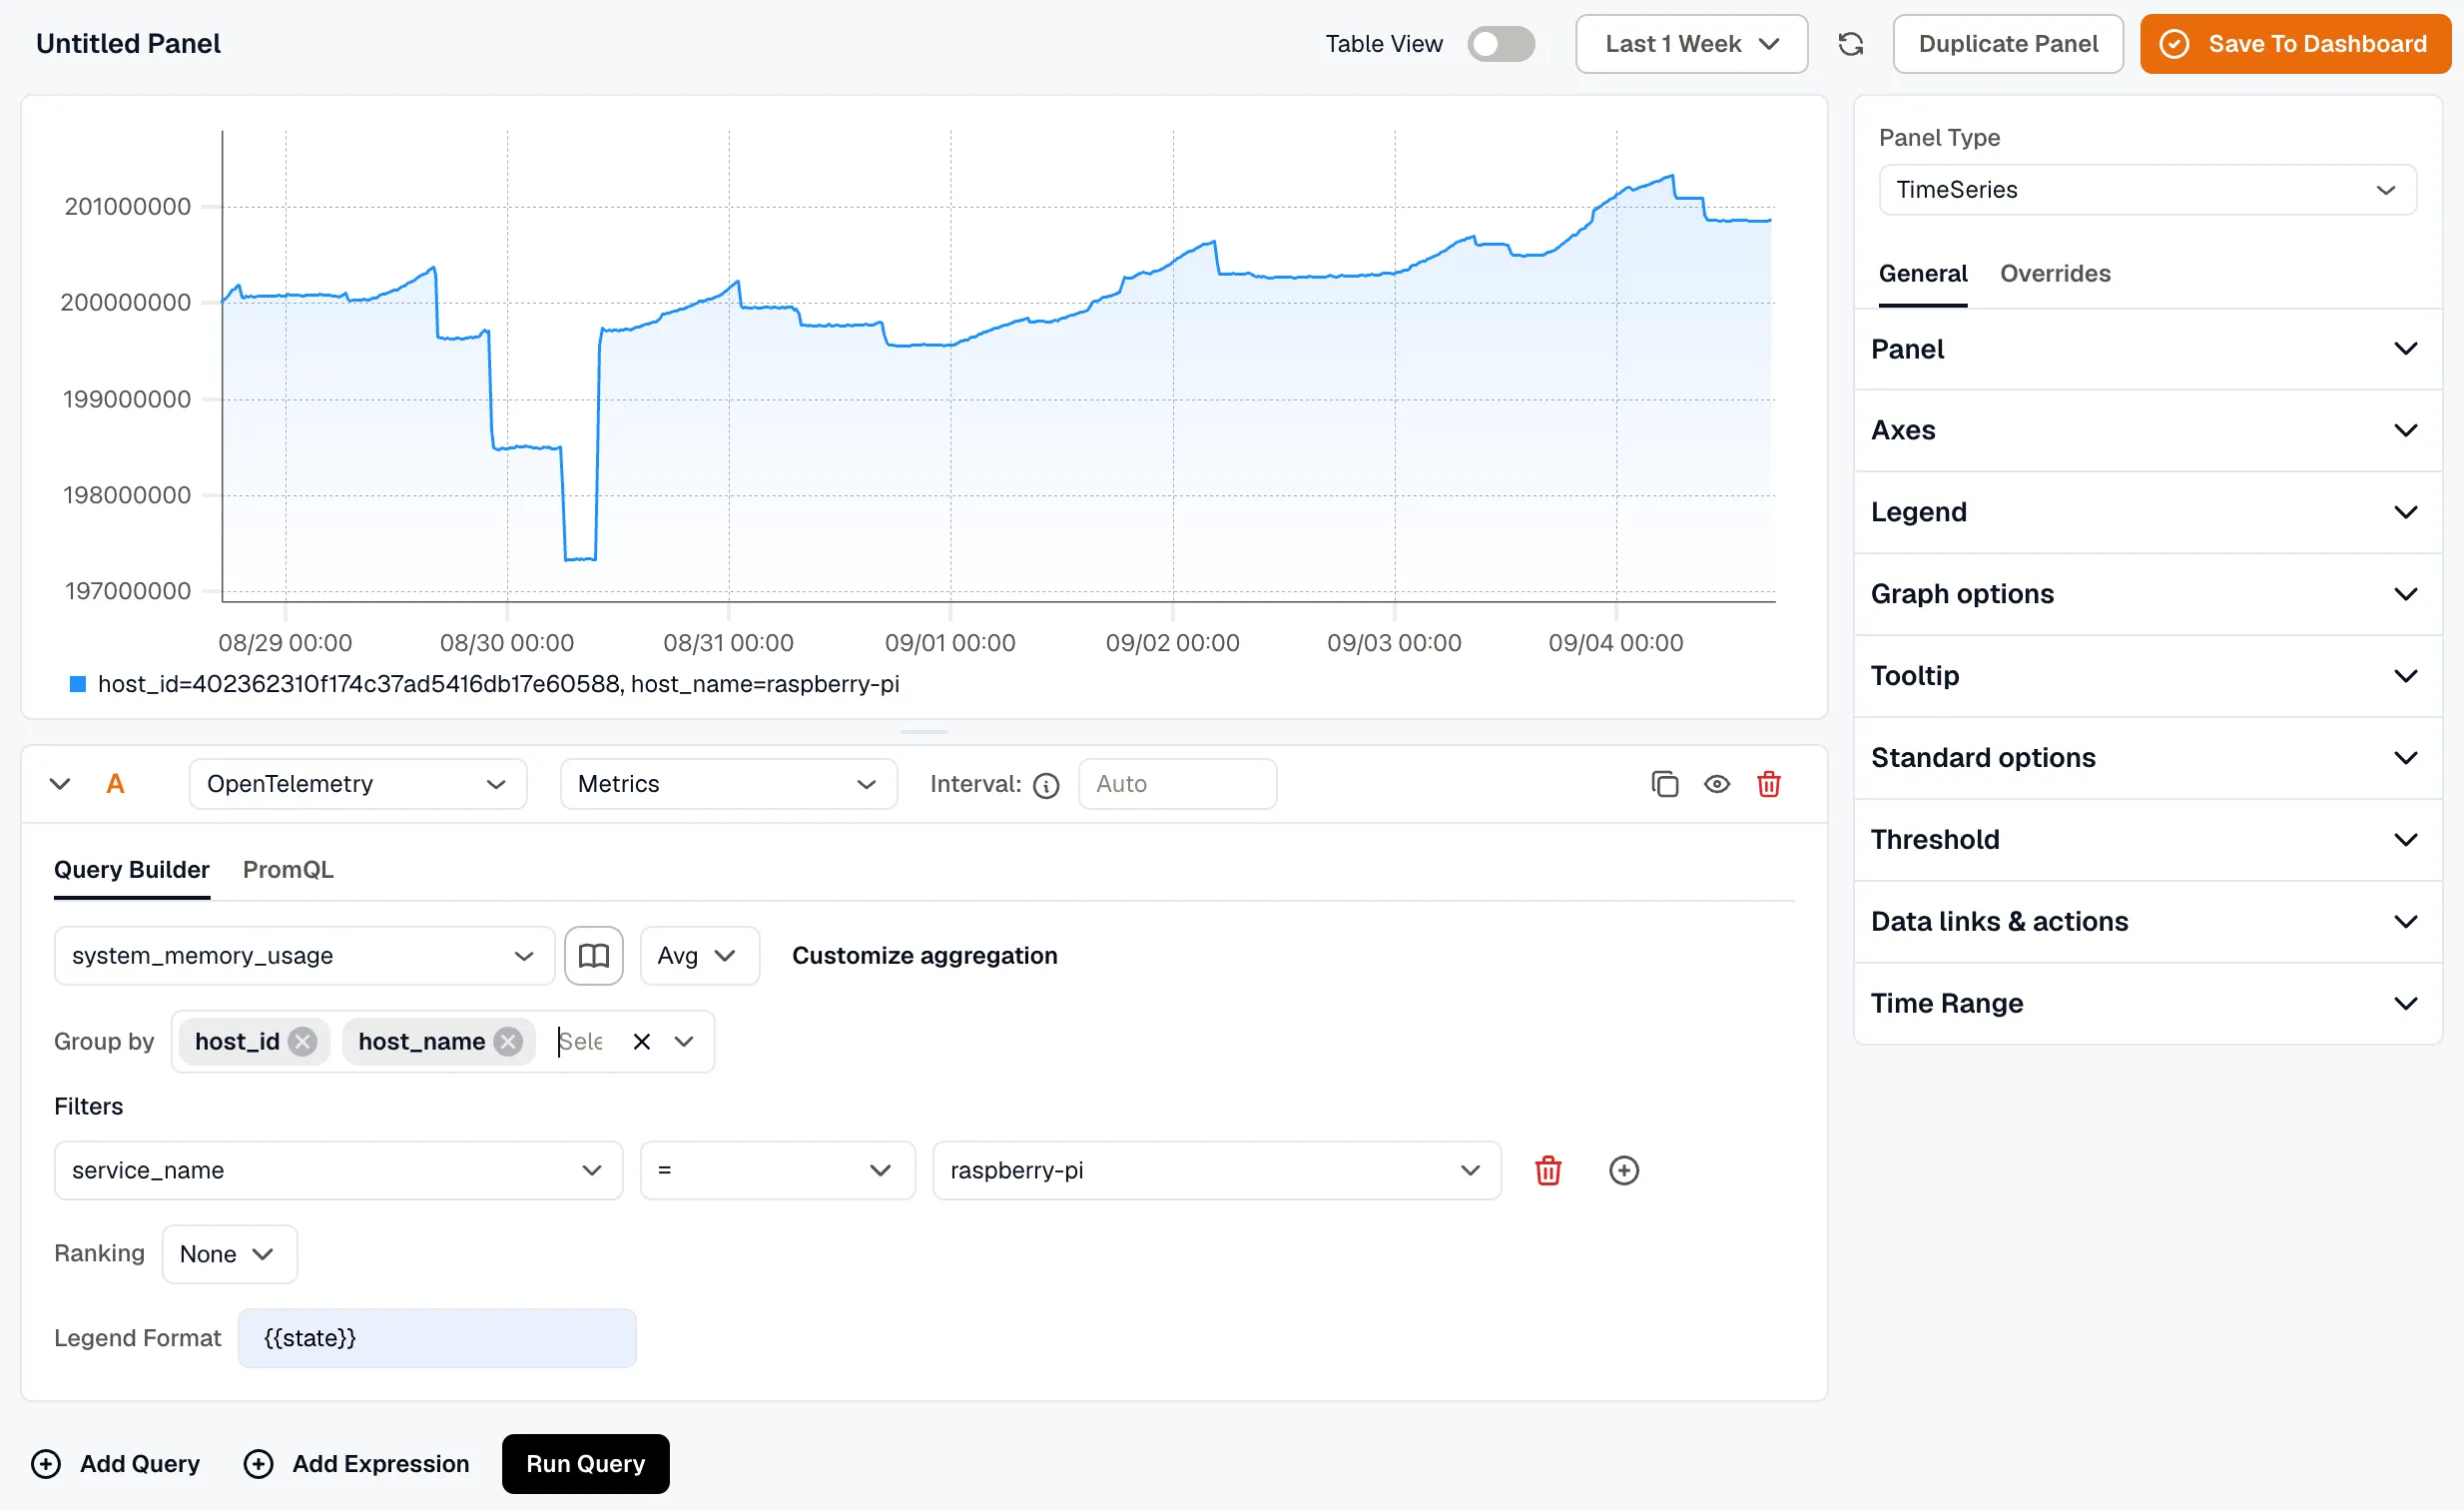
Run the Query Click Run Query to execute the query and render the result.
-
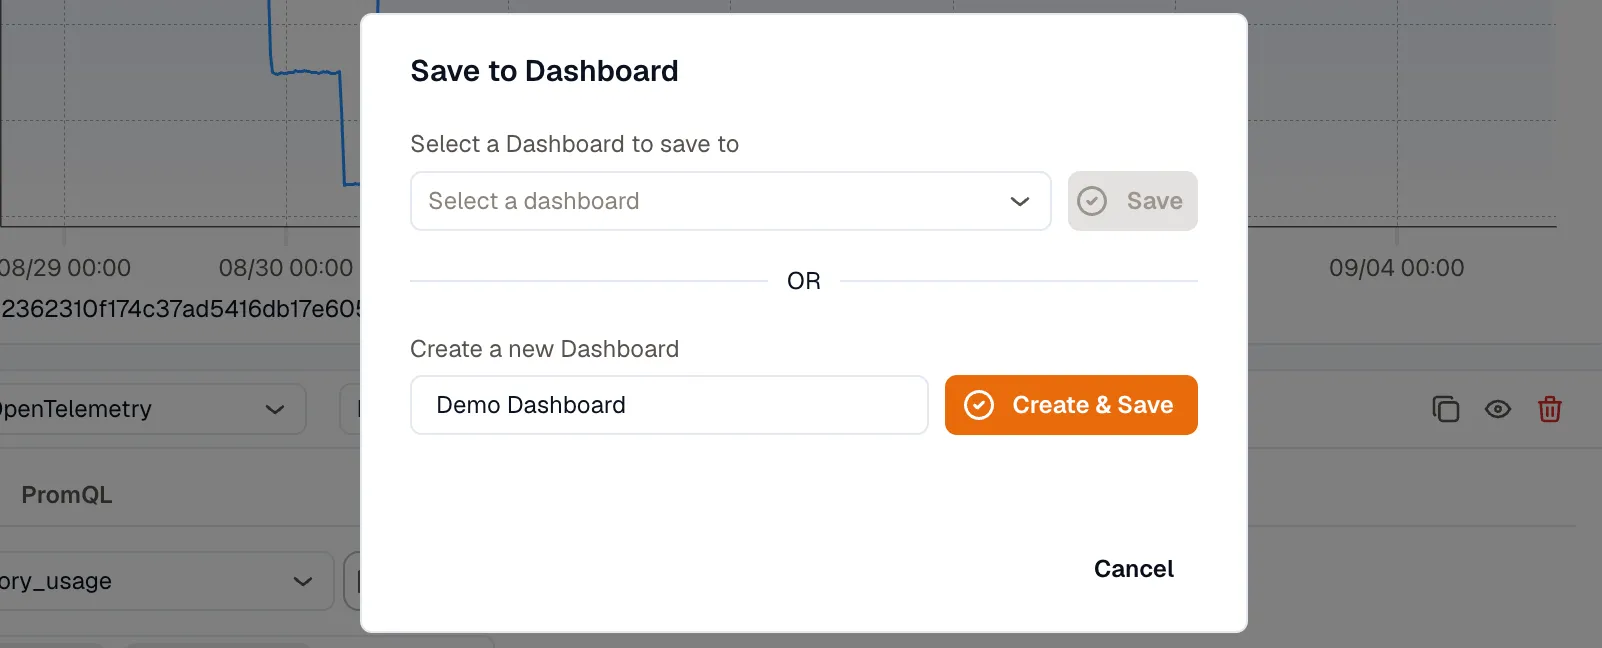
Save to a Dashboard When the query looks right, use Save to Dashboard to add the panel to an existing dashboard or create a new one.