

Profile Types
Profile Types flips the axis from All Services: instead of one type across every service, you pick one service and see every type it reports — CPU, allocated objects, allocated space, in-use objects, goroutines, and anything else its SDK collects.
Pick a service
Section titled “Pick a service”A Service dropdown sits at the top of the page. Switching it reloads the grid with that service’s own profile types — a service that only enables CPU profiling shows one card; a Go service with the full profiler config enabled might show five or six.
If nothing’s selected yet, the page shows an empty state prompting you to pick a service from All Services first.
Reading a card
Section titled “Reading a card”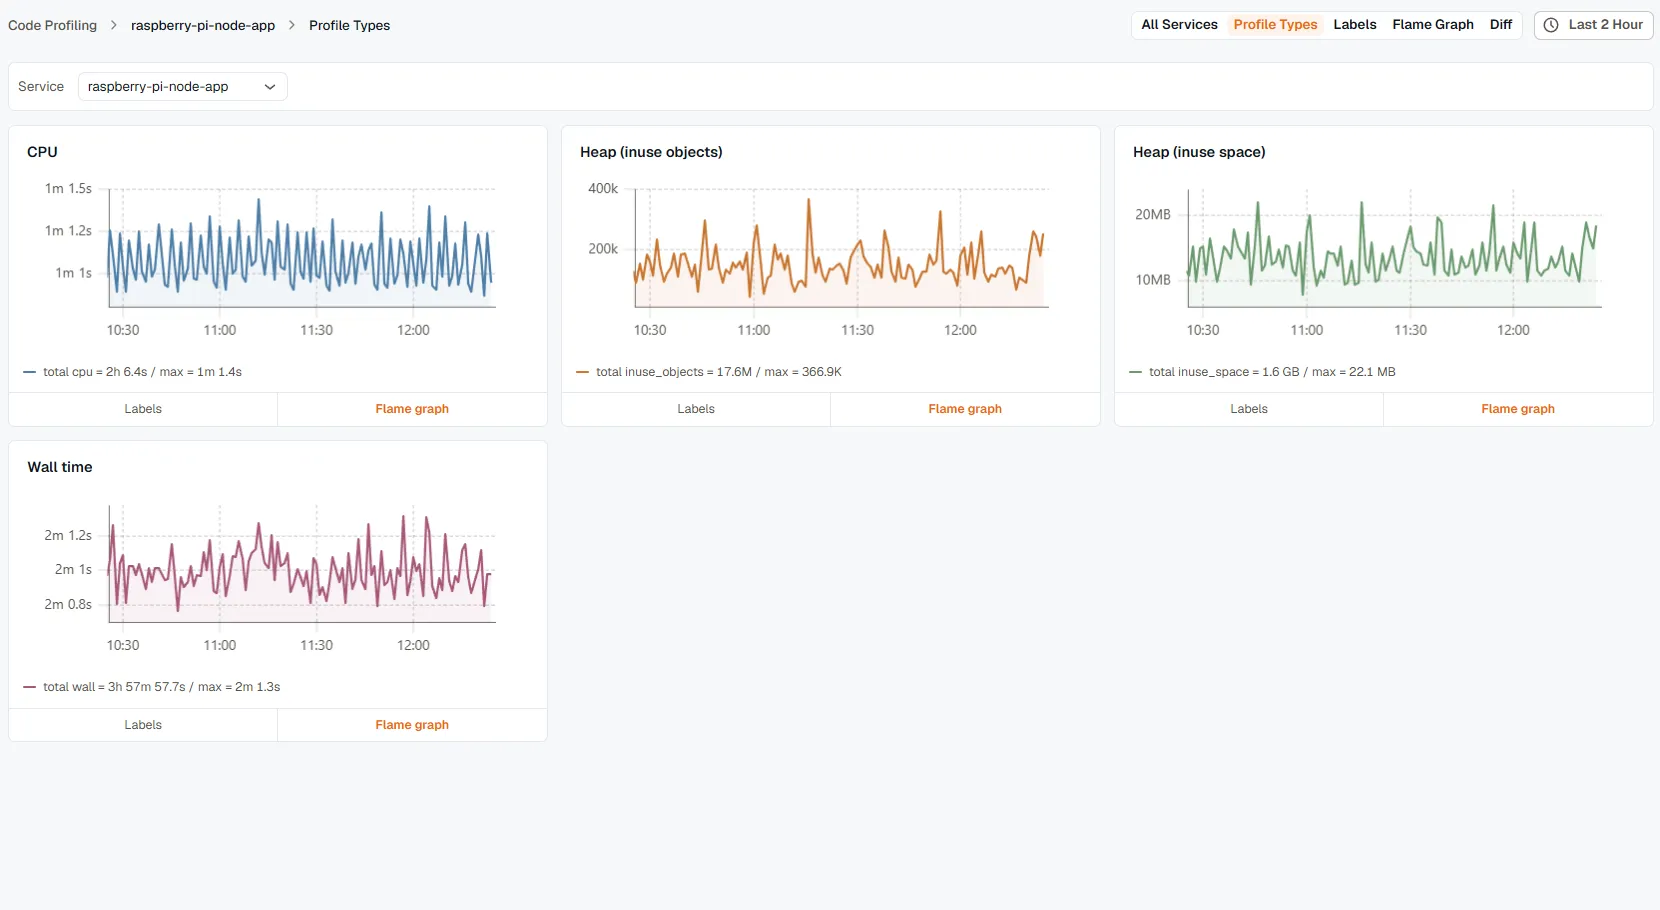
Each card is one profile type, showing its label and a mini time-series chart over the selected time range. Two links sit in the card’s footer:
- Labels — opens the Labels view for this type, so you can break it down by resource attribute.
- Flame graph — opens the Flame Graph view for this type, ready to dig into.
If a service hasn’t reported any profile types in the selected time range, the grid shows an empty state instead — widen the time range before assuming the SDK isn’t sending data.
Related
Section titled “Related”- All Services — the reverse view: one type across every service.
- Labels — break one profile type down by resource attribute.
- Flame Graph — the detail view a card’s “Flame graph” link opens.