

Labels
Labels shows every resource attribute your SDK attaches to its profiles — region, pod, version, or anything else you’ve tagged — as its own card, with a chart and a clickable list of values. It’s how you answer “is this CPU spike coming from one pod, or all of them?” without leaving the grid.
Filter the grid
Section titled “Filter the grid”At the top of the page:
- Search — filters the cards by label key.
- Service and Profile type dropdowns — same selection you’d make on Profile Types; Labels only shows data for one service and type at a time.
Once you’ve clicked a value on any card, a “N filters active” indicator and a View in Flame Graph → link appear, so you can carry your filters straight into the Flame Graph view instead of rebuilding them there.
Reading a card
Section titled “Reading a card”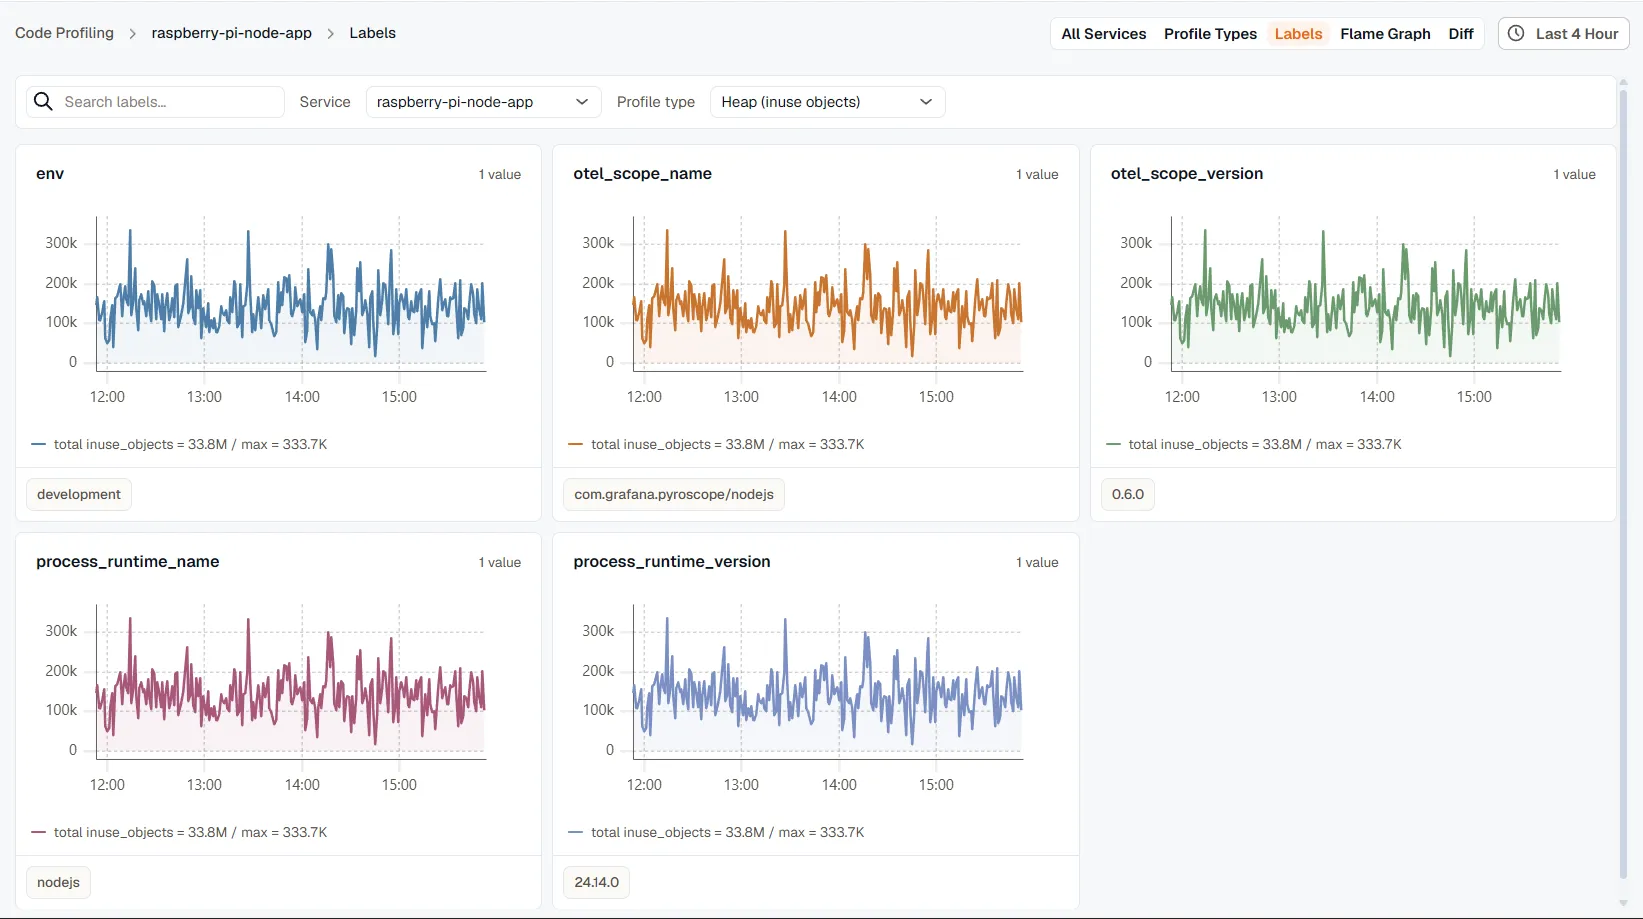
Each card is one label key. It shows a mini chart of the selected profile type, scoped to whatever filters are already active — and the chips beneath it are that label’s own values, click any one to add it as a filter.
There’s one deliberate exception: a label’s own active filter is left out of its own chart, even though it’s applied to every other card’s chart. Filter on region=us-east and every other card’s chart narrows to us-east, but the region card itself keeps showing all regions — otherwise selecting a value would collapse that one chart down to a single flat line, which defeats the point of using it to compare values.
Click a selected chip again to remove that filter.
Related
Section titled “Related”- Profile Types — pick the service and profile type Labels filters within.
- Flame Graph — where your active label filters carry over when you click View in Flame Graph.