

Availability Report
An Availability report shows how much of the report period your synthetic monitors or alert rules were up, and where the downtime came from. The Monitor type you choose when you create the report sets which view you get: Synthetic monitors or Alerts.
Synthetic monitors
Section titled “Synthetic monitors”With Monitor type set to Synthetic monitors, the report has one row per monitor. A monitor’s Availability is the share of its checks that passed. Checks that run during a maintenance window don’t count toward availability, and that time appears under Maintenance instead.
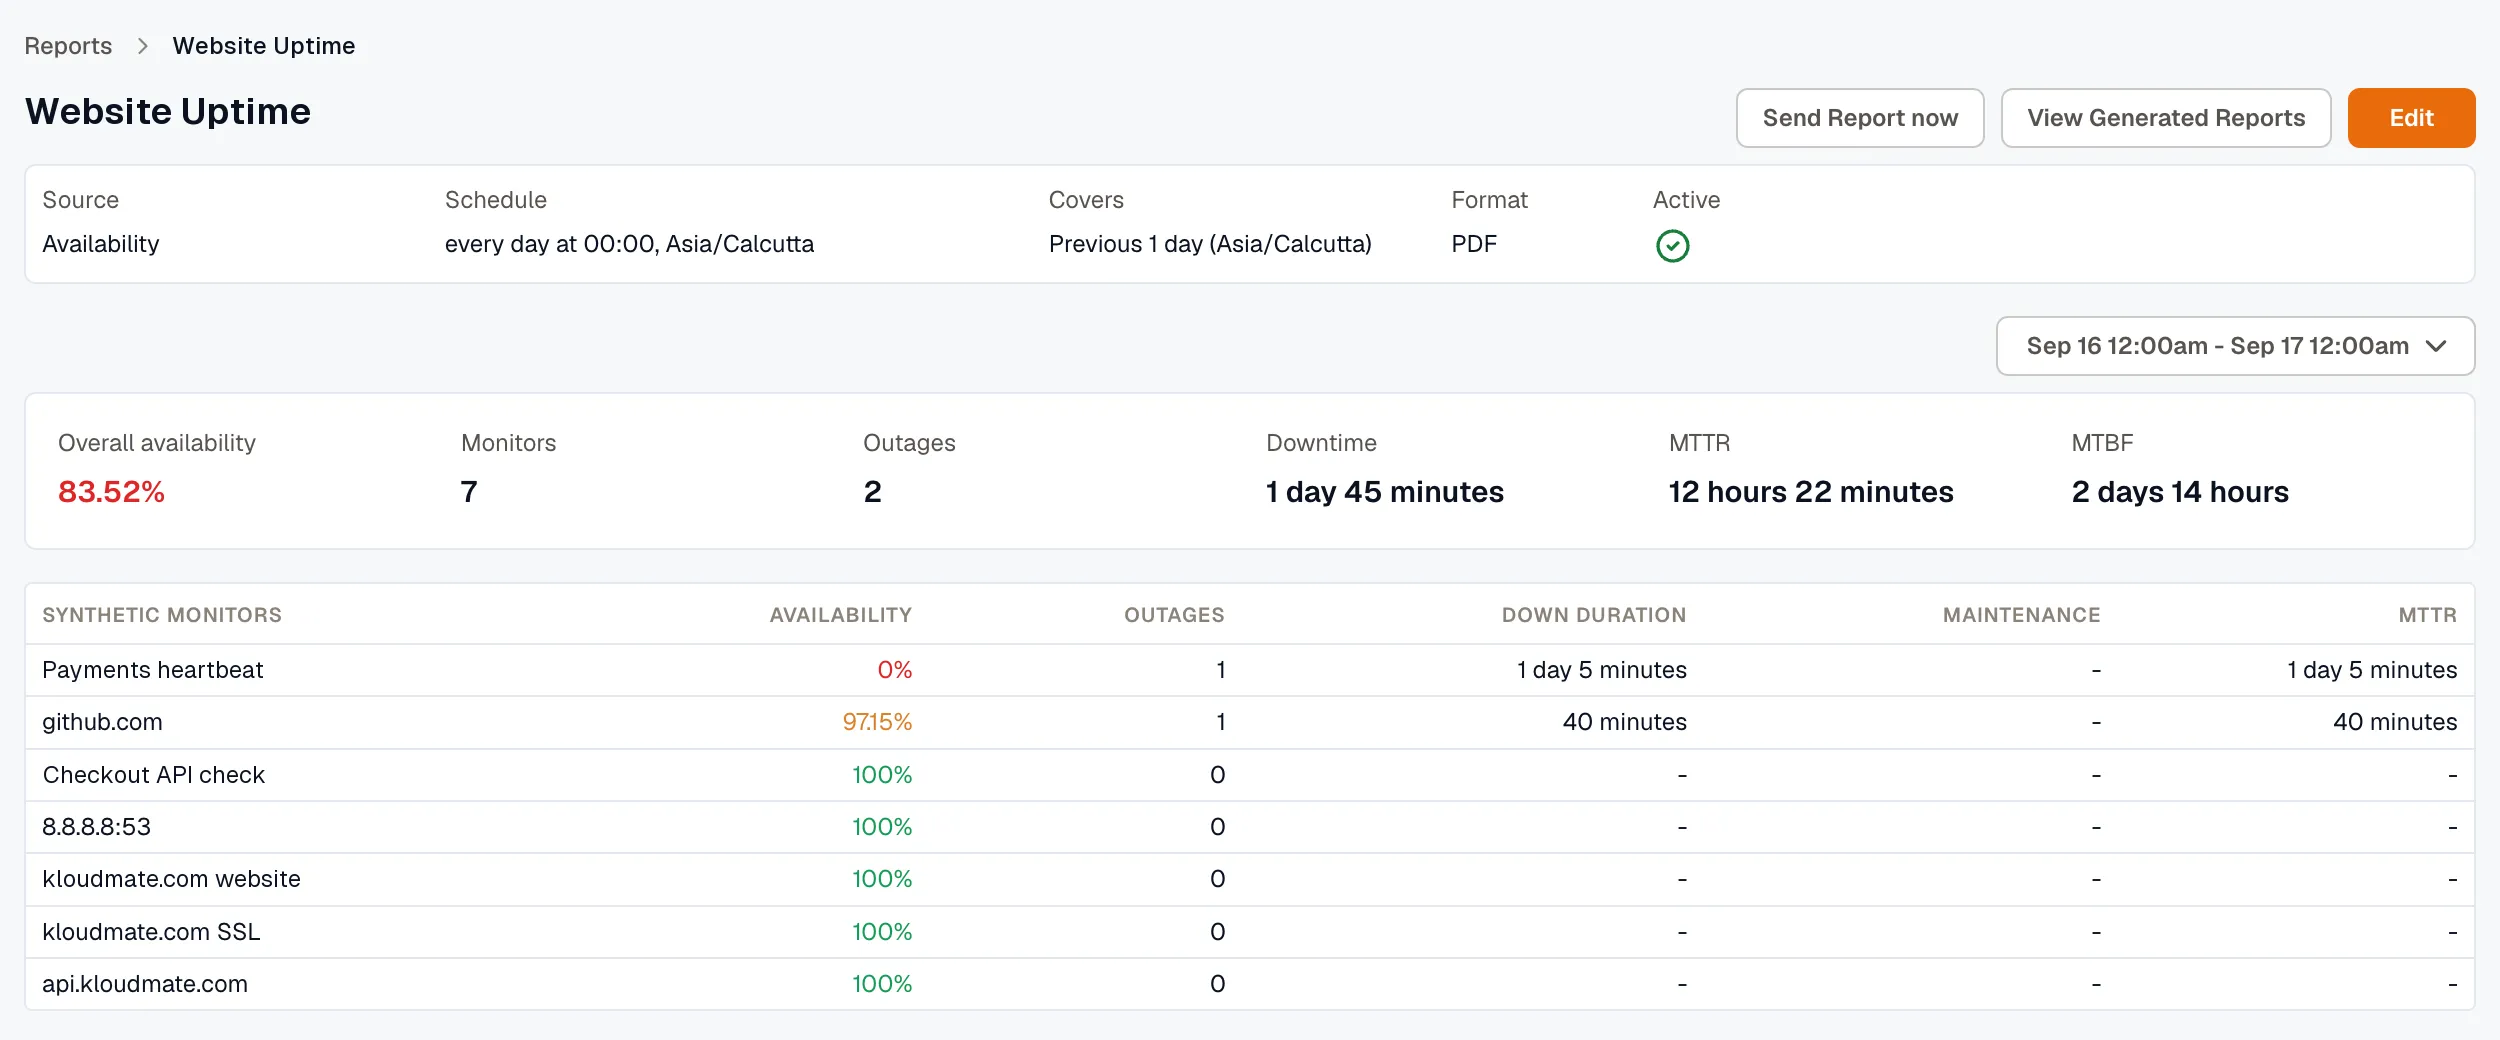
The summary combines every monitor in the report.
| Figure | What it measures |
|---|---|
| Overall availability | Up time across all monitors, divided by up time plus down time. It’s weighted by time, so it isn’t an average of the rows. |
| Monitors | The number of monitors in the report. |
| Outages | The number of times a monitor went from up to down. |
| Downtime | The down time of every monitor, added together. |
| MTTR | The average length of an outage: total down time divided by the number of outages. |
| MTBF | The average up time between outages: total up time divided by the number of outages. |
Each row shows the monitor’s Availability, Outages, Down duration, Maintenance time, and MTTR.
Alerts
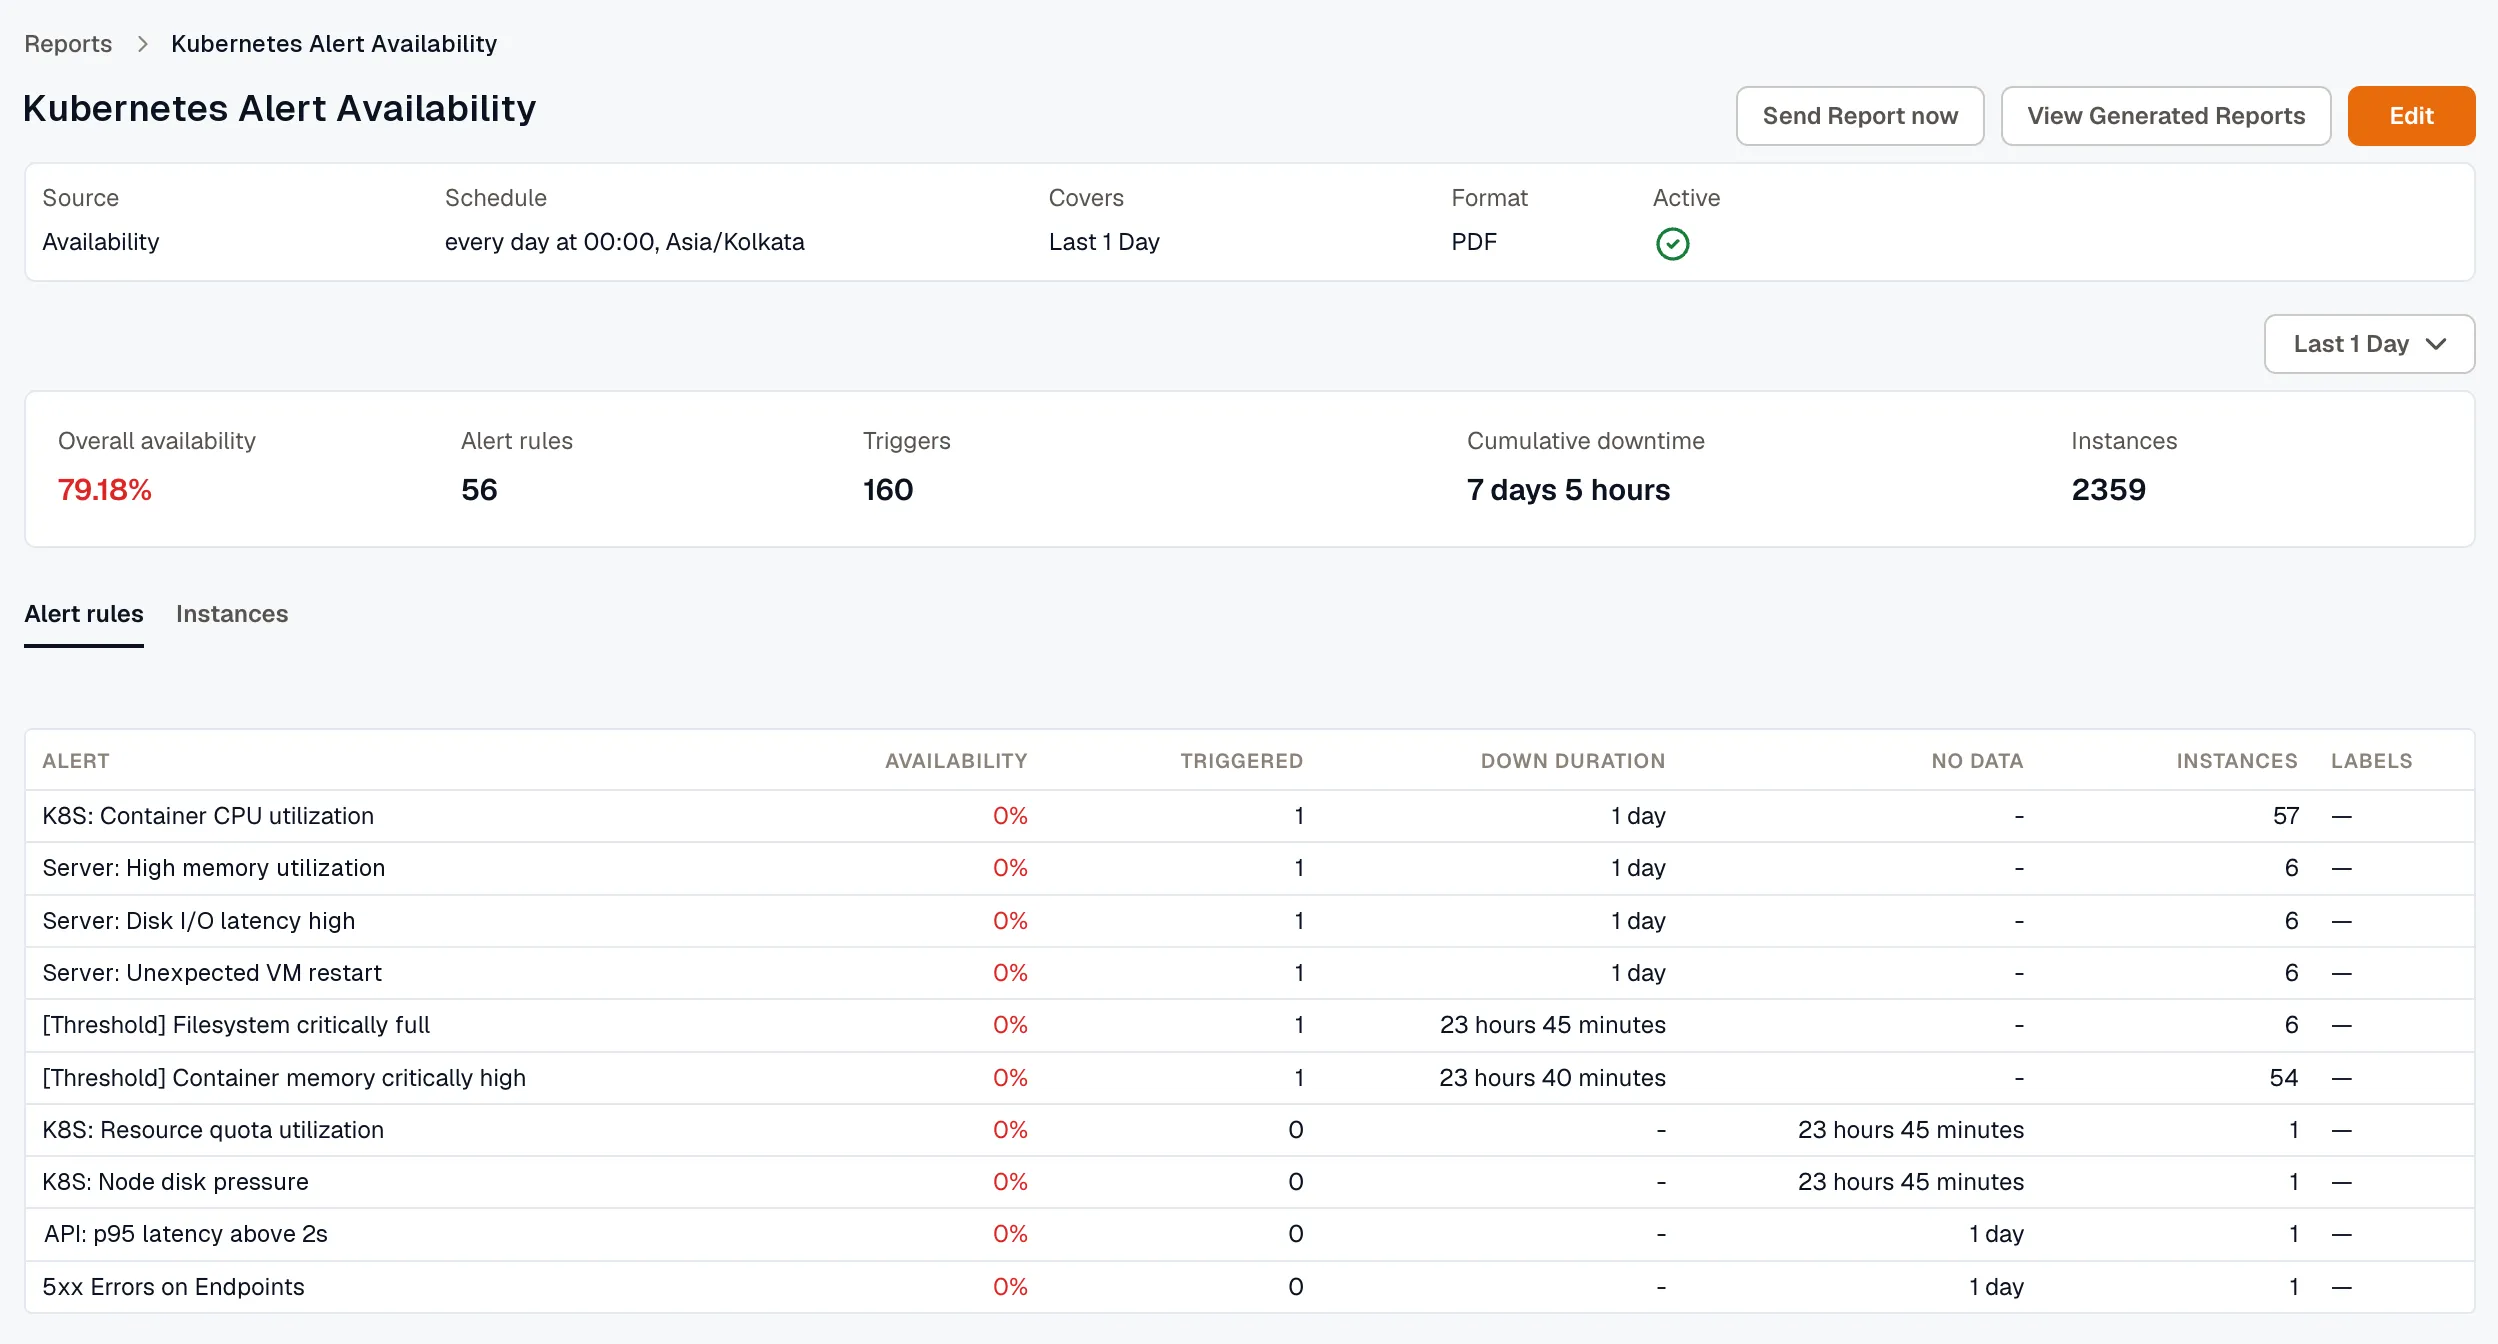
Section titled “Alerts”With Monitor type set to Alerts, the report measures availability for alert rules and for the instances they evaluate, such as each host or pod.
How the numbers are calculated
Section titled “How the numbers are calculated”- Availability is up time divided by up time, down time, and no data time. Time inside a maintenance window is left out entirely.
- No data is time an instance stopped reporting or its evaluation failed. It isn’t counted as downtime, but it still lowers availability.
- Downtime starts when the alert condition began. If an alert waits for its condition to persist before notifying, downtime starts before the notification you received.
- An alert rule is down whenever any of its instances is down. A rule’s Down duration is the clock time during which at least one instance was down, so two instances that are down during the same hour add one hour.
The summary shows Overall availability, Alert rules, Triggers, Cumulative downtime, and Instances. Cumulative downtime adds up the down duration of every rule, so if two rules are down during the same hour, that hour counts twice. Instances counts every instance the rules evaluated in the period, including healthy ones.
Alert rules tab
Section titled “Alert rules tab”The Alert rules tab has one row per rule:
- Alert: the name of the alert rule.
- Availability: how much of its monitored time the rule was up.
- Triggered: the number of times the rule went from up to down.
- Down duration: the clock time during which at least one of the rule’s instances was down.
- No data: the time none of the rule’s instances had data.
- Instances: the number of instances the rule evaluated.
- Labels: the labels on the rule, if any.
Instances tab
Section titled “Instances tab”The Instances tab has one row per instance, so you can see which host or pod caused a rule’s downtime. Availability, Triggered, Down duration, and No data are measured for that instance alone.
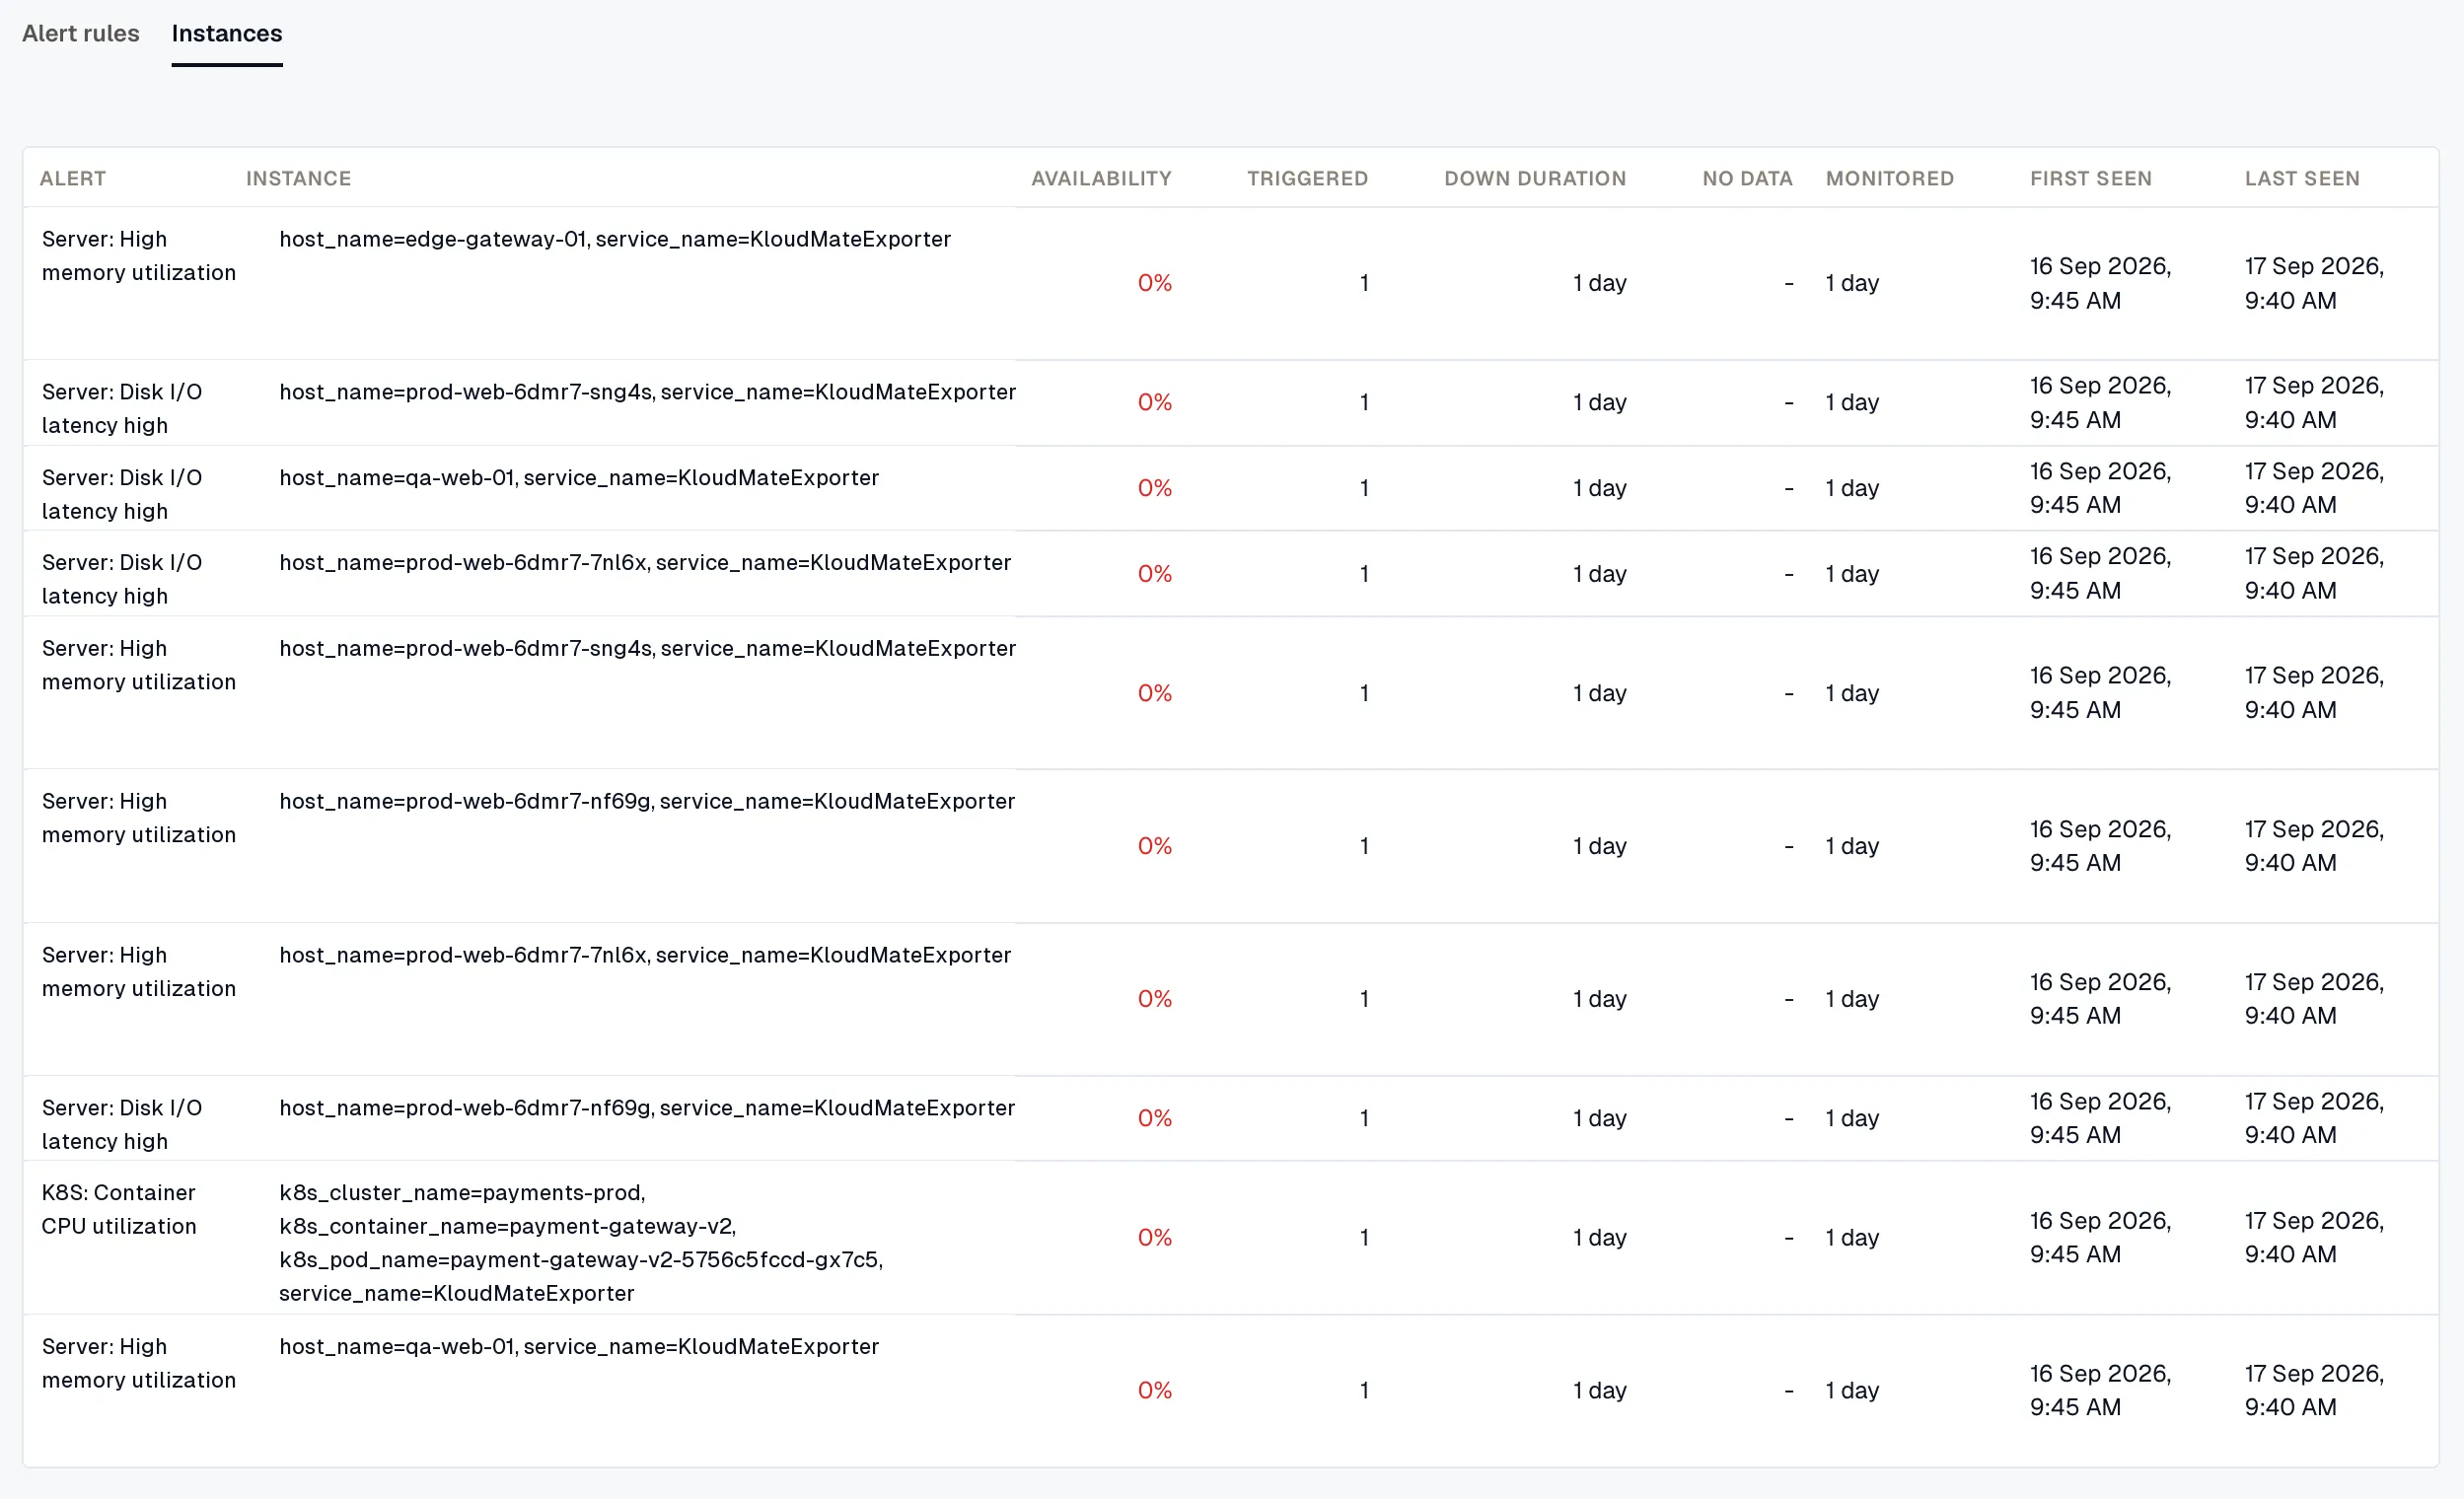
- Instance: the labels that identify the instance, such as
host=vm1, pod=api. - Monitored: how much of the period the instance had data. If an instance was added or removed partway through the period, its availability covers only the time it was monitored. An instance at 100% with a short Monitored time was healthy while it ran, not for the whole period.
- First seen and Last seen: the first and last time the instance reported during the period.
When a report matches more instances than it can list, it keeps the instances with the most downtime.
PDF and XLSX files
Section titled “PDF and XLSX files”The PDF lists alert rules only. The XLSX adds an Alert Instances sheet with a row for each instance.
To send the report outside its schedule or download earlier files, see Send a report now and Download generated reports.