SLO Compliance report
The SLO Compliance report is a source on the Reports module. It produces one row per enabled SLO with its latest compliance snapshot, error budget, and burn-rate-alert state.
The source has no additional configuration — it’s a workspace-wide rollup of every enabled SLO. No filters, no per-SLO toggles. For a narrower view, filter the export afterward.
Create an SLO Compliance report
Section titled “Create an SLO Compliance report”- Open Settings → Reports → Create Report.
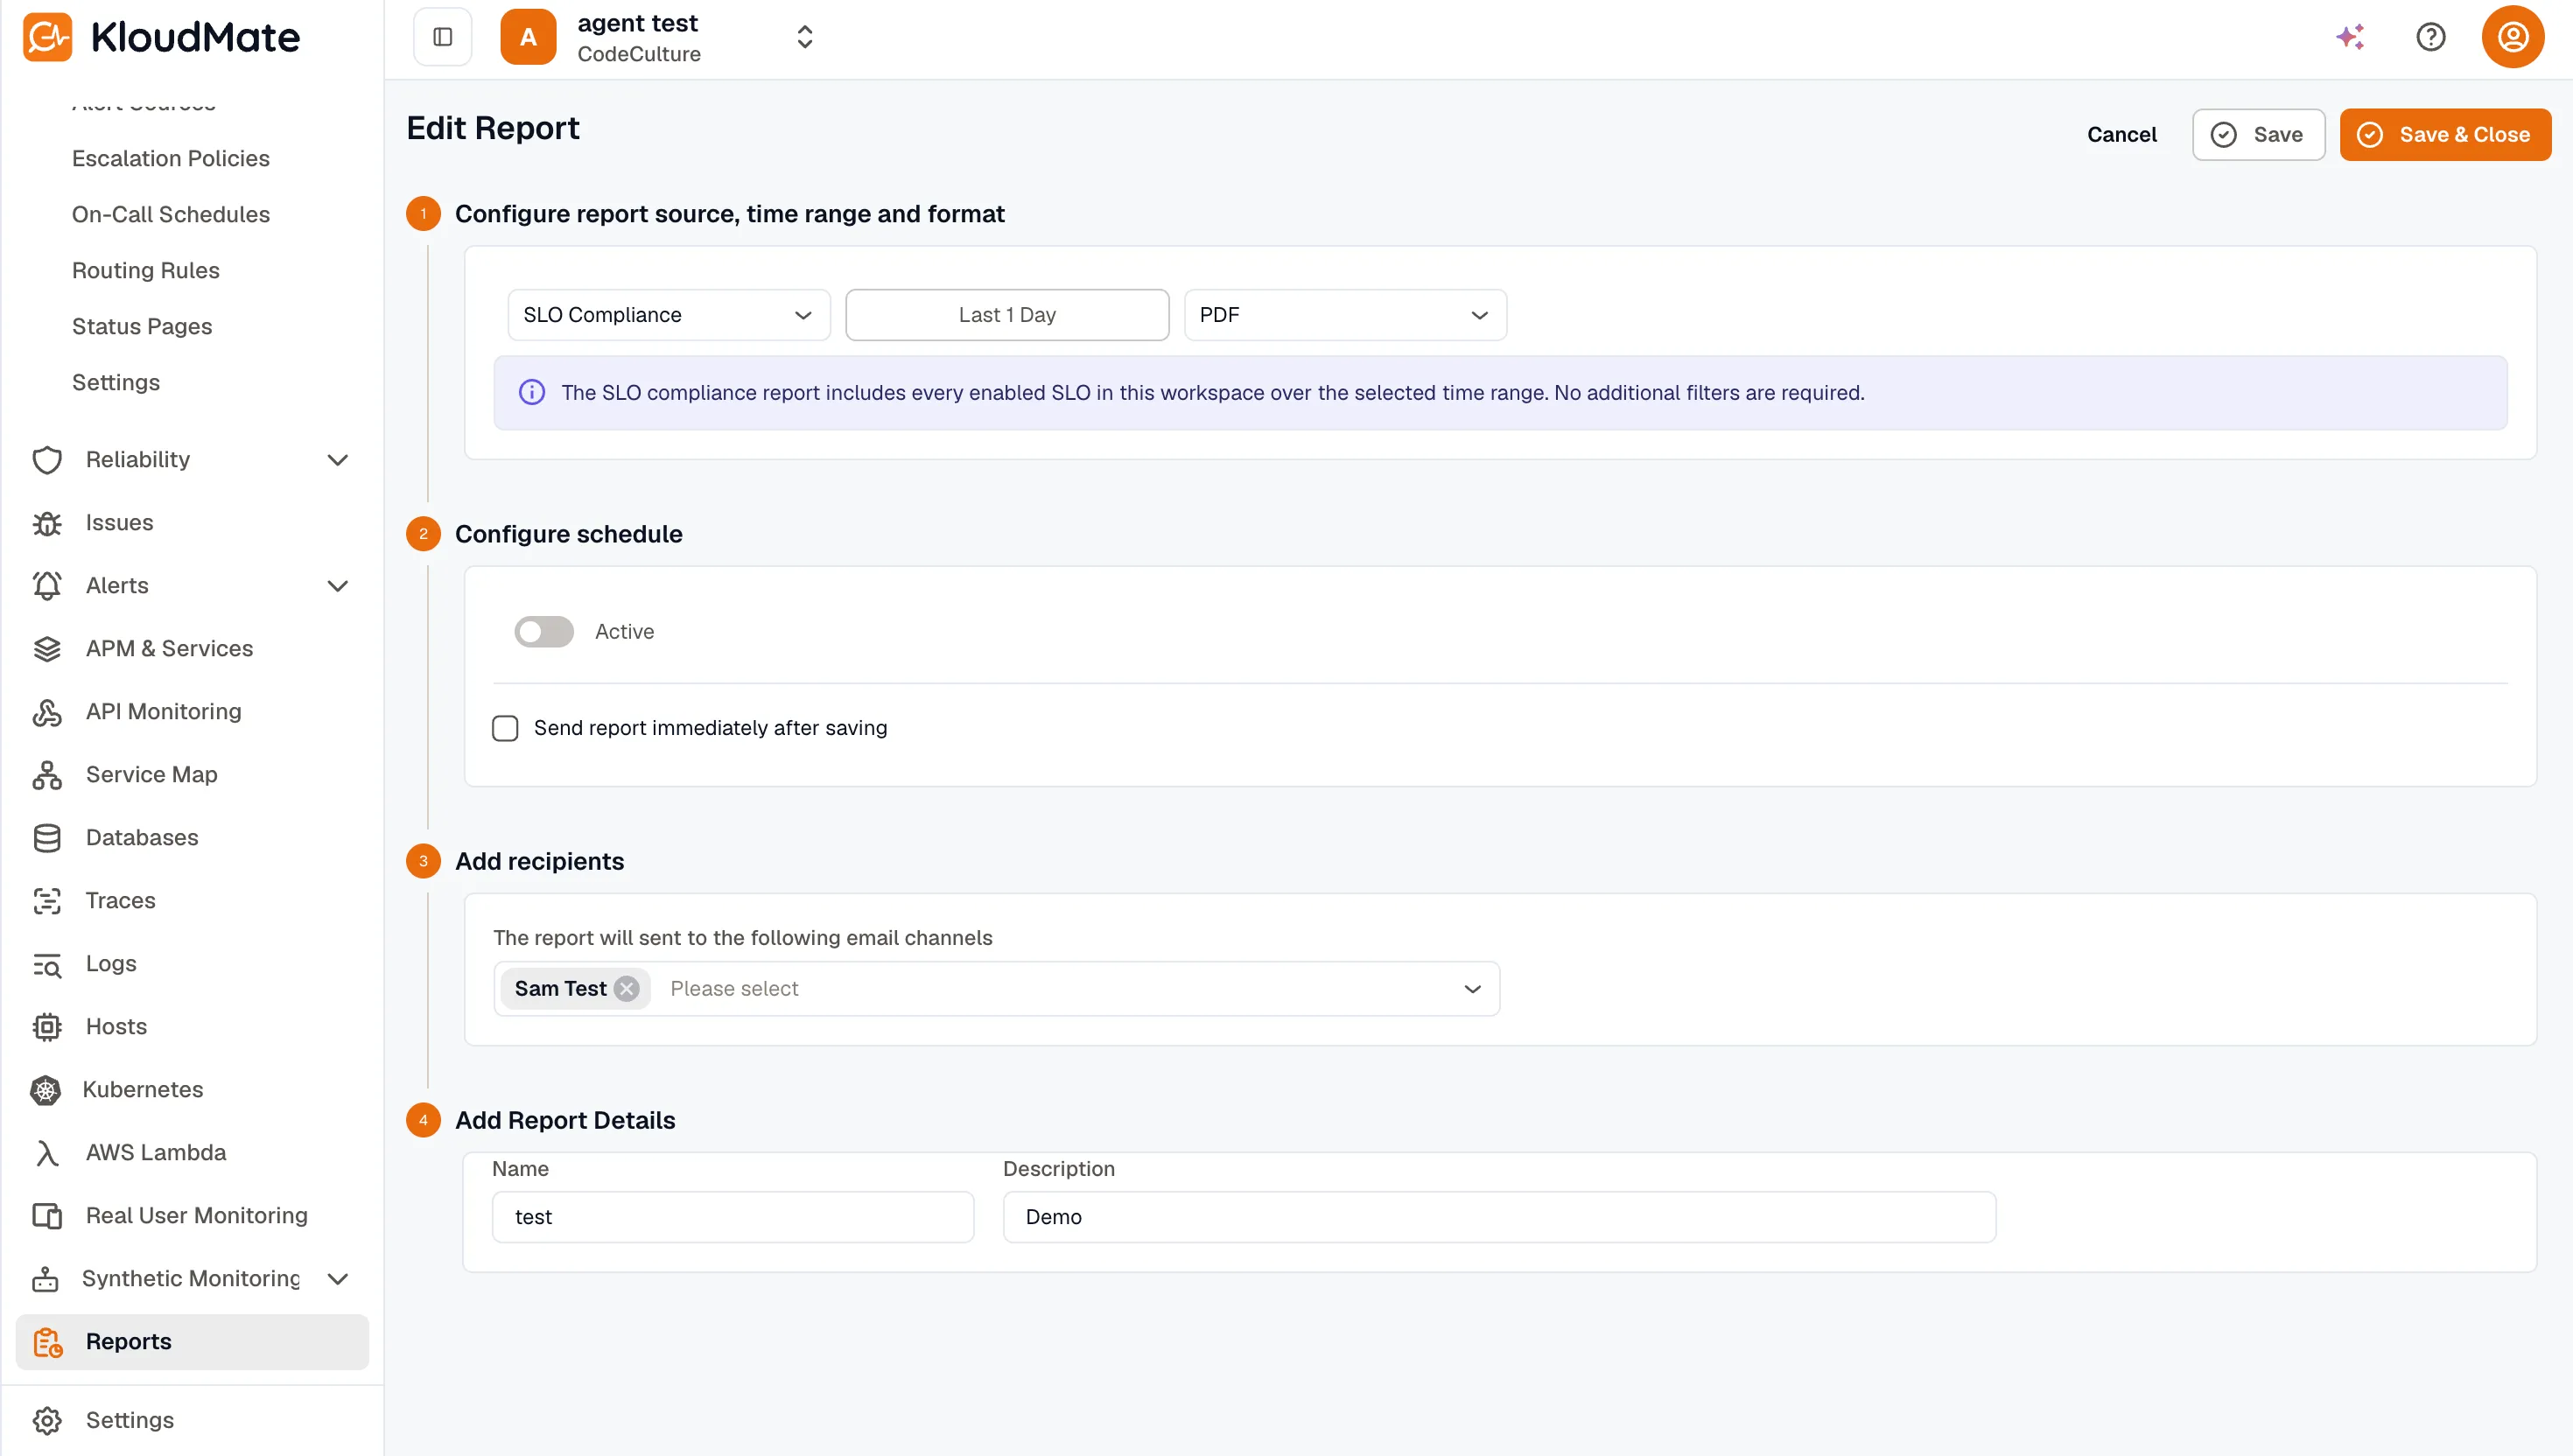
- In the Report Type picker, select SLO Compliance.
- An info banner explains: e.g. “Workspace-wide rollup: includes every enabled SLO over the selected time range. No additional filters are required.”
- Pick a Time Range, Report Format (PDF or XLSX), Schedule (Fixed or Recurring), and Recipients — same as other report sources. See Create Report for the full walk-through.
- Click Save.
Discovery entry point
Section titled “Discovery entry point”You can also reach this flow from the Reliability Overview hub — the Quick-start → Build a compliance report card deep-links into the report builder with SLO Compliance pre-selected. This means users don’t need to navigate to Reports separately to set this up.
What the report contains
Section titled “What the report contains”For every enabled SLO in the workspace, the export has one row with:
- Service — only for Incident availability SLOs (resolved from the SLI); blank for the workspace-level kinds.
- SLO name.
- SLI kind.
- Window — the SLO’s default window.
- Target %.
- Compliance % — from the SLO’s latest cached snapshot for its default window.
- Error budget — remaining at that snapshot, in the SLI’s unit (a duration or an event count). A negative value means breached.
- Burn-rate alert — the worst current burn-rate-alert state on the SLO (e.g. Firing for 2.0h, configured, or —).
- Status —
OK,BREACHED, orno snapshot yetfor a newly-created SLO before its first evaluation.
Related
Section titled “Related”- Reports — Create Report — the surrounding report flow.
- SLO detail — for ad-hoc, single-SLO views.
- Reliability Overview — the deep-link entry point.