

Introduction to OpenLLMetry
LLM applications are built from model calls, tool calls, and framework glue, and their behavior shifts with every prompt. To debug and tune them, you need the same tracing you’d use for any distributed system, adapted to capture model-specific details like prompts, token usage, and tool calls.
OpenTelemetry is the open standard for that tracing. OpenLLMetry extends it to the LLM layer.
What is OpenLLMetry?
Section titled “What is OpenLLMetry?”OpenLLMetry is an open-source SDK from Traceloop that adds LLM instrumentation to OpenTelemetry. It’s Apache-2.0 licensed and built on the same protocols OpenTelemetry uses, so the traces it produces flow to any OpenTelemetry backend, including KloudMate.
Because it builds on OpenTelemetry, you don’t run a separate pipeline for AI telemetry. Model and tool spans sit in the same traces as your HTTP, database, and queue spans.
How it works
Section titled “How it works”OpenLLMetry ships instrumentations for the common pieces of an LLM stack:
- Providers such as OpenAI, Anthropic, and Cohere.
- Frameworks such as LangChain and LlamaIndex.
- Vector databases such as Pinecone and Chroma.
When you initialize the SDK, it patches these libraries so each model call, tool call, and chain step emits a span, with attributes for the prompt, response, model, and token usage. Your application logic stays the same; you add the SDK and point it at your backend.
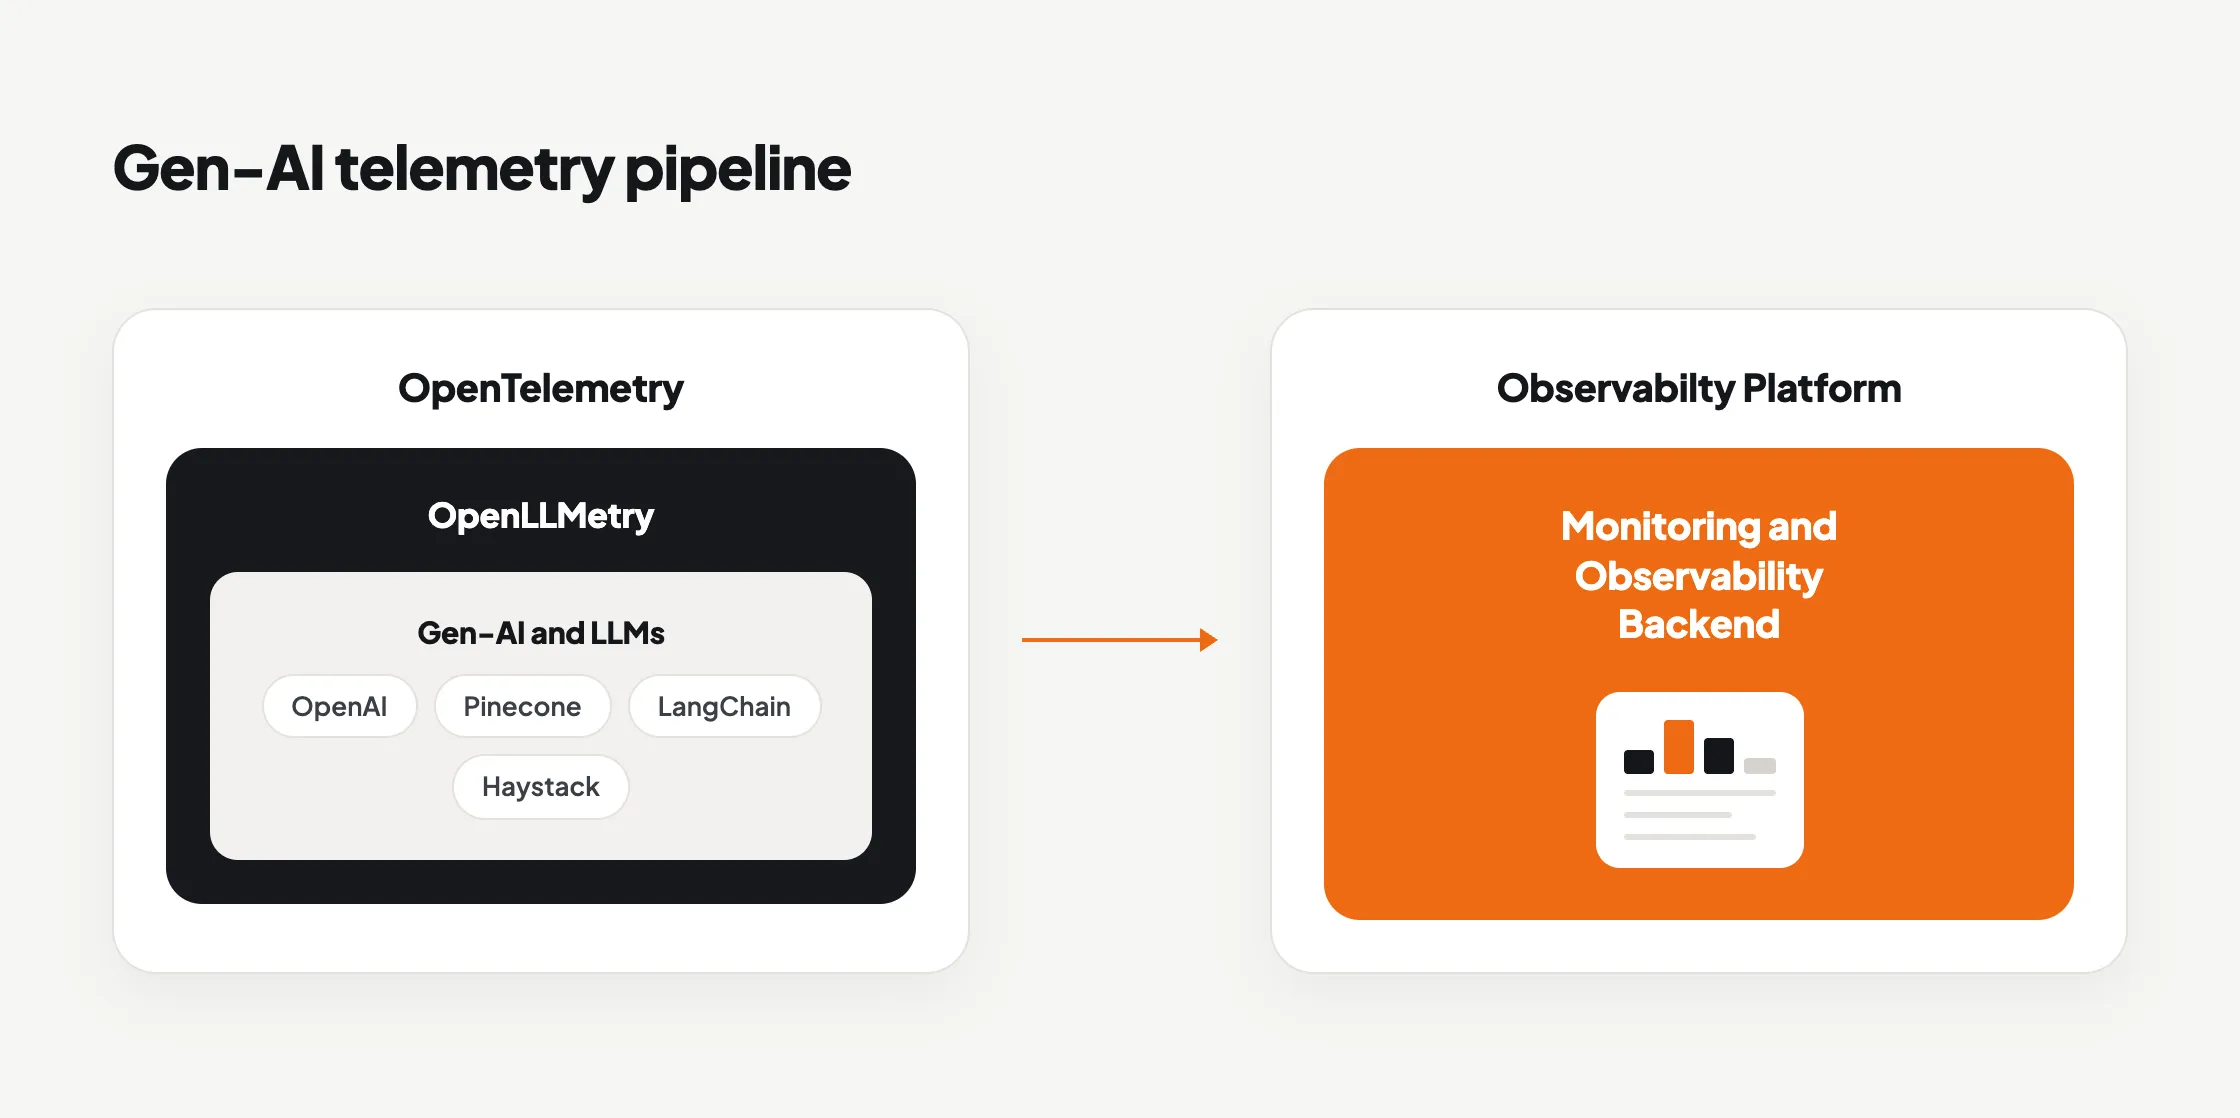
The SDK exports over OTLP, the OpenTelemetry wire protocol, so sending data to KloudMate comes down to setting the endpoint and your API key.