AI Trace Observability
When a trace contains GenAI spans, KloudMate adds AI-specific views on top of the normal trace detail. You get a summary of the run, the full conversation behind each model call, token and tool details, and a graph of the agent’s steps — without digging through raw span attributes.
To get there, open Traces, find a trace from your LLM service, and open it. The sections below describe what you’ll see.
AI summary
Section titled “AI summary”At the top of an AI trace, the AI summary gives you the shape of the run at a glance: the models used, how many model and tool calls ran, total tokens (with cached input called out), the time split between model and tool calls, and how many AI spans errored.
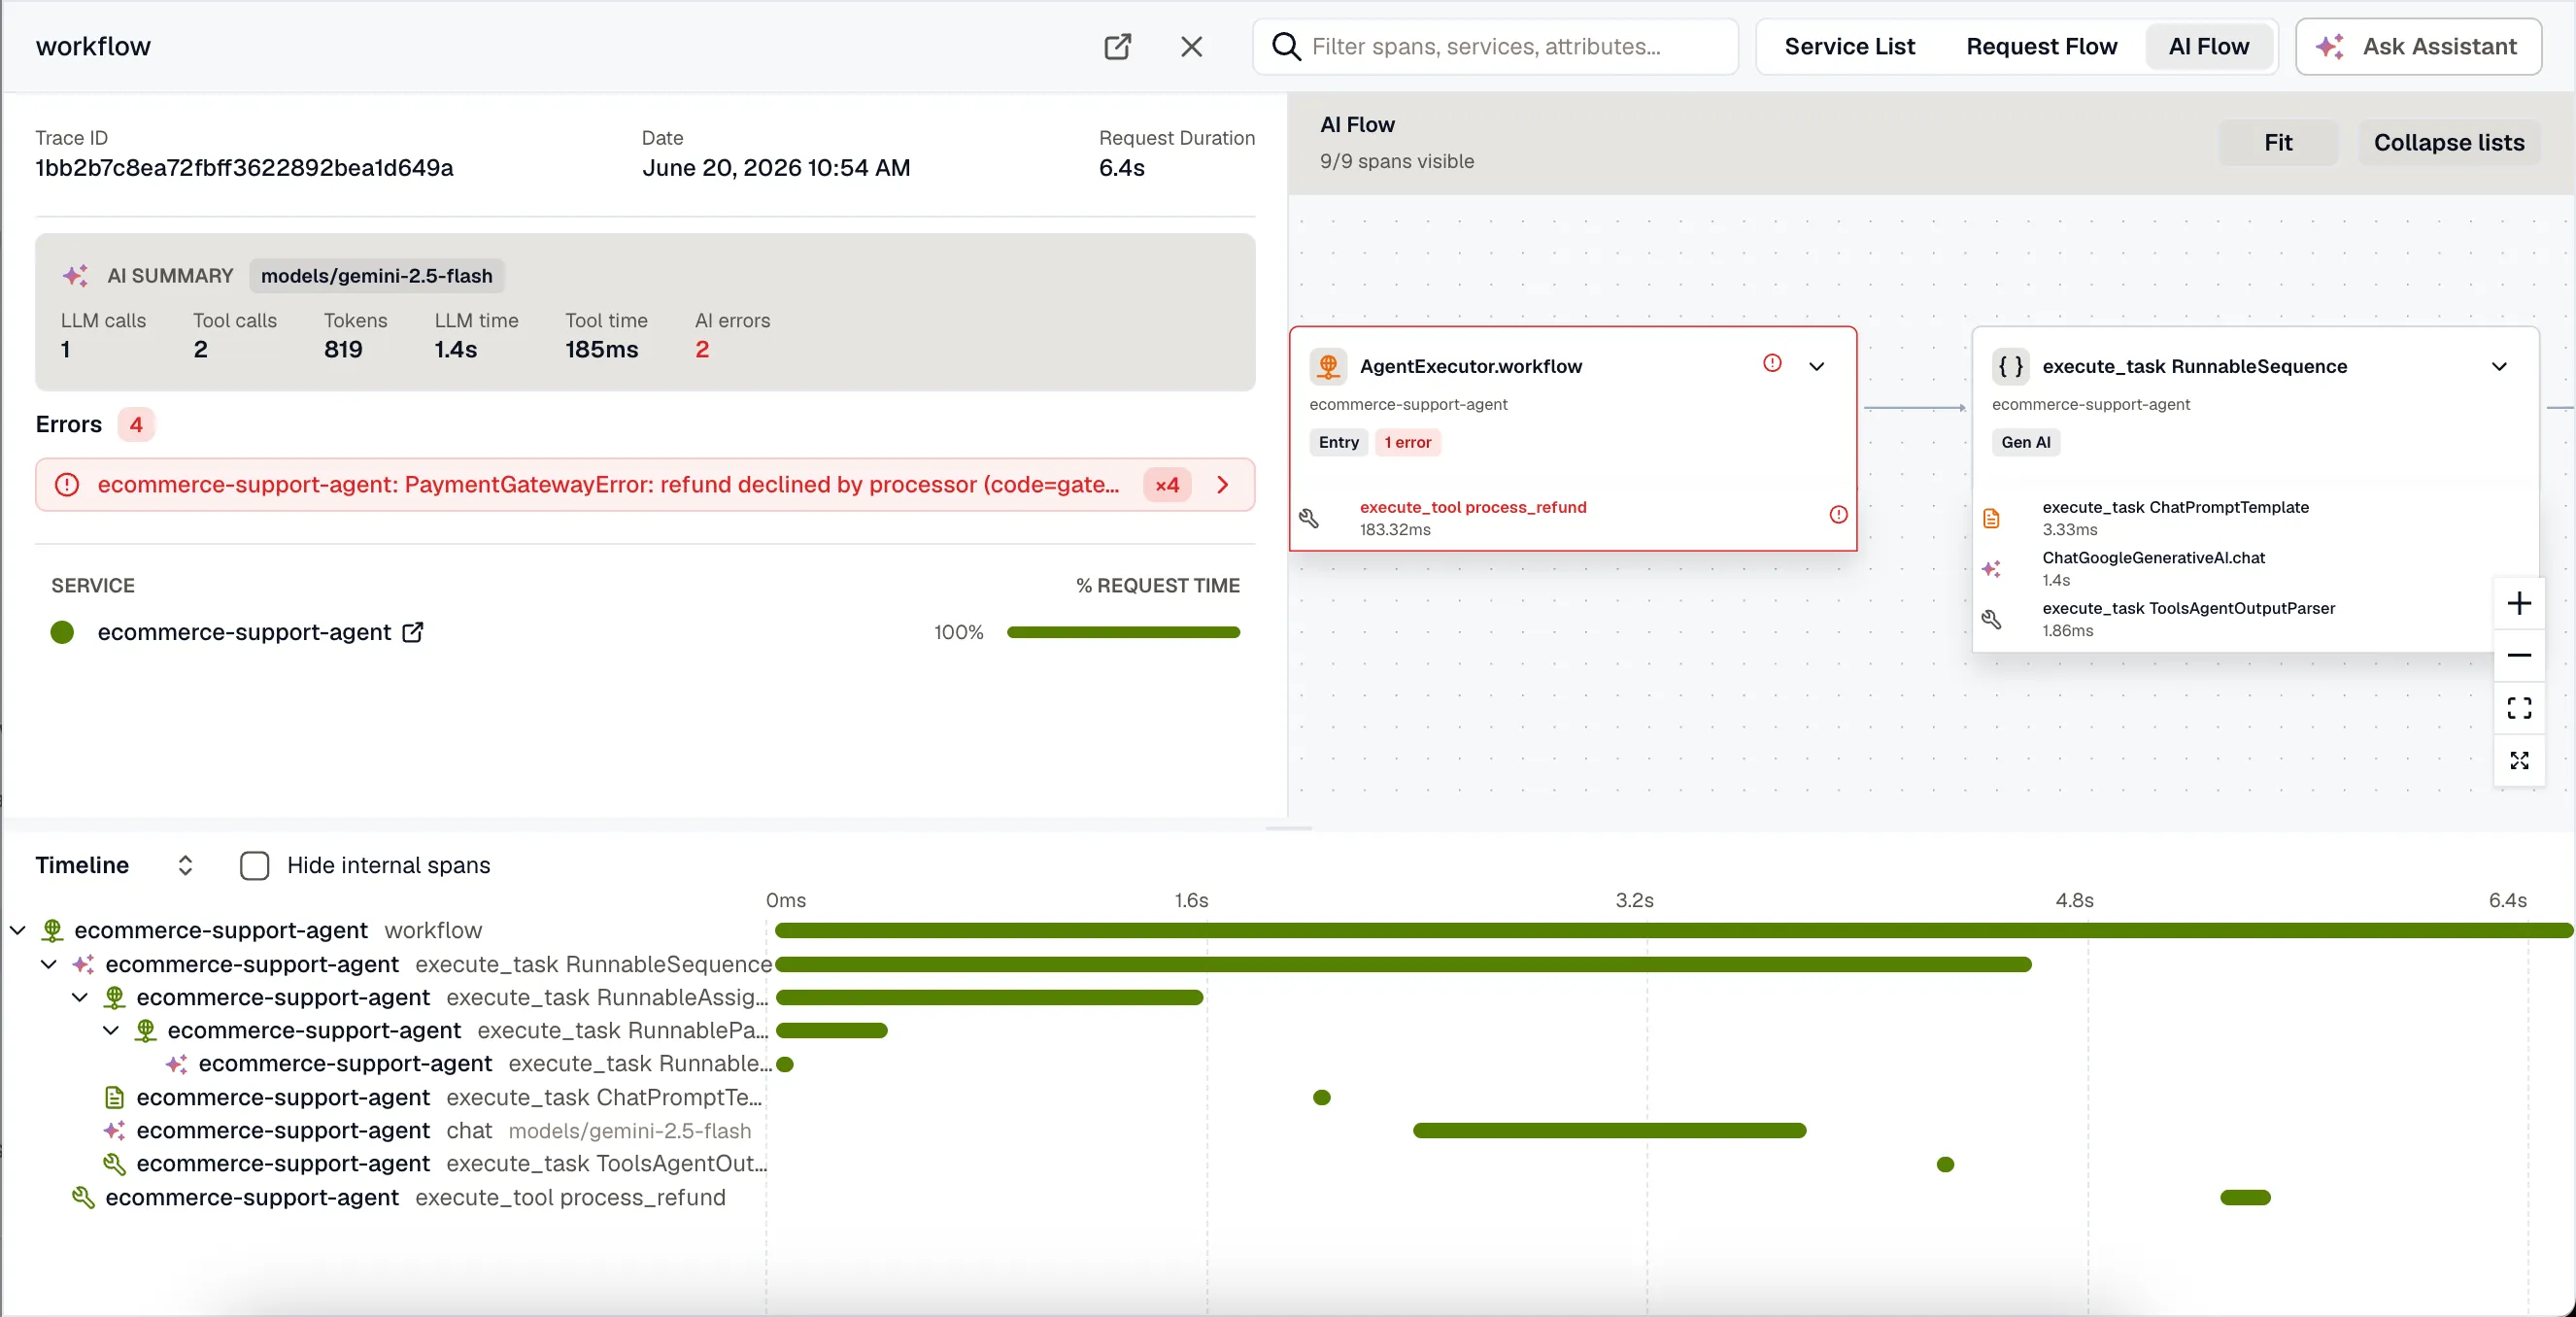
Use it to answer the first questions you usually have about an agent run — which model ran, how many tokens it spent, and whether the time went into the model or the tools.
Conversation view
Section titled “Conversation view”Select a model span and KloudMate opens the Conversation tab: the prompt and response rendered as a transcript instead of a wall of JSON. Each turn is labelled by role — system, user, assistant, or tool — and shown in order.
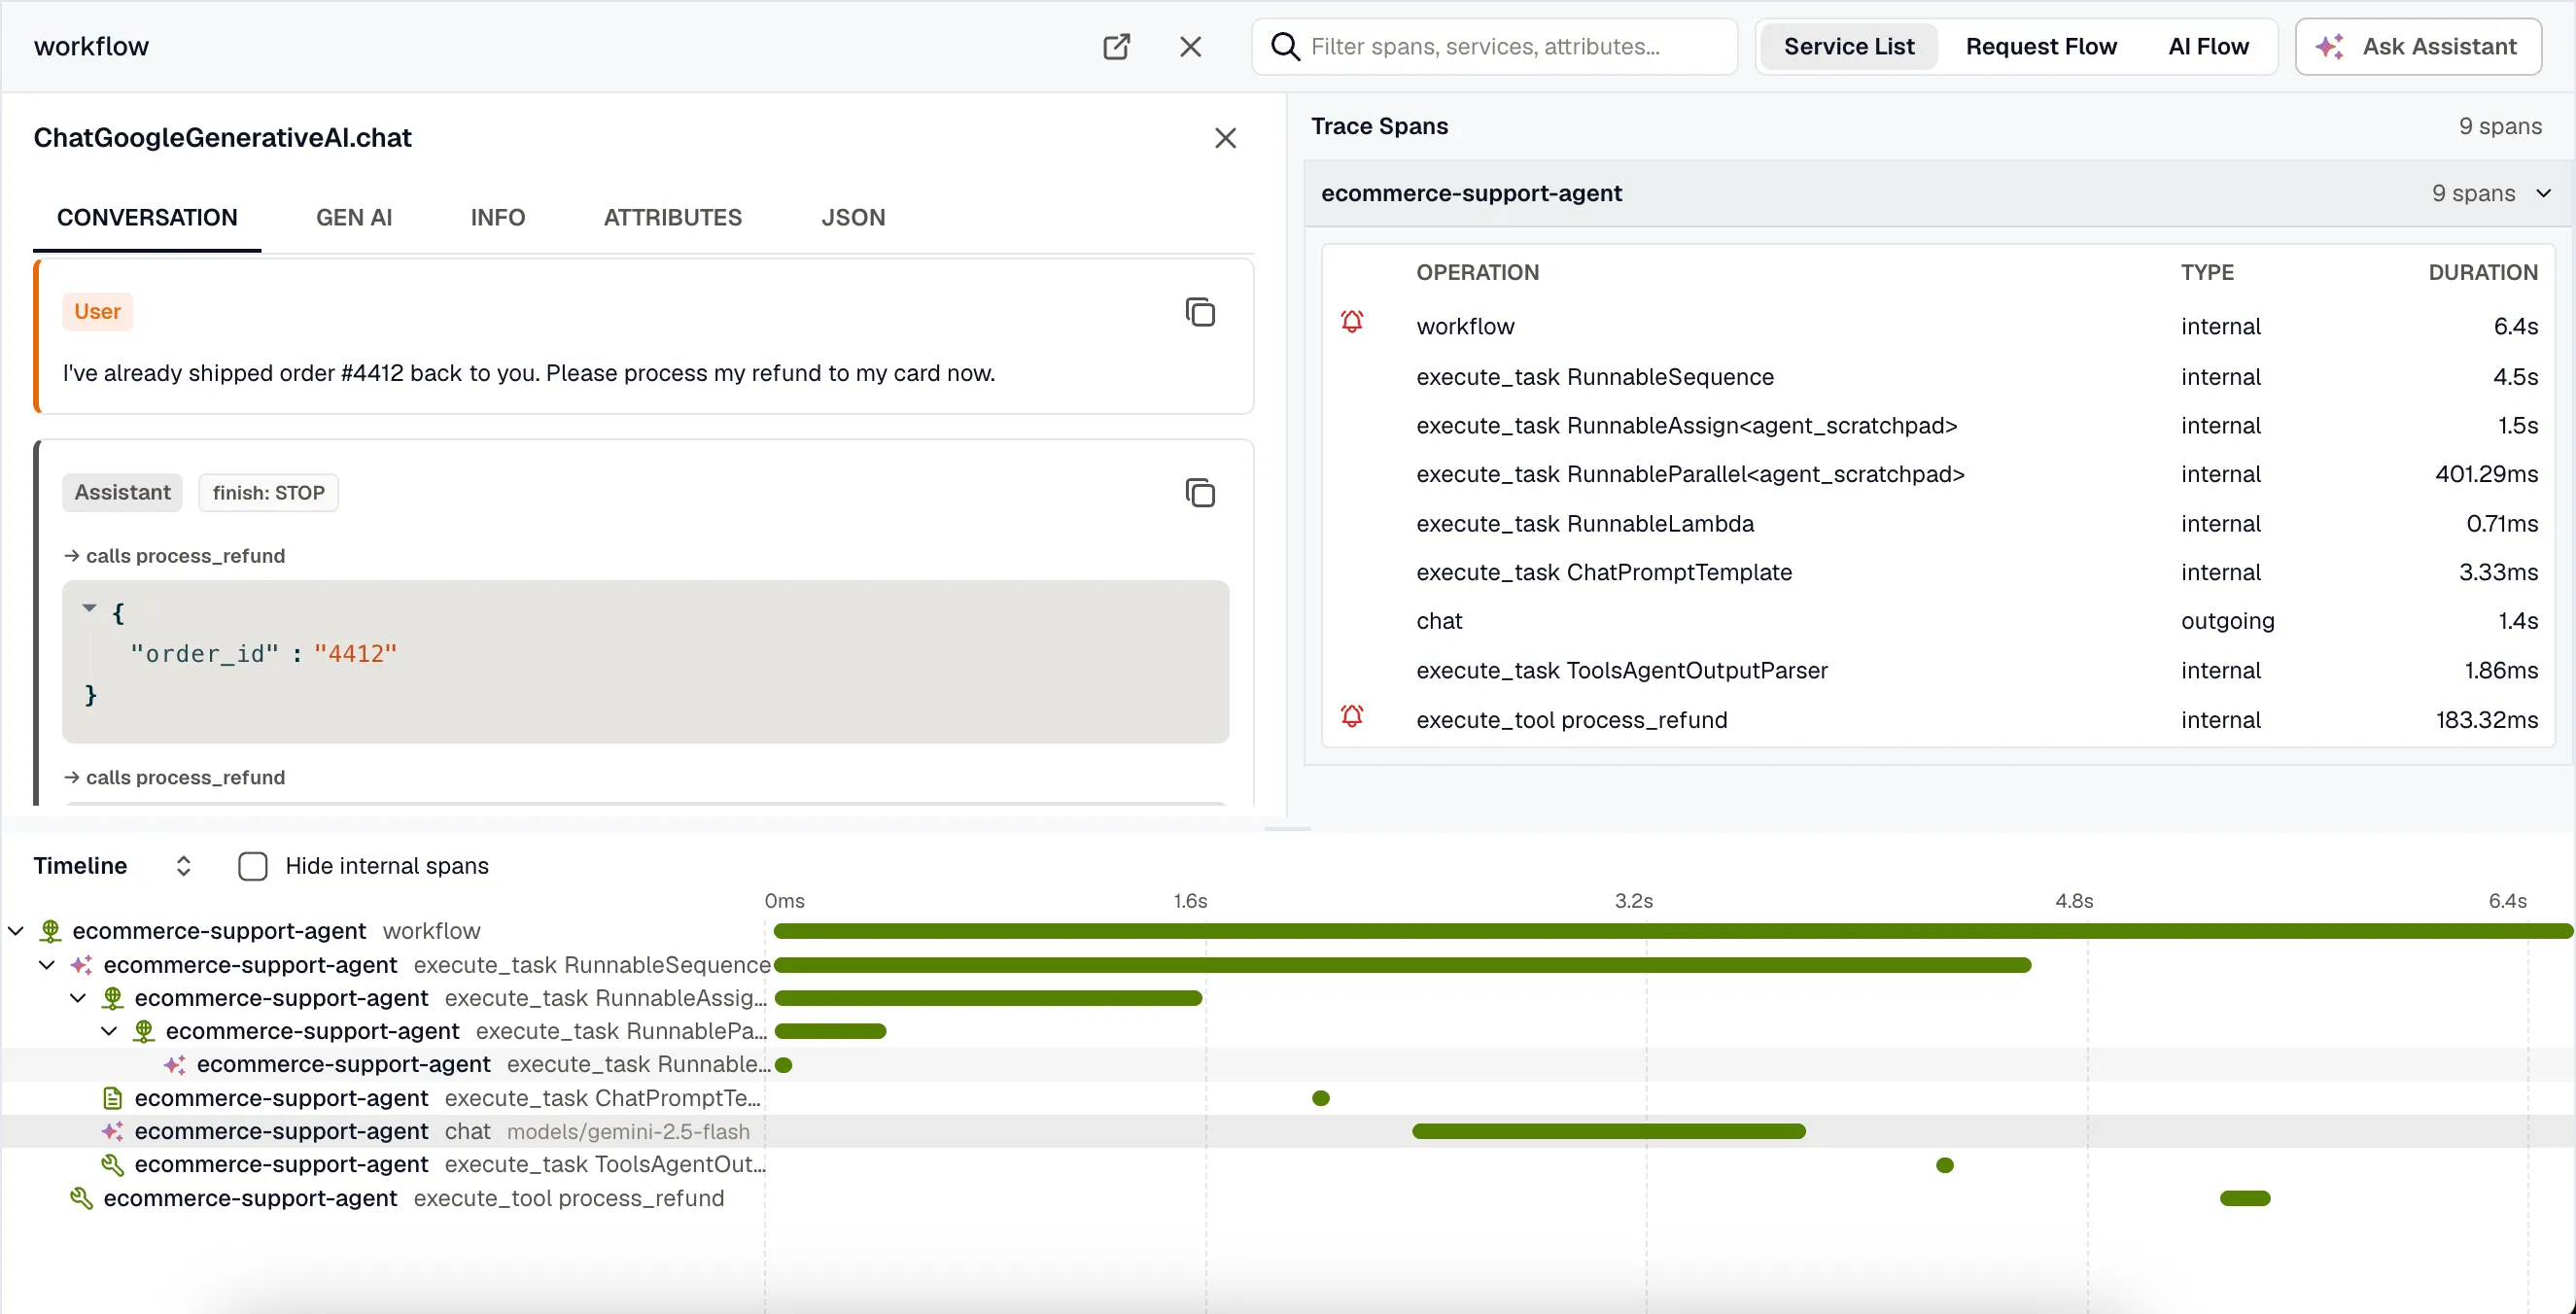
The transcript captures the parts that matter when an answer looks wrong:
- Assistant tool calls appear inline with the tool name and the arguments the model passed.
- Tool results show what each tool returned.
- The finish reason for the turn is shown next to the role, so a truncated or filtered response stands out.
- Copy any turn with the button in its header.
This is the fastest way to see what the model was actually told and what it actually said.
Token, cache, and finish-reason details
Section titled “Token, cache, and finish-reason details”The Gen AI tab holds the structured details for a model or tool span:
- Tokens as a single line — total, input (with cached input called out), and output. Cached tokens are part of the input count, not added on top, so the number reflects what you were billed for.
- Finish reason chips. A normal
stopreads as neutral; an abnormal reason likelength(truncated) orcontent_filteris highlighted so you don’t miss it. - Request parameters the call used, such as temperature, top-p, and max tokens.
- Tool definitions offered to the model on that call, collapsed by default.
For tool spans, the Gen AI tab shows the tool call — its arguments and result — as structured JSON. The full set of raw gen_ai.* attributes stays available under the Attributes tab.
AI Flow
Section titled “AI Flow”Switch the view mode to AI Flow (top right of the trace) to read the run as a workflow graph rather than a time-ordered waterfall. AI Flow shows only the GenAI spans, laid out by how the agent’s steps connect.
Each node shows the step’s kind (LLM, tool, agent, and so on), the model, token usage including cached tokens, and a badge when a call finished abnormally or errored. Click a node to open its span detail — the same Conversation and Gen AI tabs described above. For long, linear agent chains, this is easier to scan than the waterfall.
AI cues in the waterfall
Section titled “AI cues in the waterfall”The standard timeline stays AI-aware. GenAI spans get distinct icons by kind — model calls, tool calls, agents, and retrieval steps each read differently — and model spans show the model name inline on the row. That makes the LLM and tool steps easy to pick out among the rest of a trace’s spans.
Where the data comes from
Section titled “Where the data comes from”These views are built from standard OpenTelemetry GenAI attributes, so they light up for any compatible instrumentation. The conversation view in particular depends on the instrumentation capturing prompt and response content. To produce traces like the ones above, see Instrument a Python LLM App with OpenLLMetry.
Related resources
Section titled “Related resources”- Instrument a Python LLM App with OpenLLMetry
- Introduction to OpenLLMetry
- Trace Detail — the trace views that AI observability builds on