

APM & Tracing
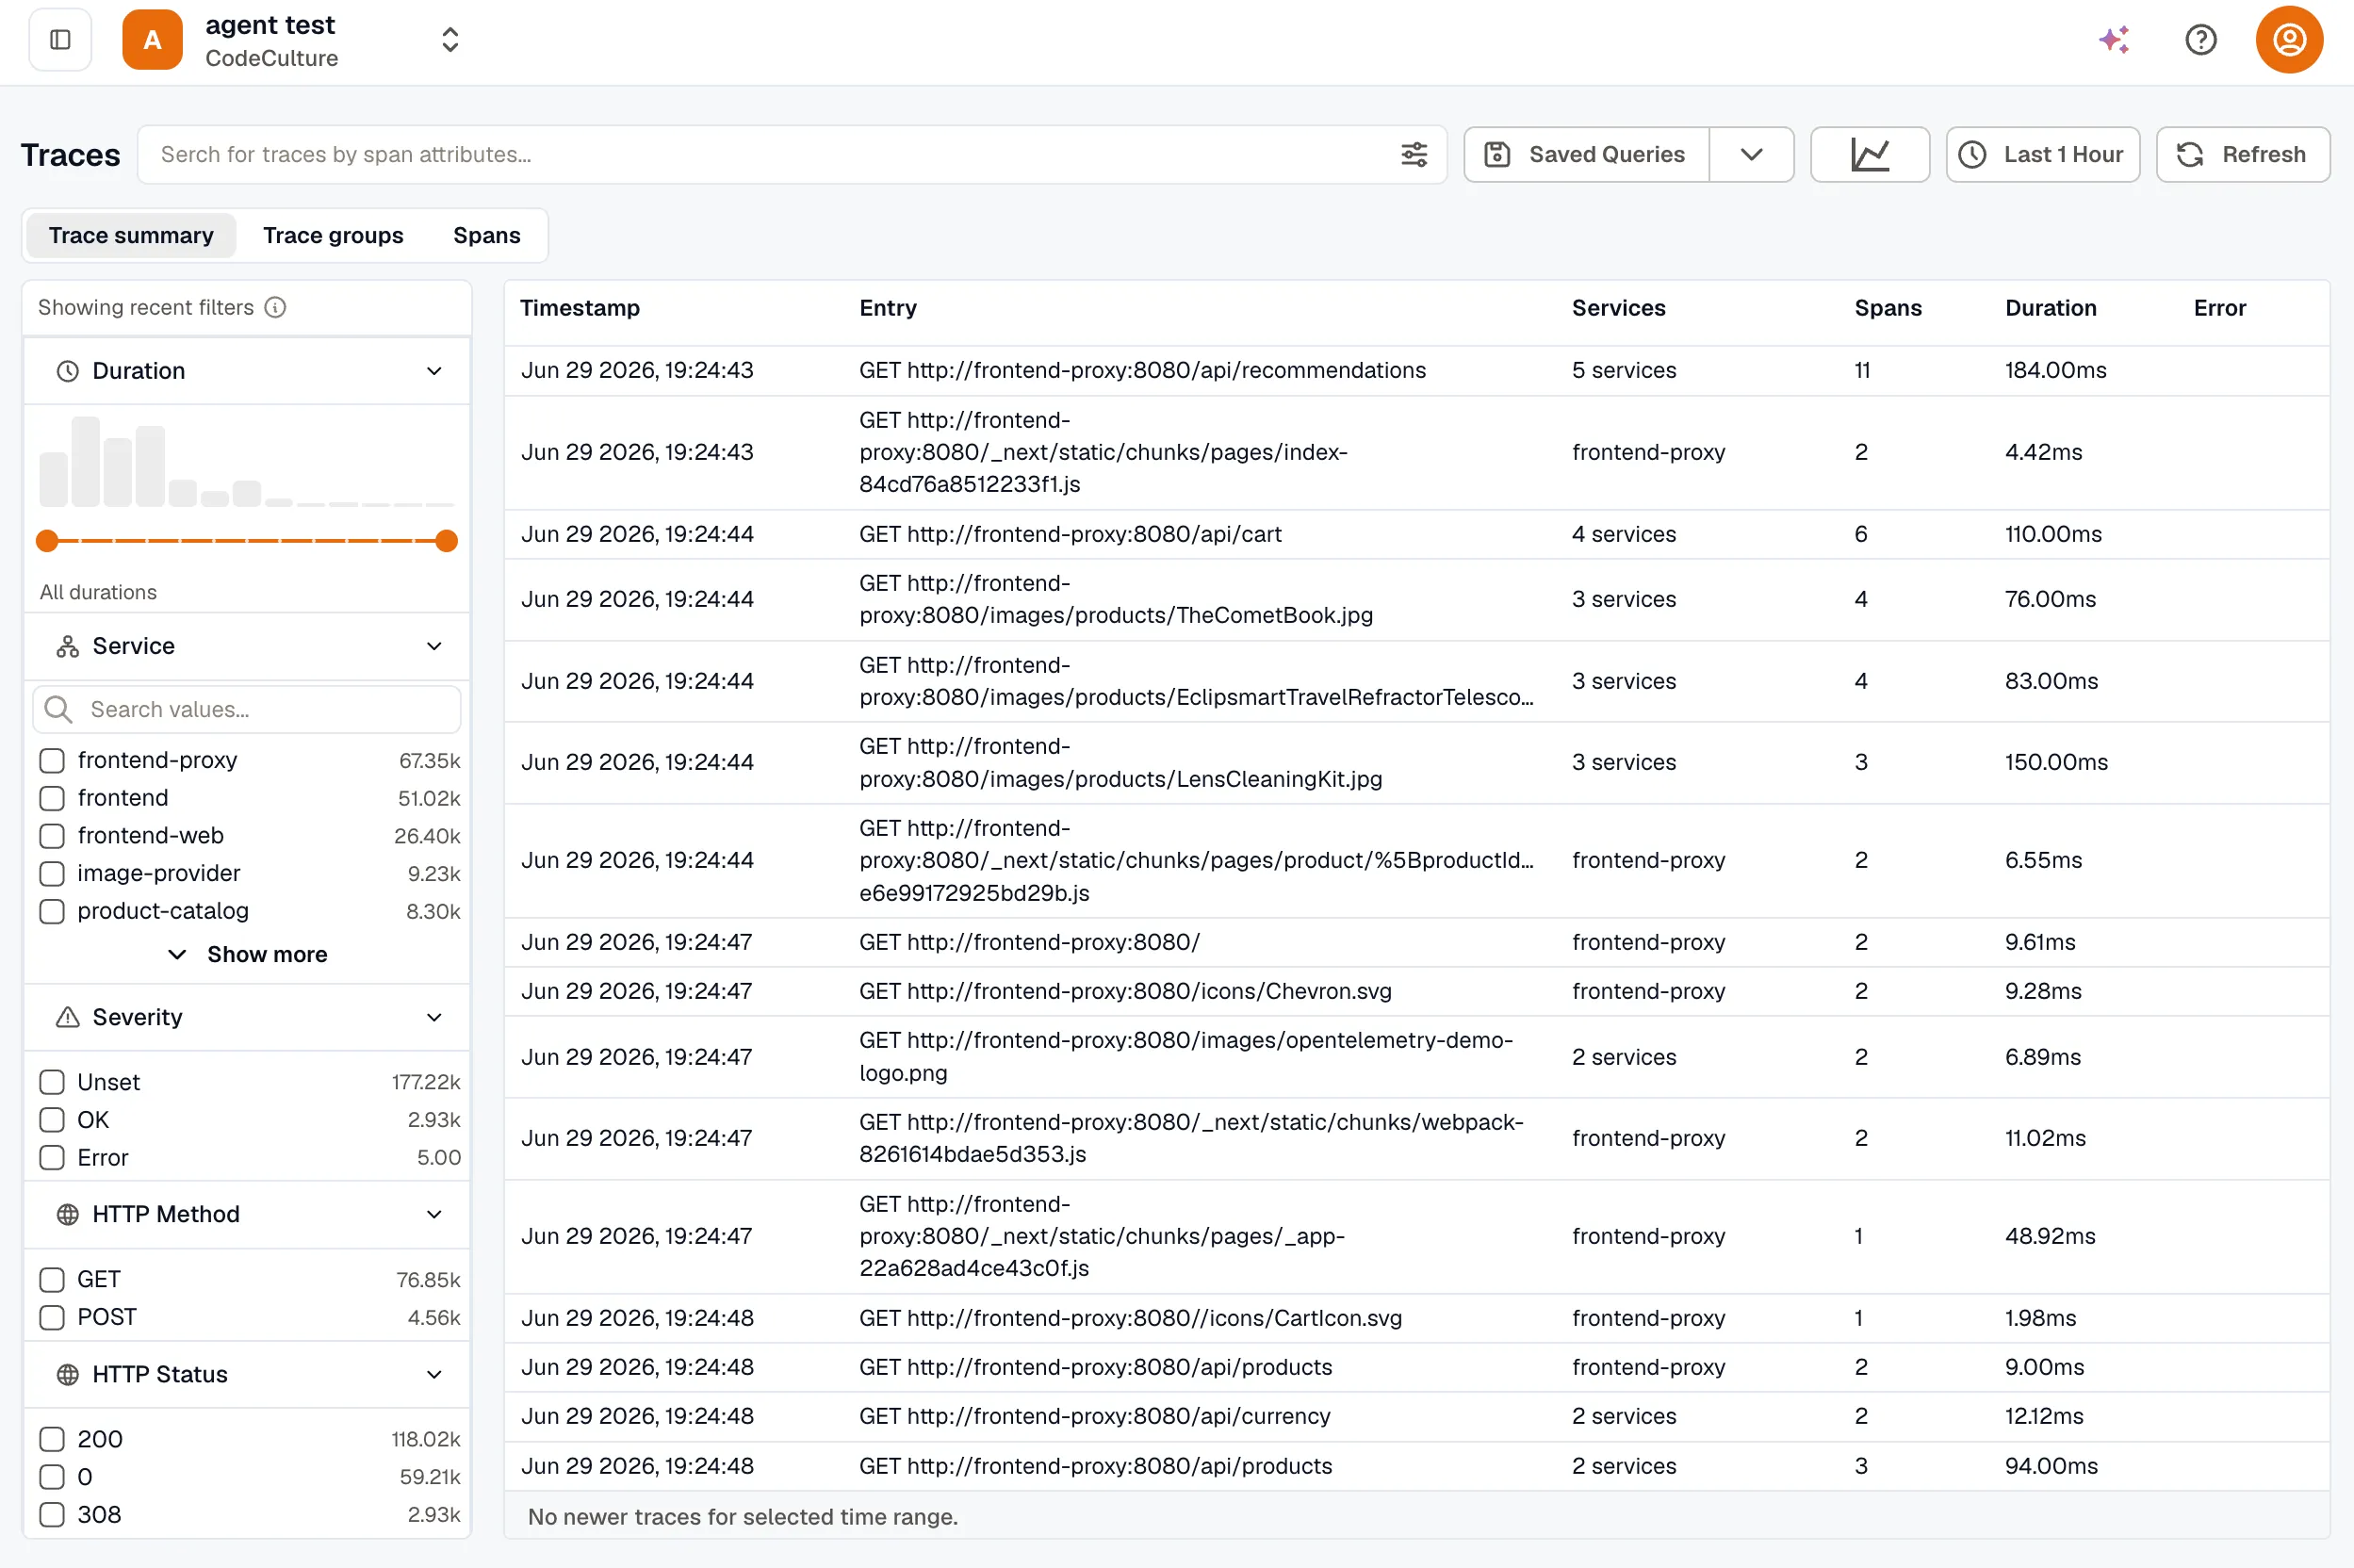
The APM & Tracing section in KloudMate gives you end-to-end visibility into how requests travel across your services, along with service-level health and dependency analysis.
Core Concepts
Section titled “Core Concepts”- APM Views is service-centric. Use it to compare latency, throughput, error rate, and dependencies across services.
- Trace Explorer is request-centric. Use it to search, filter, and find a specific trace.
- Trace Detail is where you inspect one trace — the timeline waterfall, per-span detail, and the Service List, Request Flow, and AI Flow views.
Start in APM Views when you need higher-level service health and dependency analysis. Move to Trace Explorer to find the trace you care about, then open it in Trace Detail to find the root cause.
Get your data in
Section titled “Get your data in”These views are built from traces and RED metrics. There are two ways to produce them:
- Auto-Instrumentation — the KloudMate Agent instruments each service for you with no code change, using eBPF (no restart, any language) or an OpenTelemetry SDK (deep traces, one restart per service). This is the fastest path to a populated service map. Set it up from the agent’s Application APM experience.
- Manual Instrumentation — use the OpenTelemetry SDK in your own code when you need custom spans, business-logic attributes, and application metrics.